Cesena Airbnb Market Analysis 2025: Short Term Rental Data & Vacation Rental Statistics in Emilia-Romagna, Italy
Is Airbnb profitable in Cesena in 2025? Explore comprehensive Airbnb analytics for Cesena, Emilia-Romagna, Italy to uncover income potential. This 2025 STR market report for Cesena, based on AirROI data from April 2024 to March 2025, reveals key trends in the niche market of 97 active listings.
Whether you're considering an Airbnb investment in Cesena, optimizing your existing vacation rental, or exploring rental arbitrage opportunities, understanding the Cesena Airbnb data is crucial. Navigating the high regulation landscape is key to maximizing your short term rental income potential. Let's dive into the specifics.
Key Cesena Airbnb Performance Metrics Overview
Monthly Airbnb Revenue Variations & Income Potential in Cesena (2025)
Understanding the monthly revenue variations for Airbnb listings in Cesena is key to maximizing your short term rental income potential. Seasonality significantly impacts earnings. Our analysis, based on data from the past 12 months, shows that the peak revenue month for STRs in Cesena is typically August, while January often presents the lowest earnings, highlighting opportunities for strategic pricing adjustments during shoulder and low seasons. Explore the typical Airbnb income in Cesena across different performance tiers:
- Best-in-class properties (Top 10%) achieve $2,431+ monthly, often utilizing dynamic pricing and superior guest experiences.
- Strong performing properties (Top 25%) earn $1,818 or more, indicating effective management and desirable locations/amenities.
- Typical properties (Median) generate around $1,002 per month, representing the average market performance.
- Entry-level properties (Bottom 25%) see earnings around $449, often with potential for optimization.
Average Monthly Airbnb Earnings Trend in Cesena
Cesena Airbnb Occupancy Rate Trends (2025)
Maximize your bookings by understanding the Cesena STR occupancy trends. Seasonal demand shifts significantly influence how often properties are booked. Typically, Augustsees the highest demand (peak season occupancy), while January experiences the lowest (low season). Effective strategies, like adjusting minimum stays or offering promotions, can boost occupancy during slower periods. Here's how different property tiers perform in Cesena:
- Best-in-class properties (Top 10%) achieve 78%+ occupancy, indicating high desirability and potentially optimized availability.
- Strong performing properties (Top 25%) maintain 61% or higher occupancy, suggesting good market fit and guest satisfaction.
- Typical properties (Median) have an occupancy rate around 38%.
- Entry-level properties (Bottom 25%) average 19% occupancy, potentially facing higher vacancy.
Average Monthly Occupancy Rate Trend in Cesena
Average Daily Rate (ADR) Airbnb Trends in Cesena (2025)
Effective short term rental pricing strategy in Cesena involves understanding monthly ADR fluctuations. The Average Daily Rate (ADR) for Airbnb in Cesena typically peaks in December and dips lowest during March. Leveraging Airbnb dynamic pricing tools or strategies based on this seasonality can significantly boost revenue. Here's a look at the typical nightly rates achieved:
- Best-in-class properties (Top 10%) command rates of $143+ per night, often due to premium features or locations.
- Strong performing properties (Top 25%) achieve nightly rates of $100 or more.
- Typical properties (Median) charge around $75 per night.
- Entry-level properties (Bottom 25%) earn around $51 per night.
Average Daily Rate (ADR) Trend by Month in Cesena
Get Live Cesena Market Intelligence 👇

Explore Real-time Analytics
Airbnb Seasonality Analysis & Trends in Cesena (2025)
Peak Season (August, July, June)
- Revenue averages $1,696 per month
- Occupancy rates average 48.3%
- Daily rates average $102
Shoulder Season
- Revenue averages $1,295 per month
- Occupancy maintains around 42.0%
- Daily rates hold near $101
Low Season (January, February, March)
- Revenue drops to average $945 per month
- Occupancy decreases to average 33.2%
- Daily rates adjust to average $98
Seasonality Insights for Cesena
- The Airbnb seasonality in Cesena shows highly seasonal trends requiring careful strategy. While the sections above show seasonal averages, it's also insightful to look at the extremes:
- During the high season, the absolute peak month showcases Cesena's highest earning potential, with monthly revenues capable of climbing to $1,801, occupancy reaching a high of 55.2%, and ADRs peaking at $104.
- Conversely, the slowest single month of the year, typically falling within the low season, marks the market's lowest point. In this month, revenue might dip to $823, occupancy could drop to 28.2%, and ADRs may adjust down to $97.
- Understanding both the seasonal averages and these monthly peaks and troughs in revenue, occupancy, and ADR is crucial for maximizing your Airbnb profit potential in Cesena.
Seasonal Strategies for Maximizing Profit
- Peak Season: Maximize revenue through premium pricing and potentially longer minimum stays. Ensure high availability.
- Low Season: Offer competitive pricing, special promotions (e.g., extended stay discounts), and flexible cancellation policies. Target off-season travelers like remote workers or budget-conscious guests.
- Shoulder Seasons: Implement dynamic pricing that balances peak and low rates. Target weekend travelers or specific events. Offer slightly more flexible terms than peak season.
- Regularly analyze your own performance against these Cesena seasonality benchmarks and adjust your pricing and availability strategy accordingly.
Best Areas for Airbnb Investment in Cesena (2025)
Exploring the top neighborhoods for short-term rentals in Cesena? This section highlights key areas, outlining why they are attractive for hosts and guests, along with notable local attractions. Consider these locations based on your target guest profile and investment strategy.
| Neighborhood / Area | Why Host Here? (Target Guests & Appeal) | Key Attractions & Landmarks |
|---|---|---|
| Centro Storico | The historic center of Cesena, known for its beautiful piazzas, medieval architecture, and cultural heritage. A hotspot for tourists exploring Cesena's rich history and local cuisine. | Malatesta Library, Piazza del Popolo, Cesena Cathedral, Rocca Malatestiana, Teatro Bonci |
| Darsena | A picturesque area by the river, popular for its charming atmosphere and relaxed vibe. Ideal for travelers looking to enjoy local cafes and scenic walks along the water. | Darsena Park, Cesena's riverside cafes, Bicycle paths, Nature trails |
| Viale Carducci | A lively avenue lined with shops, restaurants, and bars. Attracts both tourists and locals, making it a vibrant place to stay for those looking for amenities and social life. | Shopping streets, Restaurants, Parks, Street markets |
| Cesenatico | A nearby coastal town known for its beaches and maritime heritage. Excellent for Airbnb hosts looking to attract beachgoers during the summer season. | Cesenatico Beach, Canal Harbor, Maritime Museum, Leonardo's Canal, Beach clubs |
| Bertinoro | A charming hilltop town close to Cesena, famous for its wine and beautiful landscapes. Ideal for guests looking for romantic getaways and culinary experiences. | Castello di Bertinoro, Wine tasting tours, Scenic views, Local festivals |
| Bagno di Romagna | A spa town located amongst the mountains, offering relaxation and wellness experiences. Enticing for guests interested in nature and health tourism. | Thermal baths, Natural parks, Spas, Hiking trails |
| Savignano sul Rubicone | A lovely town on the Rubicon river, known for its historical significance and local culture. Perfect for those looking to explore the Romagna region. | Rubicon River, Local artisan shops, Historical village center |
| Forli | A city close to Cesena with a rich history and modern amenities. Offers a diverse experience for guests looking for both cultural and urban activities. | Forli's Museums, Piazza Saffi, Palazzo del Podesta, Historical architecture |
Understanding Airbnb License Requirements & STR Laws in Cesena (2025)
Yes, Cesena, Emilia-Romagna, Italy enforces high STR regulations. Obtaining a license and ensuring compliance is almost certainly required according to current 2025 STR laws. Always verify the latest short term rental regulations and Airbnb license requirements directly with local government authorities for Cesena to ensure full compliance before hosting.
(Source: AirROI data, 2025, based on 52% licensed listings)
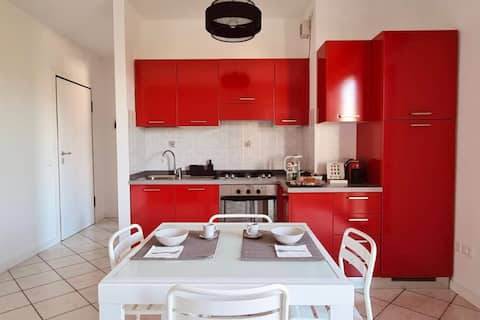
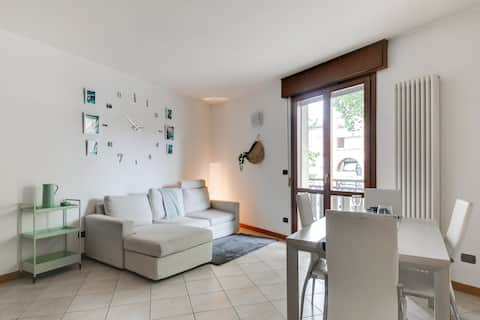
Top Performing Airbnb Properties in Cesena (2025)
Benchmark your potential! Explore examples of top-performing Airbnb properties in Cesenabased on Trailing Twelve Month (TTM) revenue. Analyze their characteristics, revenue, occupancy rate, and ADR to understand what drives success in this market.

Apartment on the way to the sea
Entire Place • 4 bedrooms
Olga & Giò - Close to Centro and Bufalini
Entire Place • 1 bedroom

Casa Quattordici - A stone's throw from the hospital
Entire Place • 1 bedroom
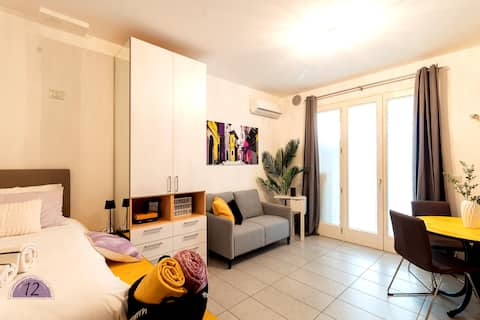
Dimora12 Studio apartment for 2/3 guests in Cesena
Entire Place • N/A
Residence Four-leaf clover
Entire Place • 2 bedrooms

LHE Maison Almerici
Entire Place • 1 bedroom
Note: Performance varies based on location, size, amenities, seasonality, and management quality. Data reflects the past 12 months.
Top Performing Airbnb Hosts in Cesena (2025)
Learn from the best! This table showcases top-performing Airbnb hosts in Cesena based on the number of properties managed and estimated total revenue over the past year. Analyze their scale and performance metrics.
| Host Name | Properties | Grossing Revenue | Stay Reviews | Avg Rating |
|---|---|---|---|---|
| Luca | 8 | $141,186 | 114 | 4.75/5.0 |
| Marco | 1 | $58,936 | 4 | 5.00/5.0 |
| Maria Cristina | 2 | $34,538 | 79 | 4.59/5.0 |
| Anna | 1 | $25,742 | 13 | 5.00/5.0 |
| Carmen | 4 | $25,521 | 154 | 4.88/5.0 |
| Andrea | 1 | $24,593 | 10 | 4.80/5.0 |
| Silvia | 1 | $24,257 | 44 | 4.98/5.0 |
| Cesare | 1 | $24,043 | 12 | 4.92/5.0 |
| Diletta | 1 | $23,316 | 55 | 4.96/5.0 |
| Michelangelo | 1 | $22,905 | 9 | 5.00/5.0 |
Analyzing the strategies of top hosts, such as their property selection, pricing, and guest communication, can offer valuable lessons for optimizing your own Airbnb operations in Cesena.
Dive Deeper: Advanced Cesena STR Market Data (2025)
Ready to unlock more insights? AirROI provides access to advanced metrics and comprehensive Airbnb data for Cesena. Explore detailed analytics beyond this report to refine your investment strategy, optimize pricing, and maximize your vacation rental profits.
Explore Advanced MetricsCesena Short-Term Rental Market Composition (2025): Property & Room Types
Room Type Distribution
Property Type Distribution
Market Composition Insights for Cesena
- The Cesena Airbnb market composition is heavily skewed towards Entire Home/Apt listings, which make up 66% of the 97 active rentals. This indicates strong guest preference for privacy and space.
- However, a notable 34% share for Private Rooms suggests opportunities for budget-conscious travelers or hosts renting out spare rooms.
- Looking at the property type distribution in Cesena, Apartment/Condo properties are the most common (67%), reflecting the local real estate landscape.
- Houses represent a significant 19.6% portion, catering likely to families or larger groups.
- The presence of 12.4% Hotel/Boutique listings indicates integration with traditional hospitality.
- Smaller segments like unique stays (combined 1.0%) offer potential for unique stay experiences.
Cesena Airbnb Room Capacity Analysis (2025): Bedroom Distribution
Distribution of Listings by Number of Bedrooms
Room Capacity Insights for Cesena
- The dominant room capacity in Cesena is 1 bedroom listings, making up 45.4% of the market. This suggests a strong demand for properties suitable for couples or solo travelers.
- Together, 1 bedroom and 2 bedrooms properties represent 65.0% of the active Airbnb listings in Cesena, indicating a high concentration in these sizes.
- Listings with 3+ bedrooms (7.2%) represent a smaller niche, potentially indicating an underserved market for larger group accommodations in Cesena.
Cesena Vacation Rental Guest Capacity Trends (2025)
Distribution of Listings by Guest Capacity
Guest Capacity Insights for Cesena
- The most common guest capacity trend in Cesena vacation rentals is listings accommodating 2 guests (28.9%). This suggests the primary traveler segment is likely couples or solo travelers.
- Properties designed for 2 guests and 4 guests dominate the Cesena STR market, accounting for 49.5% of listings.
- On average, properties in Cesena are equipped to host 2.6 guests.
Cesena Airbnb Booking Patterns (2025): Available vs. Booked Days
Available Days Distribution
Booked Days Distribution
Booking Pattern Insights for Cesena
- The most common availability pattern in Cesena falls within the 271-366 days range, representing 51.5% of listings. This suggests many properties have significant open periods on their calendars.
- Approximately 77.3% of listings show high availability (181+ days open annually), indicating potential for increased bookings or specific owner usage patterns.
- For booked days, the 31-90 days range is most frequent in Cesena (28.9%), reflecting common guest stay durations or potential owner blocking patterns.
- A notable 22.7% of properties secure long booking periods (181+ days booked per year), highlighting successful long-term rental strategies or significant owner usage.
Cesena Airbnb Minimum Stay Requirements Analysis
Distribution of Listings by Minimum Night Requirement
1 Night
33 listings
35.1% of total
2 Nights
27 listings
28.7% of total
3 Nights
3 listings
3.2% of total
4-6 Nights
5 listings
5.3% of total
7-29 Nights
16 listings
17% of total
30+ Nights
10 listings
10.6% of total
Key Insights
- The most prevalent minimum stay requirement in Cesena is 1 Night, adopted by 35.1% of listings. This highlights the market's preference for shorter, flexible bookings.
- A strong majority (63.8%) of the Cesena Airbnb data shows acceptance of very short stays (1-2 nights), indicating a dynamic, high-turnover market.
- A significant segment (10.6%) caters to monthly stays (30+ nights) in Cesena, pointing to opportunities in the extended-stay market.
Recommendations
- Align with the market by considering a 1 Night minimum stay, as 35.1% of Cesena hosts use this setting.
- Explore offering discounts for stays of 30+ nights to attract the 10.6% of the market seeking extended stays.
- Adjust minimum nights based on seasonality – potentially shorter during low season and longer during peak demand periods in Cesena.
Cesena Airbnb Cancellation Policy Trends Analysis (2025)
Flexible
41 listings
48.8% of total
Moderate
37 listings
44% of total
Strict
6 listings
7.1% of total
Cancellation Policy Insights for Cesena
- The prevailing Airbnb cancellation policy trend in Cesena is Flexible, used by 48.8% of listings.
- The market strongly favors guest-friendly terms, with 92.8% of listings offering Flexible or Moderate policies. This suggests guests in Cesena may expect booking flexibility.
- Strict cancellation policies are quite rare (7.1%), potentially making listings with this policy less competitive unless justified by high demand or property type.
Recommendations for Hosts
- Consider adopting a Flexible policy to align with the 48.8% market standard in Cesena.
- Using a Strict policy might deter some guests, as only 7.1% of listings use it. Evaluate if potential revenue protection outweighs possible lower booking rates.
- Regularly review your cancellation policy against competitors and market demand shifts in Cesena.
Cesena STR Booking Lead Time Analysis (2025)
Average Booking Lead Time by Month
Booking Lead Time Insights for Cesena
- The overall average booking lead time for vacation rentals in Cesena is 38 days.
- Guests book furthest in advance for stays during May (average 72 days), likely coinciding with peak travel demand or local events.
- The shortest booking windows occur for stays in December (average 22 days), indicating more last-minute travel plans during this time.
- Seasonally, Spring (52 days avg.) sees the longest lead times, while Winter (27 days avg.) has the shortest, reflecting typical travel planning cycles.
Recommendations for Hosts
- Use the overall average lead time (38 days) as a baseline for your pricing and availability strategy in Cesena.
- For May stays, consider implementing length-of-stay discounts or slightly higher rates for bookings made less than 72 days out to capitalize on advance planning.
- Target marketing efforts for the Spring season well in advance (at least 52 days) to capture early planners.
- Monitor your own booking lead times against these Cesena averages to identify opportunities for dynamic pricing adjustments.
Popular & Essential Airbnb Amenities in Cesena (2025)
Amenity Prevalence
Amenity Insights for Cesena
- Essential amenities in Cesena that guests expect include: Heating. Lacking these (this) could significantly impact bookings.
- Popular amenities like Essentials, Hot water, Kitchen are common but not universal. Offering these can provide a competitive edge.
- Warning: Wifi is not universally provided but is considered essential globally. Ensure reliable Wifi is offered.
Recommendations for Hosts
- Ensure your listing includes all essential amenities for Cesena: Heating.
- Prioritize adding missing essentials: Heating.
- Consider adding popular differentiators like Essentials or Hot water to increase appeal.
- Highlight unique or less common amenities you offer (e.g., hot tub, dedicated workspace, EV charger) in your listing description and photos.
- Regularly check competitor amenities in Cesena to stay competitive.
Cesena Airbnb Guest Demographics & Profile Analysis (2025)
Guest Profile Summary for Cesena
- The typical guest profile for Airbnb in Cesena consists of a mix of domestic (64%) and international guests, often arriving from nearby Milan, typically belonging to the Post-2000s (Gen Z/Alpha) group (50%), primarily speaking English or Italian.
- Domestic travelers account for 64.2% of guests.
- Key international markets include Italy (64.2%) and Germany (6.4%).
- Top languages spoken are English (34.1%) followed by Italian (31.1%).
- A significant demographic segment is the Post-2000s (Gen Z/Alpha) group, representing 50% of guests.
Recommendations for Hosts
- Target domestic marketing efforts towards travelers from Milan and Rome.
- Tailor amenities and listing descriptions to appeal to the dominant Post-2000s (Gen Z/Alpha) demographic (e.g., highlight fast WiFi, smart home features, local guides).
- Highlight unique local experiences or amenities relevant to the primary guest profile.
- Consider seasonal promotions aligned with peak travel times for key origin markets.
Nearby Short-Term Rental Market Comparison
How does the Cesena Airbnb market stack up against its neighbors? Compare key performance metrics like average monthly revenue, ADR, and occupancy rates in surrounding areas to understand the broader regional STR landscape.
| Market | Active Properties | Monthly Revenue | Daily Rate | Avg. Occupancy |
|---|---|---|---|---|
| Selina | 14 | $4,330 | $440.33 | 47% |
| Venice | 6,405 | $3,454 | $238.80 | 53% |
| Tignano | 10 | $3,391 | $500.31 | 36% |
| Buonconvento | 59 | $3,068 | $456.70 | 46% |
| Florence | 9,598 | $2,833 | $208.48 | 52% |
| Rojnići | 13 | $2,827 | $244.42 | 48% |
| Marcialla | 25 | $2,788 | $236.61 | 54% |
| Impruneta | 131 | $2,761 | $237.93 | 45% |
| Sveti Petar u Šumi | 42 | $2,737 | $316.96 | 45% |
| Marciano della Chiana | 18 | $2,719 | $377.32 | 35% |