Praia a Mare Airbnb Market Analysis 2025: Short Term Rental Data & Vacation Rental Statistics in Cosenza, Italy
Is Airbnb profitable in Praia a Mare in 2025? Explore comprehensive Airbnb analytics for Praia a Mare, Cosenza, Italy to uncover income potential. This 2025 STR market report for Praia a Mare, based on AirROI data from April 2024 to March 2025, reveals key trends in the niche market of 23 active listings.
Whether you're considering an Airbnb investment in Praia a Mare, optimizing your existing vacation rental, or exploring rental arbitrage opportunities, understanding the Praia a Mare Airbnb data is crucial. Leveraging the low regulation environment is key to maximizing your short term rental income potential. Let's dive into the specifics.
Key Praia a Mare Airbnb Performance Metrics Overview
Monthly Airbnb Revenue Variations & Income Potential in Praia a Mare (2025)
Understanding the monthly revenue variations for Airbnb listings in Praia a Mare is key to maximizing your short term rental income potential. Seasonality significantly impacts earnings. Our analysis, based on data from the past 12 months, shows that the peak revenue month for STRs in Praia a Mare is typically August, while November often presents the lowest earnings, highlighting opportunities for strategic pricing adjustments during shoulder and low seasons. Explore the typical Airbnb income in Praia a Mare across different performance tiers:
- Best-in-class properties (Top 10%) achieve $2,304+ monthly, often utilizing dynamic pricing and superior guest experiences.
- Strong performing properties (Top 25%) earn $1,362 or more, indicating effective management and desirable locations/amenities.
- Typical properties (Median) generate around $630 per month, representing the average market performance.
- Entry-level properties (Bottom 25%) see earnings around $299, often with potential for optimization.
Average Monthly Airbnb Earnings Trend in Praia a Mare
Praia a Mare Airbnb Occupancy Rate Trends (2025)
Maximize your bookings by understanding the Praia a Mare STR occupancy trends. Seasonal demand shifts significantly influence how often properties are booked. Typically, Augustsees the highest demand (peak season occupancy), while January experiences the lowest (low season). Effective strategies, like adjusting minimum stays or offering promotions, can boost occupancy during slower periods. Here's how different property tiers perform in Praia a Mare:
- Best-in-class properties (Top 10%) achieve 45%+ occupancy, indicating high desirability and potentially optimized availability.
- Strong performing properties (Top 25%) maintain 26% or higher occupancy, suggesting good market fit and guest satisfaction.
- Typical properties (Median) have an occupancy rate around 16%.
- Entry-level properties (Bottom 25%) average 9% occupancy, potentially facing higher vacancy.
Average Monthly Occupancy Rate Trend in Praia a Mare
Average Daily Rate (ADR) Airbnb Trends in Praia a Mare (2025)
Effective short term rental pricing strategy in Praia a Mare involves understanding monthly ADR fluctuations. The Average Daily Rate (ADR) for Airbnb in Praia a Mare typically peaks in August and dips lowest during October. Leveraging Airbnb dynamic pricing tools or strategies based on this seasonality can significantly boost revenue. Here's a look at the typical nightly rates achieved:
- Best-in-class properties (Top 10%) command rates of $196+ per night, often due to premium features or locations.
- Strong performing properties (Top 25%) achieve nightly rates of $119 or more.
- Typical properties (Median) charge around $85 per night.
- Entry-level properties (Bottom 25%) earn around $58 per night.
Average Daily Rate (ADR) Trend by Month in Praia a Mare
Get Live Praia a Mare Market Intelligence 👇

Explore Real-time Analytics
Airbnb Seasonality Analysis & Trends in Praia a Mare (2025)
Peak Season (August, October, July)
- Revenue averages $2,137 per month
- Occupancy rates average 34.6%
- Daily rates average $134
Shoulder Season
- Revenue averages $808 per month
- Occupancy maintains around 15.4%
- Daily rates hold near $128
Low Season (February, April, November)
- Revenue drops to average $299 per month
- Occupancy decreases to average 17.5%
- Daily rates adjust to average $128
Seasonality Insights for Praia a Mare
- The Airbnb seasonality in Praia a Mare shows highly seasonal trends requiring careful strategy. While the sections above show seasonal averages, it's also insightful to look at the extremes:
- During the high season, the absolute peak month showcases Praia a Mare's highest earning potential, with monthly revenues capable of climbing to $2,593, occupancy reaching a high of 45.4%, and ADRs peaking at $141.
- Conversely, the slowest single month of the year, typically falling within the low season, marks the market's lowest point. In this month, revenue might dip to $166, occupancy could drop to 3.2%, and ADRs may adjust down to $124.
- Understanding both the seasonal averages and these monthly peaks and troughs in revenue, occupancy, and ADR is crucial for maximizing your Airbnb profit potential in Praia a Mare.
Seasonal Strategies for Maximizing Profit
- Peak Season: Maximize revenue through premium pricing and potentially longer minimum stays. Ensure high availability.
- Low Season: Offer competitive pricing, special promotions (e.g., extended stay discounts), and flexible cancellation policies. Target off-season travelers like remote workers or budget-conscious guests.
- Shoulder Seasons: Implement dynamic pricing that balances peak and low rates. Target weekend travelers or specific events. Offer slightly more flexible terms than peak season.
- Regularly analyze your own performance against these Praia a Mare seasonality benchmarks and adjust your pricing and availability strategy accordingly.
Best Areas for Airbnb Investment in Praia a Mare (2025)
Exploring the top neighborhoods for short-term rentals in Praia a Mare? This section highlights key areas, outlining why they are attractive for hosts and guests, along with notable local attractions. Consider these locations based on your target guest profile and investment strategy.
| Neighborhood / Area | Why Host Here? (Target Guests & Appeal) | Key Attractions & Landmarks |
|---|---|---|
| Praia a Mare Beach | Popular with tourists for its beautiful sandy beaches and crystal-clear water. Ideal for summer vacationers looking for a relaxing getaway by the sea. | Praia a Mare Beach, Torre di Fiuzzi, AquaFans Water Park, Isola di Dino, Cave of the Nymphs |
| Centro Storico | The historic center of Praia a Mare, offering charming streets and local shops. Attracts visitors interested in culture and history, with easy access to attractions. | Church of Santa Maria del Lauro, Piazza Re Umberto, Old Town streets, local eateries, Cultural events |
| Torre del Mare | Scenic area with stunning sea views and access to various water sports. Perfect for families and adventure seekers who enjoy outdoor activities. | Torre del Mare Beach, Boardwalk along the coast, Snorkeling and diving spots, Boat rentals, Local seafood restaurants |
| Isola di Dino | A beautiful island known for its natural caves and stunning cliffs. Ideal for tourists who love nature, hiking, and unique experiences. | Caves of Isola di Dino, Hiking trails, Scenic boat tours, Wildlife watching, Beaches |
| La Secca | A tranquil beach area favored by locals for its clear waters and relaxed atmosphere. Great for visitors looking for a less crowded experience. | La Secca Beach, Picnic areas, Sunbathing spots, Calm waters for swimming, Local beach bars |
| Villaggi turistici | Resort areas with various accommodations and family-friendly activities. Attracts families looking for a full-service vacation experience. | Resort facilities, Swimming pools, Kids' clubs, Entertainment programs, Shopping areas |
| Parco Nazionale del Pollino | Nearby national park known for its stunning natural landscapes and outdoor activities. Appeals to adventure travelers and nature lovers. | Hiking trails, Mountain views, Wildlife encounters, Camping spots, Picnic areas |
| Market Street | A vibrant area filled with local markets, shops, and eateries. Great for tourists wanting to experience local culture and cuisine. | Local farmers' market, Shops and boutiques, Street food stalls, Cafés, Cultural festivals |
Understanding Airbnb License Requirements & STR Laws in Praia a Mare (2025)
While Praia a Mare, Cosenza, Italy currently shows low STR regulations, specific Airbnb license requirements might still exist or change. Always verify the latest short term rental regulations and Airbnb license requirements directly with local government authorities for Praia a Mare to ensure full compliance before hosting.
(Source: AirROI data, 2025, based on 9% licensed listings)
Top Performing Airbnb Properties in Praia a Mare (2025)
Benchmark your potential! Explore examples of top-performing Airbnb properties in Praia a Marebased on Trailing Twelve Month (TTM) revenue. Analyze their characteristics, revenue, occupancy rate, and ADR to understand what drives success in this market.
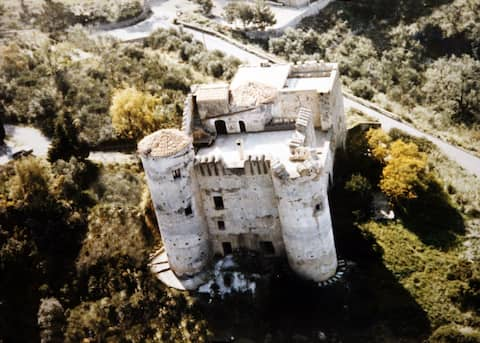
Castello della Foresta del XII con vista mare
Entire Place • 8 bedrooms
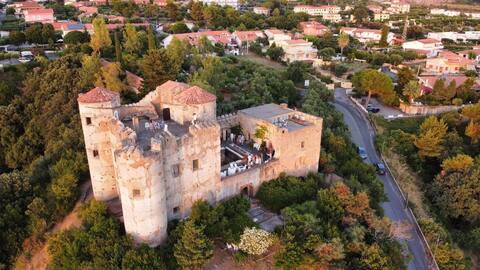
Praia a Mare Castle for 10 people with sea views
Entire Place • 5 bedrooms
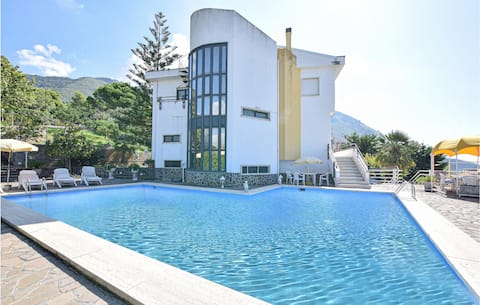
Villa Adriana
Entire Place • 5 bedrooms

Appartamentino charmant sul mare
Entire Place • 2 bedrooms
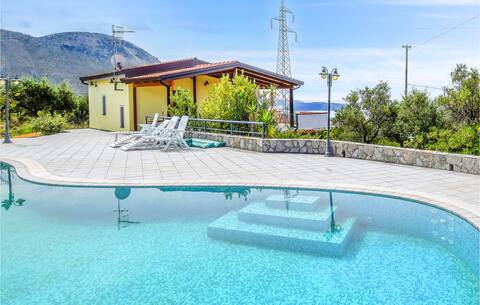
Villa Francesca
Entire Place • 4 bedrooms

Fantastic sea view with large terrace and garden
Entire Place • 2 bedrooms
Note: Performance varies based on location, size, amenities, seasonality, and management quality. Data reflects the past 12 months.
Top Performing Airbnb Hosts in Praia a Mare (2025)
Learn from the best! This table showcases top-performing Airbnb hosts in Praia a Mare based on the number of properties managed and estimated total revenue over the past year. Analyze their scale and performance metrics.
| Host Name | Properties | Grossing Revenue | Stay Reviews | Avg Rating |
|---|---|---|---|---|
| Olga | 2 | $67,552 | 9 | 2.38/5.0 |
| Novasol | 1 | $22,250 | 4 | 4.00/5.0 |
| Giuseppe | 2 | $16,058 | 19 | 4.94/5.0 |
| Host #13448797 | 1 | $12,373 | 51 | 4.86/5.0 |
| Host #153915560 | 1 | $12,166 | 0 | 0.00/5.0 |
| Martina | 4 | $9,672 | 162 | 4.44/5.0 |
| Host #409609082 | 1 | $6,386 | 18 | 4.89/5.0 |
| Corrado | 1 | $5,329 | 5 | 4.40/5.0 |
| Luca | 1 | $5,189 | 28 | 4.50/5.0 |
| Davide | 1 | $4,993 | 18 | 4.22/5.0 |
Analyzing the strategies of top hosts, such as their property selection, pricing, and guest communication, can offer valuable lessons for optimizing your own Airbnb operations in Praia a Mare.
Dive Deeper: Advanced Praia a Mare STR Market Data (2025)
Ready to unlock more insights? AirROI provides access to advanced metrics and comprehensive Airbnb data for Praia a Mare. Explore detailed analytics beyond this report to refine your investment strategy, optimize pricing, and maximize your vacation rental profits.
Explore Advanced MetricsPraia a Mare Short-Term Rental Market Composition (2025): Property & Room Types
Room Type Distribution
Property Type Distribution
Market Composition Insights for Praia a Mare
- The Praia a Mare Airbnb market composition is heavily skewed towards Entire Home/Apt listings, which make up 73.9% of the 23 active rentals. This indicates strong guest preference for privacy and space.
- Looking at the property type distribution in Praia a Mare, House properties are the most common (60.9%), reflecting the local real estate landscape.
- Houses represent a significant 60.9% portion, catering likely to families or larger groups.
- The presence of 8.7% Hotel/Boutique listings indicates integration with traditional hospitality.
Praia a Mare Airbnb Room Capacity Analysis (2025): Bedroom Distribution
Distribution of Listings by Number of Bedrooms
Room Capacity Insights for Praia a Mare
- The dominant room capacity in Praia a Mare is 2 bedrooms listings, making up 39.1% of the market. This suggests a strong demand for properties suitable for couples or solo travelers.
- Together, 2 bedrooms and 1 bedroom properties represent 69.5% of the active Airbnb listings in Praia a Mare, indicating a high concentration in these sizes.
- A significant 26.0% of listings offer 3+ bedrooms, catering to larger groups and families seeking more space in Praia a Mare.
Praia a Mare Vacation Rental Guest Capacity Trends (2025)
Distribution of Listings by Guest Capacity
Guest Capacity Insights for Praia a Mare
- The most common guest capacity trend in Praia a Mare vacation rentals is listings accommodating 2 guests (21.7%). This suggests the primary traveler segment is likely couples or solo travelers.
- Properties designed for 2 guests and 6 guests dominate the Praia a Mare STR market, accounting for 43.4% of listings.
- 47.7% of properties accommodate 6+ guests, serving the market segment for larger families or group travel in Praia a Mare.
- On average, properties in Praia a Mare are equipped to host 4.7 guests.
Praia a Mare Airbnb Booking Patterns (2025): Available vs. Booked Days
Available Days Distribution
Booked Days Distribution
Booking Pattern Insights for Praia a Mare
- The most common availability pattern in Praia a Mare falls within the 271-366 days range, representing 95.7% of listings. This suggests many properties have significant open periods on their calendars.
- Approximately 100.0% of listings show high availability (181+ days open annually), indicating potential for increased bookings or specific owner usage patterns.
- For booked days, the 31-90 days range is most frequent in Praia a Mare (60.9%), reflecting common guest stay durations or potential owner blocking patterns.
Praia a Mare Airbnb Minimum Stay Requirements Analysis
Distribution of Listings by Minimum Night Requirement
1 Night
1 listings
5.9% of total
2 Nights
5 listings
29.4% of total
4-6 Nights
2 listings
11.8% of total
7-29 Nights
8 listings
47.1% of total
30+ Nights
1 listings
5.9% of total
Key Insights
- The most prevalent minimum stay requirement in Praia a Mare is 7-29 Nights, adopted by 47.1% of listings. This highlights the market's preference for shorter, flexible bookings.
Recommendations
- Align with the market by considering a 7-29 Nights minimum stay, as 47.1% of Praia a Mare hosts use this setting.
- If feasible, allowing 1-night stays, especially midweek or during low season, could capture last-minute bookings, as only 5.9% currently do.
- Explore offering discounts for stays of 30+ nights to attract the 5.9% of the market seeking extended stays.
- Adjust minimum nights based on seasonality – potentially shorter during low season and longer during peak demand periods in Praia a Mare.
Praia a Mare Airbnb Cancellation Policy Trends Analysis (2025)
Super Strict 60 Days
1 listings
4.8% of total
Flexible
7 listings
33.3% of total
Moderate
5 listings
23.8% of total
Strict
8 listings
38.1% of total
Cancellation Policy Insights for Praia a Mare
- The prevailing Airbnb cancellation policy trend in Praia a Mare is Strict, used by 38.1% of listings.
- There's a relatively balanced mix between guest-friendly (57.1%) and stricter (38.1%) policies, offering choices for different guest needs.
Recommendations for Hosts
- Consider adopting a Strict policy to align with the 38.1% market standard in Praia a Mare.
- With 38.1% using Strict terms, this is a viable option in Praia a Mare, particularly for high-value properties or during peak demand periods.
- Regularly review your cancellation policy against competitors and market demand shifts in Praia a Mare.
Praia a Mare STR Booking Lead Time Analysis (2025)
Average Booking Lead Time by Month
Booking Lead Time Insights for Praia a Mare
- The overall average booking lead time for vacation rentals in Praia a Mare is 54 days.
- Guests book furthest in advance for stays during May (average 132 days), likely coinciding with peak travel demand or local events.
- The shortest booking windows occur for stays in January (average 13 days), indicating more last-minute travel plans during this time.
- Seasonally, Spring (97 days avg.) sees the longest lead times, while Winter (39 days avg.) has the shortest, reflecting typical travel planning cycles.
Recommendations for Hosts
- Use the overall average lead time (54 days) as a baseline for your pricing and availability strategy in Praia a Mare.
- For May stays, consider implementing length-of-stay discounts or slightly higher rates for bookings made less than 132 days out to capitalize on advance planning.
- During January, focus on last-minute booking availability and promotions, as guests book with very short notice (13 days avg.).
- Target marketing efforts for the Spring season well in advance (at least 97 days) to capture early planners.
- Monitor your own booking lead times against these Praia a Mare averages to identify opportunities for dynamic pricing adjustments.
Popular & Essential Airbnb Amenities in Praia a Mare (2025)
Amenity Prevalence
Amenity Insights for Praia a Mare
- Essential amenities in Praia a Mare that guests expect include: Washer, Hot water, TV, Kitchen. Lacking these (any) could significantly impact bookings.
- Popular amenities like Air conditioning, Refrigerator, Dishes and silverware are common but not universal. Offering these can provide a competitive edge.
Recommendations for Hosts
- Ensure your listing includes all essential amenities for Praia a Mare: Washer, Hot water, TV, Kitchen.
- Prioritize adding missing essentials: Washer, Hot water, TV, Kitchen.
- Consider adding popular differentiators like Air conditioning or Refrigerator to increase appeal.
- Highlight unique or less common amenities you offer (e.g., hot tub, dedicated workspace, EV charger) in your listing description and photos.
- Regularly check competitor amenities in Praia a Mare to stay competitive.
Praia a Mare Airbnb Guest Demographics & Profile Analysis (2025)
Guest Profile Summary for Praia a Mare
- The typical guest profile for Airbnb in Praia a Mare consists of a mix of domestic (53%) and international guests, often arriving from nearby Rome, typically belonging to the Post-2000s (Gen Z/Alpha) group (50%), primarily speaking English or Italian.
- Domestic travelers account for 53.2% of guests.
- Key international markets include Italy (53.2%) and France (16.1%).
- Top languages spoken are English (37.2%) followed by Italian (21.8%).
- A significant demographic segment is the Post-2000s (Gen Z/Alpha) group, representing 50% of guests.
Recommendations for Hosts
- Balance marketing efforts between domestic and international channels based on the guest mix.
- Tailor amenities and listing descriptions to appeal to the dominant Post-2000s (Gen Z/Alpha) demographic (e.g., highlight fast WiFi, smart home features, local guides).
- Highlight unique local experiences or amenities relevant to the primary guest profile.
- Consider seasonal promotions aligned with peak travel times for key origin markets.
Nearby Short-Term Rental Market Comparison
How does the Praia a Mare Airbnb market stack up against its neighbors? Compare key performance metrics like average monthly revenue, ADR, and occupancy rates in surrounding areas to understand the broader regional STR landscape.
| Market | Active Properties | Monthly Revenue | Daily Rate | Avg. Occupancy |
|---|---|---|---|---|
| Positano | 683 | $6,671 | $624.23 | 53% |
| Praiano | 331 | $4,415 | $403.56 | 55% |
| Conca dei Marini | 112 | $4,308 | $395.84 | 53% |
| Capri | 423 | $3,942 | $586.54 | 41% |
| Sorrento | 1,475 | $3,702 | $325.69 | 50% |
| Amalfi | 463 | $3,284 | $317.75 | 48% |
| Massa Lubrense | 832 | $3,255 | $413.33 | 45% |
| Ravello | 261 | $3,201 | $317.16 | 47% |
| Furore | 141 | $3,098 | $340.51 | 51% |
| Atrani | 129 | $2,687 | $212.49 | 54% |