Sorrento Airbnb Market Analysis 2025: Short Term Rental Data & Vacation Rental Statistics in Campania, Italy
Is Airbnb profitable in Sorrento in 2025? Explore comprehensive Airbnb analytics for Sorrento, Campania, Italy to uncover income potential. This 2025 STR market report for Sorrento, based on AirROI data from April 2024 to March 2025, reveals key trends in the bustling market of 1,475 active listings.
Whether you're considering an Airbnb investment in Sorrento, optimizing your existing vacation rental, or exploring rental arbitrage opportunities, understanding the Sorrento Airbnb data is crucial. Navigating the high regulation landscape is key to maximizing your short term rental income potential. Let's dive into the specifics.
Key Sorrento Airbnb Performance Metrics Overview
Monthly Airbnb Revenue Variations & Income Potential in Sorrento (2025)
Understanding the monthly revenue variations for Airbnb listings in Sorrento is key to maximizing your short term rental income potential. Seasonality significantly impacts earnings. Our analysis, based on data from the past 12 months, shows that the peak revenue month for STRs in Sorrento is typically July, while January often presents the lowest earnings, highlighting opportunities for strategic pricing adjustments during shoulder and low seasons. Explore the typical Airbnb income in Sorrento across different performance tiers:
- Best-in-class properties (Top 10%) achieve $9,129+ monthly, often utilizing dynamic pricing and superior guest experiences.
- Strong performing properties (Top 25%) earn $6,027 or more, indicating effective management and desirable locations/amenities.
- Typical properties (Median) generate around $3,772 per month, representing the average market performance.
- Entry-level properties (Bottom 25%) see earnings around $2,138, often with potential for optimization.
Average Monthly Airbnb Earnings Trend in Sorrento
Sorrento Airbnb Occupancy Rate Trends (2025)
Maximize your bookings by understanding the Sorrento STR occupancy trends. Seasonal demand shifts significantly influence how often properties are booked. Typically, Septembersees the highest demand (peak season occupancy), while December experiences the lowest (low season). Effective strategies, like adjusting minimum stays or offering promotions, can boost occupancy during slower periods. Here's how different property tiers perform in Sorrento:
- Best-in-class properties (Top 10%) achieve 82%+ occupancy, indicating high desirability and potentially optimized availability.
- Strong performing properties (Top 25%) maintain 67% or higher occupancy, suggesting good market fit and guest satisfaction.
- Typical properties (Median) have an occupancy rate around 50%.
- Entry-level properties (Bottom 25%) average 24% occupancy, potentially facing higher vacancy.
Average Monthly Occupancy Rate Trend in Sorrento
Average Daily Rate (ADR) Airbnb Trends in Sorrento (2025)
Effective short term rental pricing strategy in Sorrento involves understanding monthly ADR fluctuations. The Average Daily Rate (ADR) for Airbnb in Sorrento typically peaks in July and dips lowest during February. Leveraging Airbnb dynamic pricing tools or strategies based on this seasonality can significantly boost revenue. Here's a look at the typical nightly rates achieved:
- Best-in-class properties (Top 10%) command rates of $569+ per night, often due to premium features or locations.
- Strong performing properties (Top 25%) achieve nightly rates of $357 or more.
- Typical properties (Median) charge around $244 per night.
- Entry-level properties (Bottom 25%) earn around $170 per night.
Average Daily Rate (ADR) Trend by Month in Sorrento
Get Live Sorrento Market Intelligence 👇

Explore Real-time Analytics
Airbnb Seasonality Analysis & Trends in Sorrento (2025)
Peak Season (July, September, June)
- Revenue averages $7,382 per month
- Occupancy rates average 63.3%
- Daily rates average $402
Shoulder Season
- Revenue averages $4,825 per month
- Occupancy maintains around 47.6%
- Daily rates hold near $347
Low Season (January, February, March)
- Revenue drops to average $2,039 per month
- Occupancy decreases to average 30.4%
- Daily rates adjust to average $274
Seasonality Insights for Sorrento
- The Airbnb seasonality in Sorrento shows highly seasonal trends requiring careful strategy. While the sections above show seasonal averages, it's also insightful to look at the extremes:
- During the high season, the absolute peak month showcases Sorrento's highest earning potential, with monthly revenues capable of climbing to $7,419, occupancy reaching a high of 68.8%, and ADRs peaking at $408.
- Conversely, the slowest single month of the year, typically falling within the low season, marks the market's lowest point. In this month, revenue might dip to $1,912, occupancy could drop to 26.7%, and ADRs may adjust down to $269.
- Understanding both the seasonal averages and these monthly peaks and troughs in revenue, occupancy, and ADR is crucial for maximizing your Airbnb profit potential in Sorrento.
Seasonal Strategies for Maximizing Profit
- Peak Season: Maximize revenue through premium pricing and potentially longer minimum stays. Ensure high availability.
- Low Season: Offer competitive pricing, special promotions (e.g., extended stay discounts), and flexible cancellation policies. Target off-season travelers like remote workers or budget-conscious guests.
- Shoulder Seasons: Implement dynamic pricing that balances peak and low rates. Target weekend travelers or specific events. Offer slightly more flexible terms than peak season.
- Regularly analyze your own performance against these Sorrento seasonality benchmarks and adjust your pricing and availability strategy accordingly.
Best Areas for Airbnb Investment in Sorrento (2025)
Exploring the top neighborhoods for short-term rentals in Sorrento? This section highlights key areas, outlining why they are attractive for hosts and guests, along with notable local attractions. Consider these locations based on your target guest profile and investment strategy.
| Neighborhood / Area | Why Host Here? (Target Guests & Appeal) | Key Attractions & Landmarks |
|---|---|---|
| Marina Piccola | A picturesque spot with stunning views of the Bay of Naples, popular with tourists looking for seaside access and beautiful sunsets. | Marina Piccola Beach, Punta del Capo, Villa Comunale, Via Capo, Bagni della Regina Giovanna |
| Corso Italia | The main street of Sorrento filled with shops, cafes, and restaurants. A vibrant area bustling with visitors seeking local culture and cuisine. | Shops and boutiques, Piazza Tasso, Cafes and Gelaterias, Church of Sant'Antonino, Sorrento Foundation |
| Sorrento Historic Center | Rich in history and charm, this area offers narrow streets and historical sites, making it appealing to tourists who enjoy exploring culture. | Sedile Dominova, Basilica di Sant'Antonio, Piazza Tasso, Museo Correale di Terranova, Sedile Dominova |
| Punta Campanella | A natural reserve offering breathtaking views and hiking opportunities, attracting nature lovers and adventure seekers. | Sentiero degli Dei Trail, Marine Protected Area, Camping Dal Pino, Punta Campanella Lighthouse, Secret Beach |
| Vico Equense | A quaint village nearby with stunning coastal views and access to beautiful beaches. It offers a more laid-back atmosphere compared to Sorrento. | Marina di Vico, Church of Santa Maria del Pozzo, Antico Bagno Stabilimento Balneare, Punta Scutolo, La Tradizione |
| Meta di Sorrento | A serene area closer to the coast, offering family-friendly beaches and a relaxed environment for tourists looking to unwind. | Meta Beach, Grand Hotel Parco del Sole, Viale degli Aranci, Pine Forest of Meta, Chiesa di Santa Maria del Lauro |
| Sorrento Cliffs | Known for its stunning cliffside views and luxury accommodations, it's perfect for visitors seeking unforgettable scenery and romantic settings. | Cliffside Restaurants, Viewpoints, Hiking trails, Scenic overlooks, Luxury resorts |
| Bagni della Regina Giovanna | A natural pool and beach area renowned for its crystal-clear waters and beautiful surroundings, great for those looking for a unique beach experience. | Natural Pool, Cliffside Views, Swimming, Scenic Hikes, Relaxation Spots |
Understanding Airbnb License Requirements & STR Laws in Sorrento (2025)
Yes, Sorrento, Campania, Italy enforces high STR regulations. Obtaining a license and ensuring compliance is almost certainly required according to current 2025 STR laws. Always verify the latest short term rental regulations and Airbnb license requirements directly with local government authorities for Sorrento to ensure full compliance before hosting.
(Source: AirROI data, 2025, based on 75% licensed listings)
Top Performing Airbnb Properties in Sorrento (2025)
Benchmark your potential! Explore examples of top-performing Airbnb properties in Sorrentobased on Trailing Twelve Month (TTM) revenue. Analyze their characteristics, revenue, occupancy rate, and ADR to understand what drives success in this market.
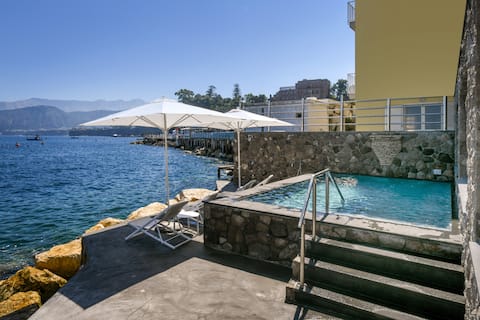
Villa on the Sea with Hut Tub
Entire Place • 4 bedrooms
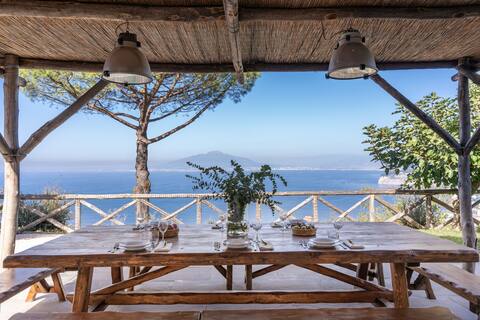
Villa Giulia: Boutique Villa, Views, Pool & Concie
Entire Place • 6 bedrooms
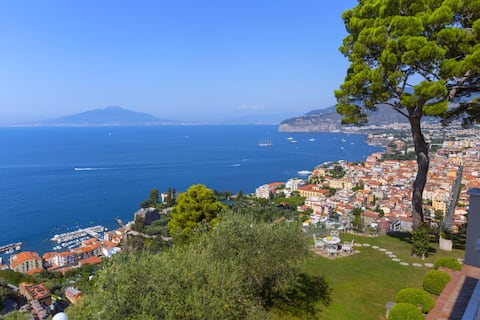
Amore Rentals -Villa Giada with Swimming Pool, Gar
Entire Place • 5 bedrooms
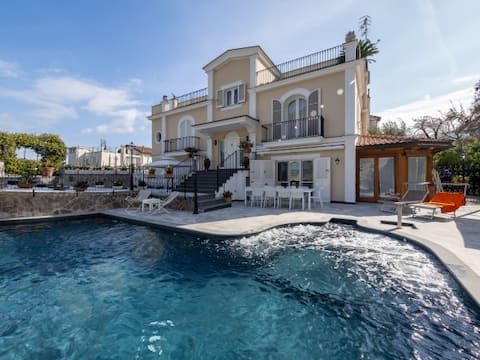
Villa Ares, pool,few minutes from Sorrento center!
Entire Place • 6 bedrooms
Villa with amazing infinity pool
Entire Place • 6 bedrooms
Casa Angelica Luxury Villa with pool
Entire Place • 5 bedrooms
Note: Performance varies based on location, size, amenities, seasonality, and management quality. Data reflects the past 12 months.
Top Performing Airbnb Hosts in Sorrento (2025)
Learn from the best! This table showcases top-performing Airbnb hosts in Sorrento based on the number of properties managed and estimated total revenue over the past year. Analyze their scale and performance metrics.
| Host Name | Properties | Grossing Revenue | Stay Reviews | Avg Rating |
|---|---|---|---|---|
| Amore Rentals | 33 | $2,949,039 | 771 | 4.09/5.0 |
| Giuseppe | 34 | $2,851,745 | 2108 | 4.55/5.0 |
| Daniela Elena | 25 | $1,945,415 | 265 | 3.34/5.0 |
| Raffaele | 22 | $1,628,159 | 1079 | 4.80/5.0 |
| Francesco | 32 | $1,589,322 | 1661 | 4.78/5.0 |
| Estate | 17 | $1,131,044 | 953 | 4.44/5.0 |
| The Gocce Team | 22 | $1,031,283 | 697 | 4.62/5.0 |
| Giuseppe | 8 | $860,665 | 810 | 4.78/5.0 |
| Sorrento | 22 | $806,315 | 472 | 4.38/5.0 |
| The Feeling Italy Team | 4 | $780,151 | 147 | 4.83/5.0 |
Analyzing the strategies of top hosts, such as their property selection, pricing, and guest communication, can offer valuable lessons for optimizing your own Airbnb operations in Sorrento.
Dive Deeper: Advanced Sorrento STR Market Data (2025)
Ready to unlock more insights? AirROI provides access to advanced metrics and comprehensive Airbnb data for Sorrento. Explore detailed analytics beyond this report to refine your investment strategy, optimize pricing, and maximize your vacation rental profits.
Explore Advanced MetricsSorrento Short-Term Rental Market Composition (2025): Property & Room Types
Room Type Distribution
Property Type Distribution
Market Composition Insights for Sorrento
- The Sorrento Airbnb market composition is heavily skewed towards Entire Home/Apt listings, which make up 69.6% of the 1,475 active rentals. This indicates strong guest preference for privacy and space.
- However, a notable 27.7% share for Private Rooms suggests opportunities for budget-conscious travelers or hosts renting out spare rooms.
- Looking at the property type distribution in Sorrento, Apartment/Condo properties are the most common (56.8%), reflecting the local real estate landscape.
- Houses represent a significant 22.1% portion, catering likely to families or larger groups.
- The presence of 20.1% Hotel/Boutique listings indicates integration with traditional hospitality.
- Smaller segments like others, outdoor/unique, unique stays (combined 0.9%) offer potential for unique stay experiences.
Sorrento Airbnb Room Capacity Analysis (2025): Bedroom Distribution
Distribution of Listings by Number of Bedrooms
Room Capacity Insights for Sorrento
- The dominant room capacity in Sorrento is 1 bedroom listings, making up 43.9% of the market. This suggests a strong demand for properties suitable for couples or solo travelers.
- Together, 1 bedroom and 2 bedrooms properties represent 72.4% of the active Airbnb listings in Sorrento, indicating a high concentration in these sizes.
Sorrento Vacation Rental Guest Capacity Trends (2025)
Distribution of Listings by Guest Capacity
Guest Capacity Insights for Sorrento
- The most common guest capacity trend in Sorrento vacation rentals is listings accommodating 4 guests (26.2%). This suggests the primary traveler segment is likely small families or groups.
- Properties designed for 4 guests and 2 guests dominate the Sorrento STR market, accounting for 43.3% of listings.
- 22.6% of properties accommodate 6+ guests, serving the market segment for larger families or group travel in Sorrento.
- On average, properties in Sorrento are equipped to host 3.8 guests.
Sorrento Airbnb Booking Patterns (2025): Available vs. Booked Days
Available Days Distribution
Booked Days Distribution
Booking Pattern Insights for Sorrento
- The most common availability pattern in Sorrento falls within the 181-270 days range, representing 33.7% of listings. This suggests many properties have significant open periods on their calendars.
- Approximately 65.7% of listings show high availability (181+ days open annually), indicating potential for increased bookings or specific owner usage patterns.
- For booked days, the 91-180 days range is most frequent in Sorrento (33.4%), reflecting common guest stay durations or potential owner blocking patterns.
- A notable 35.8% of properties secure long booking periods (181+ days booked per year), highlighting successful long-term rental strategies or significant owner usage.
Sorrento Airbnb Minimum Stay Requirements Analysis
Distribution of Listings by Minimum Night Requirement
1 Night
248 listings
17.5% of total
2 Nights
319 listings
22.5% of total
3 Nights
432 listings
30.5% of total
4-6 Nights
47 listings
3.3% of total
7-29 Nights
69 listings
4.9% of total
30+ Nights
300 listings
21.2% of total
Key Insights
- The most prevalent minimum stay requirement in Sorrento is 3 Nights, adopted by 30.5% of listings. This highlights the market's preference for longer commitments.
- A significant segment (21.2%) caters to monthly stays (30+ nights) in Sorrento, pointing to opportunities in the extended-stay market.
Recommendations
- Align with the market by considering a 3 Nights minimum stay, as 30.5% of Sorrento hosts use this setting.
- If feasible, allowing 1-night stays, especially midweek or during low season, could capture last-minute bookings, as only 17.5% currently do.
- Explore offering discounts for stays of 30+ nights to attract the 21.2% of the market seeking extended stays.
- Adjust minimum nights based on seasonality – potentially shorter during low season and longer during peak demand periods in Sorrento.
Sorrento Airbnb Cancellation Policy Trends Analysis (2025)
Super Strict 95 Days
1 listings
0.1% of total
Super Strict 30 Days
130 listings
10% of total
Super Strict 60 Days
58 listings
4.5% of total
Flexible
203 listings
15.7% of total
Moderate
630 listings
48.6% of total
Strict
273 listings
21.1% of total
Cancellation Policy Insights for Sorrento
- The prevailing Airbnb cancellation policy trend in Sorrento is Moderate, used by 48.6% of listings.
- There's a relatively balanced mix between guest-friendly (64.3%) and stricter (21.1%) policies, offering choices for different guest needs.
Recommendations for Hosts
- Consider adopting a Moderate policy to align with the 48.6% market standard in Sorrento.
- Regularly review your cancellation policy against competitors and market demand shifts in Sorrento.
Sorrento STR Booking Lead Time Analysis (2025)
Average Booking Lead Time by Month
Booking Lead Time Insights for Sorrento
- The overall average booking lead time for vacation rentals in Sorrento is 72 days.
- Guests book furthest in advance for stays during May (average 115 days), likely coinciding with peak travel demand or local events.
- The shortest booking windows occur for stays in December (average 48 days), indicating more last-minute travel plans during this time.
- Seasonally, Summer (98 days avg.) sees the longest lead times, while Winter (54 days avg.) has the shortest, reflecting typical travel planning cycles.
Recommendations for Hosts
- Use the overall average lead time (72 days) as a baseline for your pricing and availability strategy in Sorrento.
- For May stays, consider implementing length-of-stay discounts or slightly higher rates for bookings made less than 115 days out to capitalize on advance planning.
- Target marketing efforts for the Summer season well in advance (at least 98 days) to capture early planners.
- Monitor your own booking lead times against these Sorrento averages to identify opportunities for dynamic pricing adjustments.
Popular & Essential Airbnb Amenities in Sorrento (2025)
Amenity Prevalence
Amenity Insights for Sorrento
- Essential amenities in Sorrento that guests expect include: Wifi, Air conditioning, TV. Lacking these (any) could significantly impact bookings.
- Popular amenities like Essentials, Hair dryer, Heating are common but not universal. Offering these can provide a competitive edge.
Recommendations for Hosts
- Ensure your listing includes all essential amenities for Sorrento: Wifi, Air conditioning, TV.
- Prioritize adding missing essentials: Wifi, Air conditioning, TV.
- Consider adding popular differentiators like Essentials or Hair dryer to increase appeal.
- Highlight unique or less common amenities you offer (e.g., hot tub, dedicated workspace, EV charger) in your listing description and photos.
- Regularly check competitor amenities in Sorrento to stay competitive.
Sorrento Airbnb Guest Demographics & Profile Analysis (2025)
Guest Profile Summary for Sorrento
- The typical guest profile for Airbnb in Sorrento consists of predominantly international visitors (99%), with top international origins including United Kingdom, typically belonging to the Post-2000s (Gen Z/Alpha) group (50%), primarily speaking English or Spanish.
- Domestic travelers account for 1.2% of guests.
- Key international markets include United States (46.4%) and United Kingdom (13.4%).
- Top languages spoken are English (60.8%) followed by Spanish (13%).
- A significant demographic segment is the Post-2000s (Gen Z/Alpha) group, representing 50% of guests.
Recommendations for Hosts
- Focus marketing internationally, particularly towards travelers from United Kingdom.
- Tailor amenities and listing descriptions to appeal to the dominant Post-2000s (Gen Z/Alpha) demographic (e.g., highlight fast WiFi, smart home features, local guides).
- Highlight unique local experiences or amenities relevant to the primary guest profile.
- Consider seasonal promotions aligned with peak travel times for key origin markets.
Nearby Short-Term Rental Market Comparison
How does the Sorrento Airbnb market stack up against its neighbors? Compare key performance metrics like average monthly revenue, ADR, and occupancy rates in surrounding areas to understand the broader regional STR landscape.
| Market | Active Properties | Monthly Revenue | Daily Rate | Avg. Occupancy |
|---|---|---|---|---|
| Positano | 683 | $6,671 | $624.23 | 53% |
| Praiano | 331 | $4,415 | $403.56 | 55% |
| Conca dei Marini | 112 | $4,308 | $395.84 | 53% |
| Capri | 423 | $3,942 | $586.54 | 41% |
| Amalfi | 463 | $3,284 | $317.75 | 48% |
| Massa Lubrense | 832 | $3,255 | $413.33 | 45% |
| Ravello | 261 | $3,201 | $317.16 | 47% |
| Furore | 141 | $3,098 | $340.51 | 51% |
| Atrani | 129 | $2,687 | $212.49 | 54% |
| Sant'Agnello | 282 | $2,509 | $306.70 | 47% |