Forio Airbnb Market Analysis 2025: Short Term Rental Data & Vacation Rental Statistics in Campania, Italy
Is Airbnb profitable in Forio in 2025? Explore comprehensive Airbnb analytics for Forio, Campania, Italy to uncover income potential. This 2025 STR market report for Forio, based on AirROI data from April 2024 to March 2025, reveals key trends in the market of 599 active listings.
Whether you're considering an Airbnb investment in Forio, optimizing your existing vacation rental, or exploring rental arbitrage opportunities, understanding the Forio Airbnb data is crucial. Navigating the high regulation landscape is key to maximizing your short term rental income potential. Let's dive into the specifics.
Key Forio Airbnb Performance Metrics Overview
Monthly Airbnb Revenue Variations & Income Potential in Forio (2025)
Understanding the monthly revenue variations for Airbnb listings in Forio is key to maximizing your short term rental income potential. Seasonality significantly impacts earnings. Our analysis, based on data from the past 12 months, shows that the peak revenue month for STRs in Forio is typically August, while January often presents the lowest earnings, highlighting opportunities for strategic pricing adjustments during shoulder and low seasons. Explore the typical Airbnb income in Forio across different performance tiers:
- Best-in-class properties (Top 10%) achieve $4,019+ monthly, often utilizing dynamic pricing and superior guest experiences.
- Strong performing properties (Top 25%) earn $2,133 or more, indicating effective management and desirable locations/amenities.
- Typical properties (Median) generate around $1,144 per month, representing the average market performance.
- Entry-level properties (Bottom 25%) see earnings around $549, often with potential for optimization.
Average Monthly Airbnb Earnings Trend in Forio
Forio Airbnb Occupancy Rate Trends (2025)
Maximize your bookings by understanding the Forio STR occupancy trends. Seasonal demand shifts significantly influence how often properties are booked. Typically, Augustsees the highest demand (peak season occupancy), while January experiences the lowest (low season). Effective strategies, like adjusting minimum stays or offering promotions, can boost occupancy during slower periods. Here's how different property tiers perform in Forio:
- Best-in-class properties (Top 10%) achieve 68%+ occupancy, indicating high desirability and potentially optimized availability.
- Strong performing properties (Top 25%) maintain 51% or higher occupancy, suggesting good market fit and guest satisfaction.
- Typical properties (Median) have an occupancy rate around 32%.
- Entry-level properties (Bottom 25%) average 13% occupancy, potentially facing higher vacancy.
Average Monthly Occupancy Rate Trend in Forio
Average Daily Rate (ADR) Airbnb Trends in Forio (2025)
Effective short term rental pricing strategy in Forio involves understanding monthly ADR fluctuations. The Average Daily Rate (ADR) for Airbnb in Forio typically peaks in August and dips lowest during November. Leveraging Airbnb dynamic pricing tools or strategies based on this seasonality can significantly boost revenue. Here's a look at the typical nightly rates achieved:
- Best-in-class properties (Top 10%) command rates of $316+ per night, often due to premium features or locations.
- Strong performing properties (Top 25%) achieve nightly rates of $176 or more.
- Typical properties (Median) charge around $111 per night.
- Entry-level properties (Bottom 25%) earn around $79 per night.
Average Daily Rate (ADR) Trend by Month in Forio
Get Live Forio Market Intelligence 👇

Explore Real-time Analytics
Airbnb Seasonality Analysis & Trends in Forio (2025)
Peak Season (August, July, June)
- Revenue averages $3,082 per month
- Occupancy rates average 50.4%
- Daily rates average $189
Shoulder Season
- Revenue averages $1,896 per month
- Occupancy maintains around 34.2%
- Daily rates hold near $166
Low Season (January, February, December)
- Revenue drops to average $607 per month
- Occupancy decreases to average 18.8%
- Daily rates adjust to average $157
Seasonality Insights for Forio
- The Airbnb seasonality in Forio shows highly seasonal trends requiring careful strategy. While the sections above show seasonal averages, it's also insightful to look at the extremes:
- During the high season, the absolute peak month showcases Forio's highest earning potential, with monthly revenues capable of climbing to $3,566, occupancy reaching a high of 58.6%, and ADRs peaking at $196.
- Conversely, the slowest single month of the year, typically falling within the low season, marks the market's lowest point. In this month, revenue might dip to $519, occupancy could drop to 15.1%, and ADRs may adjust down to $148.
- Understanding both the seasonal averages and these monthly peaks and troughs in revenue, occupancy, and ADR is crucial for maximizing your Airbnb profit potential in Forio.
Seasonal Strategies for Maximizing Profit
- Peak Season: Maximize revenue through premium pricing and potentially longer minimum stays. Ensure high availability.
- Low Season: Offer competitive pricing, special promotions (e.g., extended stay discounts), and flexible cancellation policies. Target off-season travelers like remote workers or budget-conscious guests.
- Shoulder Seasons: Implement dynamic pricing that balances peak and low rates. Target weekend travelers or specific events. Offer slightly more flexible terms than peak season.
- Regularly analyze your own performance against these Forio seasonality benchmarks and adjust your pricing and availability strategy accordingly.
Best Areas for Airbnb Investment in Forio (2025)
Exploring the top neighborhoods for short-term rentals in Forio? This section highlights key areas, outlining why they are attractive for hosts and guests, along with notable local attractions. Consider these locations based on your target guest profile and investment strategy.
| Neighborhood / Area | Why Host Here? (Target Guests & Appeal) | Key Attractions & Landmarks |
|---|---|---|
| Sant'Angelo | Charming fishing village known for its thermal springs and picturesque views. Attracts tourists seeking relaxation and a quaint local experience. | Thermal Springs, Sant'Angelo Beach, Maronti Beach, Mount Epomeo, La Mortella Gardens |
| Forio's Historic Center | Cultural heart of Forio, with historic churches and local shops. Ideal for visitors wanting to immerse themselves in local culture and history. | Church of Soccorso, Forio Cathedral, Local Artisans, Piazza Maio |
| Chiaia | Beautiful coastal area with stunning views and a mix of luxury and local charm. Great for those wanting a scenic and upscale experience. | Chiaia Beach, San Francesco Beach, Baia di Sorgeto, Cafes and Restaurants on the waterfront |
| Citara | Famous for its beautiful beaches and thermal parks. Popular with tourists looking for sun, sea, and wellness treatments. | Poseidon Thermal Gardens, Citara Beach, Cava Grado Beach, Saint Nicholas Church |
| Zaro | Quiet residential area just outside the main town, perfect for families and those looking for peace. | Scenic Trekking Trails, Local Vineyards, Panoramic Views of the Island |
| Panza | Known for its unique rock formations and stunning coastal views, Panza is perfect for adventure-seekers. | La Scala dei Turchi, Panza Beach, Hiking Trails |
| Lacco Ameno | Home to beautiful gardens and the famous fumaroles, attractive for tourists seeking natural beauty and tranquility. | Fumarole Beach, 所の庭園, Museum of Aenaria |
| Procida Day Trips | Forio is a perfect base for day trips to the nearby island of Procida, which is known for its colorful houses and charming streets. | Procida Island, Corricella Village, Chiesa di San Michele |
Understanding Airbnb License Requirements & STR Laws in Forio (2025)
Yes, Forio, Campania, Italy enforces high STR regulations. Obtaining a license and ensuring compliance is almost certainly required according to current 2025 STR laws. Always verify the latest short term rental regulations and Airbnb license requirements directly with local government authorities for Forio to ensure full compliance before hosting.
(Source: AirROI data, 2025, based on 48% licensed listings)
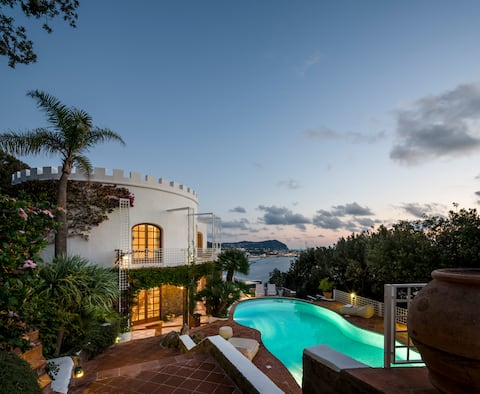
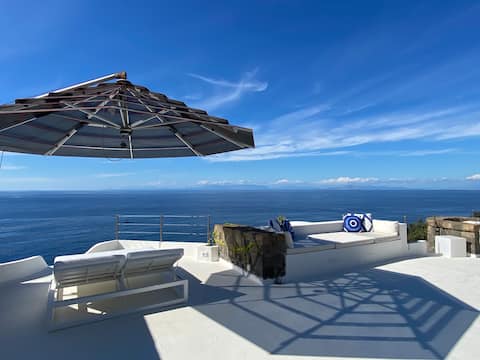
Top Performing Airbnb Properties in Forio (2025)
Benchmark your potential! Explore examples of top-performing Airbnb properties in Foriobased on Trailing Twelve Month (TTM) revenue. Analyze their characteristics, revenue, occupancy rate, and ADR to understand what drives success in this market.

OraBlu Executive Villa infinity pool on the Ocean
Entire Place • 1 bedroom
Torre dell'Aquila, Luxury Villa, Concierge Service
Entire Place • 4 bedrooms
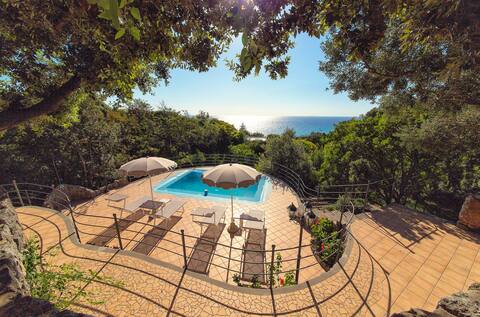
Villa dei lecci - Luxury villa with PRIVATE POOL
Entire Place • 3 bedrooms

Villa CasaBianca
Entire Place • 3 bedrooms
Villa Elena Ischia it - Pool and sea descent
Entire Place • 4 bedrooms

Villa dei lecci - Private infinity pool villa
Entire Place • 2 bedrooms
Note: Performance varies based on location, size, amenities, seasonality, and management quality. Data reflects the past 12 months.
Top Performing Airbnb Hosts in Forio (2025)
Learn from the best! This table showcases top-performing Airbnb hosts in Forio based on the number of properties managed and estimated total revenue over the past year. Analyze their scale and performance metrics.
| Host Name | Properties | Grossing Revenue | Stay Reviews | Avg Rating |
|---|---|---|---|---|
| Chiara | 7 | $593,378 | 243 | 4.98/5.0 |
| Francesco | 8 | $390,439 | 205 | 4.22/5.0 |
| Lukas | 12 | $339,705 | 79 | 3.63/5.0 |
| Giuseppe | 8 | $201,939 | 326 | 4.74/5.0 |
| Paco | 25 | $199,845 | 954 | 4.39/5.0 |
| Giancarlo | 12 | $194,956 | 412 | 4.99/5.0 |
| Salvatore | 5 | $176,336 | 49 | 4.99/5.0 |
| Parco Del Generale | 3 | $157,501 | 73 | 4.89/5.0 |
| Maria | 5 | $142,508 | 54 | 4.78/5.0 |
| Felice | 19 | $141,538 | 18 | 0.47/5.0 |
Analyzing the strategies of top hosts, such as their property selection, pricing, and guest communication, can offer valuable lessons for optimizing your own Airbnb operations in Forio.
Dive Deeper: Advanced Forio STR Market Data (2025)
Ready to unlock more insights? AirROI provides access to advanced metrics and comprehensive Airbnb data for Forio. Explore detailed analytics beyond this report to refine your investment strategy, optimize pricing, and maximize your vacation rental profits.
Explore Advanced MetricsForio Short-Term Rental Market Composition (2025): Property & Room Types
Room Type Distribution
Property Type Distribution
Market Composition Insights for Forio
- The Forio Airbnb market composition is heavily skewed towards Entire Home/Apt listings, which make up 81.1% of the 599 active rentals. This indicates strong guest preference for privacy and space.
- Looking at the property type distribution in Forio, Apartment/Condo properties are the most common (51.9%), reflecting the local real estate landscape.
- Houses represent a significant 32.6% portion, catering likely to families or larger groups.
- The presence of 12.5% Hotel/Boutique listings indicates integration with traditional hospitality.
- Smaller segments like others, outdoor/unique, unique stays (combined 3.0%) offer potential for unique stay experiences.
Forio Airbnb Room Capacity Analysis (2025): Bedroom Distribution
Distribution of Listings by Number of Bedrooms
Room Capacity Insights for Forio
- The dominant room capacity in Forio is 1 bedroom listings, making up 55.1% of the market. This suggests a strong demand for properties suitable for couples or solo travelers.
- Together, 1 bedroom and 2 bedrooms properties represent 78.8% of the active Airbnb listings in Forio, indicating a high concentration in these sizes.
- With over half the market (55.1%) consisting of studios or 1-bedroom units, Forio is particularly well-suited for individuals or couples.
Forio Vacation Rental Guest Capacity Trends (2025)
Distribution of Listings by Guest Capacity
Guest Capacity Insights for Forio
- The most common guest capacity trend in Forio vacation rentals is listings accommodating 2 guests (29.5%). This suggests the primary traveler segment is likely couples or solo travelers.
- Properties designed for 2 guests and 4 guests dominate the Forio STR market, accounting for 54.7% of listings.
- 18.2% of properties accommodate 6+ guests, serving the market segment for larger families or group travel in Forio.
- On average, properties in Forio are equipped to host 3.6 guests.
Forio Airbnb Booking Patterns (2025): Available vs. Booked Days
Available Days Distribution
Booked Days Distribution
Booking Pattern Insights for Forio
- The most common availability pattern in Forio falls within the 271-366 days range, representing 62.4% of listings. This suggests many properties have significant open periods on their calendars.
- Approximately 93.3% of listings show high availability (181+ days open annually), indicating potential for increased bookings or specific owner usage patterns.
- For booked days, the 31-90 days range is most frequent in Forio (32.9%), reflecting common guest stay durations or potential owner blocking patterns.
- A notable 7.8% of properties secure long booking periods (181+ days booked per year), highlighting successful long-term rental strategies or significant owner usage.
Forio Airbnb Minimum Stay Requirements Analysis
Distribution of Listings by Minimum Night Requirement
1 Night
89 listings
15.7% of total
2 Nights
143 listings
25.2% of total
3 Nights
95 listings
16.8% of total
4-6 Nights
79 listings
13.9% of total
7-29 Nights
90 listings
15.9% of total
30+ Nights
71 listings
12.5% of total
Key Insights
- The most prevalent minimum stay requirement in Forio is 2 Nights, adopted by 25.2% of listings. This highlights the market's preference for shorter, flexible bookings.
- A significant segment (12.5%) caters to monthly stays (30+ nights) in Forio, pointing to opportunities in the extended-stay market.
Recommendations
- Align with the market by considering a 2 Nights minimum stay, as 25.2% of Forio hosts use this setting.
- If feasible, allowing 1-night stays, especially midweek or during low season, could capture last-minute bookings, as only 15.7% currently do.
- Explore offering discounts for stays of 30+ nights to attract the 12.5% of the market seeking extended stays.
- Adjust minimum nights based on seasonality – potentially shorter during low season and longer during peak demand periods in Forio.
Forio Airbnb Cancellation Policy Trends Analysis (2025)
Super Strict 30 Days
12 listings
2.6% of total
Super Strict 60 Days
6 listings
1.3% of total
Flexible
88 listings
18.8% of total
Moderate
226 listings
48.4% of total
Strict
135 listings
28.9% of total
Cancellation Policy Insights for Forio
- The prevailing Airbnb cancellation policy trend in Forio is Moderate, used by 48.4% of listings.
- There's a relatively balanced mix between guest-friendly (67.2%) and stricter (28.9%) policies, offering choices for different guest needs.
Recommendations for Hosts
- Consider adopting a Moderate policy to align with the 48.4% market standard in Forio.
- Regularly review your cancellation policy against competitors and market demand shifts in Forio.
Forio STR Booking Lead Time Analysis (2025)
Average Booking Lead Time by Month
Booking Lead Time Insights for Forio
- The overall average booking lead time for vacation rentals in Forio is 57 days.
- Guests book furthest in advance for stays during July (average 77 days), likely coinciding with peak travel demand or local events.
- The shortest booking windows occur for stays in March (average 37 days), indicating more last-minute travel plans during this time.
- Seasonally, Summer (76 days avg.) sees the longest lead times, while Winter (41 days avg.) has the shortest, reflecting typical travel planning cycles.
Recommendations for Hosts
- Use the overall average lead time (57 days) as a baseline for your pricing and availability strategy in Forio.
- For July stays, consider implementing length-of-stay discounts or slightly higher rates for bookings made less than 77 days out to capitalize on advance planning.
- Target marketing efforts for the Summer season well in advance (at least 76 days) to capture early planners.
- Monitor your own booking lead times against these Forio averages to identify opportunities for dynamic pricing adjustments.
Popular & Essential Airbnb Amenities in Forio (2025)
Amenity Prevalence
Amenity Insights for Forio
- Popular amenities like Wifi, Essentials, Hot water are common but not universal. Offering these can provide a competitive edge.
- Warning: Wifi is not universally provided but is considered essential globally. Ensure reliable Wifi is offered.
Recommendations for Hosts
- Consider adding popular differentiators like Wifi or Essentials to increase appeal.
- Highlight unique or less common amenities you offer (e.g., hot tub, dedicated workspace, EV charger) in your listing description and photos.
- Regularly check competitor amenities in Forio to stay competitive.
Forio Airbnb Guest Demographics & Profile Analysis (2025)
Guest Profile Summary for Forio
- The typical guest profile for Airbnb in Forio consists of predominantly international visitors (82%), with top international origins including United States, typically belonging to the Post-2000s (Gen Z/Alpha) group (50%), primarily speaking English or Italian.
- Domestic travelers account for 17.8% of guests.
- Key international markets include Italy (17.8%) and United States (16.1%).
- Top languages spoken are English (42.2%) followed by Italian (13.1%).
- A significant demographic segment is the Post-2000s (Gen Z/Alpha) group, representing 50% of guests.
Recommendations for Hosts
- Focus marketing internationally, particularly towards travelers from United States.
- Tailor amenities and listing descriptions to appeal to the dominant Post-2000s (Gen Z/Alpha) demographic (e.g., highlight fast WiFi, smart home features, local guides).
- Highlight unique local experiences or amenities relevant to the primary guest profile.
- Consider seasonal promotions aligned with peak travel times for key origin markets.
Nearby Short-Term Rental Market Comparison
How does the Forio Airbnb market stack up against its neighbors? Compare key performance metrics like average monthly revenue, ADR, and occupancy rates in surrounding areas to understand the broader regional STR landscape.
| Market | Active Properties | Monthly Revenue | Daily Rate | Avg. Occupancy |
|---|---|---|---|---|
| Positano | 683 | $6,671 | $624.23 | 53% |
| Praiano | 331 | $4,415 | $403.56 | 55% |
| Conca dei Marini | 112 | $4,308 | $395.84 | 53% |
| Capri | 423 | $3,942 | $586.54 | 41% |
| Sorrento | 1,475 | $3,702 | $325.69 | 50% |
| Amalfi | 463 | $3,284 | $317.75 | 48% |
| Massa Lubrense | 832 | $3,255 | $413.33 | 45% |
| Ravello | 261 | $3,201 | $317.16 | 47% |
| Furore | 141 | $3,098 | $340.51 | 51% |
| Rome | 23,290 | $2,898 | $208.87 | 51% |