Castellabate Airbnb Market Analysis 2025: Short Term Rental Data & Vacation Rental Statistics in Campania, Italy
Is Airbnb profitable in Castellabate in 2025? Explore comprehensive Airbnb analytics for Castellabate, Campania, Italy to uncover income potential. This 2025 STR market report for Castellabate, based on AirROI data from April 2024 to March 2025, reveals key trends in the niche market of 108 active listings.
Whether you're considering an Airbnb investment in Castellabate, optimizing your existing vacation rental, or exploring rental arbitrage opportunities, understanding the Castellabate Airbnb data is crucial. Navigating the high regulation landscape is key to maximizing your short term rental income potential. Let's dive into the specifics.
Key Castellabate Airbnb Performance Metrics Overview
Monthly Airbnb Revenue Variations & Income Potential in Castellabate (2025)
Understanding the monthly revenue variations for Airbnb listings in Castellabate is key to maximizing your short term rental income potential. Seasonality significantly impacts earnings. Our analysis, based on data from the past 12 months, shows that the peak revenue month for STRs in Castellabate is typically August, while December often presents the lowest earnings, highlighting opportunities for strategic pricing adjustments during shoulder and low seasons. Explore the typical Airbnb income in Castellabate across different performance tiers:
- Best-in-class properties (Top 10%) achieve $2,904+ monthly, often utilizing dynamic pricing and superior guest experiences.
- Strong performing properties (Top 25%) earn $1,623 or more, indicating effective management and desirable locations/amenities.
- Typical properties (Median) generate around $838 per month, representing the average market performance.
- Entry-level properties (Bottom 25%) see earnings around $386, often with potential for optimization.
Average Monthly Airbnb Earnings Trend in Castellabate
Castellabate Airbnb Occupancy Rate Trends (2025)
Maximize your bookings by understanding the Castellabate STR occupancy trends. Seasonal demand shifts significantly influence how often properties are booked. Typically, Augustsees the highest demand (peak season occupancy), while March experiences the lowest (low season). Effective strategies, like adjusting minimum stays or offering promotions, can boost occupancy during slower periods. Here's how different property tiers perform in Castellabate:
- Best-in-class properties (Top 10%) achieve 57%+ occupancy, indicating high desirability and potentially optimized availability.
- Strong performing properties (Top 25%) maintain 40% or higher occupancy, suggesting good market fit and guest satisfaction.
- Typical properties (Median) have an occupancy rate around 22%.
- Entry-level properties (Bottom 25%) average 10% occupancy, potentially facing higher vacancy.
Average Monthly Occupancy Rate Trend in Castellabate
Average Daily Rate (ADR) Airbnb Trends in Castellabate (2025)
Effective short term rental pricing strategy in Castellabate involves understanding monthly ADR fluctuations. The Average Daily Rate (ADR) for Airbnb in Castellabate typically peaks in January and dips lowest during October. Leveraging Airbnb dynamic pricing tools or strategies based on this seasonality can significantly boost revenue. Here's a look at the typical nightly rates achieved:
- Best-in-class properties (Top 10%) command rates of $286+ per night, often due to premium features or locations.
- Strong performing properties (Top 25%) achieve nightly rates of $160 or more.
- Typical properties (Median) charge around $119 per night.
- Entry-level properties (Bottom 25%) earn around $84 per night.
Average Daily Rate (ADR) Trend by Month in Castellabate
Get Live Castellabate Market Intelligence 👇

Explore Real-time Analytics
Airbnb Seasonality Analysis & Trends in Castellabate (2025)
Peak Season (August, July, September)
- Revenue averages $2,372 per month
- Occupancy rates average 45.3%
- Daily rates average $173
Shoulder Season
- Revenue averages $1,207 per month
- Occupancy maintains around 21.9%
- Daily rates hold near $177
Low Season (March, November, December)
- Revenue drops to average $652 per month
- Occupancy decreases to average 17.8%
- Daily rates adjust to average $187
Seasonality Insights for Castellabate
- The Airbnb seasonality in Castellabate shows highly seasonal trends requiring careful strategy. While the sections above show seasonal averages, it's also insightful to look at the extremes:
- During the high season, the absolute peak month showcases Castellabate's highest earning potential, with monthly revenues capable of climbing to $3,013, occupancy reaching a high of 56.2%, and ADRs peaking at $193.
- Conversely, the slowest single month of the year, typically falling within the low season, marks the market's lowest point. In this month, revenue might dip to $510, occupancy could drop to 10.9%, and ADRs may adjust down to $165.
- Understanding both the seasonal averages and these monthly peaks and troughs in revenue, occupancy, and ADR is crucial for maximizing your Airbnb profit potential in Castellabate.
Seasonal Strategies for Maximizing Profit
- Peak Season: Maximize revenue through premium pricing and potentially longer minimum stays. Ensure high availability.
- Low Season: Offer competitive pricing, special promotions (e.g., extended stay discounts), and flexible cancellation policies. Target off-season travelers like remote workers or budget-conscious guests.
- Shoulder Seasons: Implement dynamic pricing that balances peak and low rates. Target weekend travelers or specific events. Offer slightly more flexible terms than peak season.
- Regularly analyze your own performance against these Castellabate seasonality benchmarks and adjust your pricing and availability strategy accordingly.
Best Areas for Airbnb Investment in Castellabate (2025)
Exploring the top neighborhoods for short-term rentals in Castellabate? This section highlights key areas, outlining why they are attractive for hosts and guests, along with notable local attractions. Consider these locations based on your target guest profile and investment strategy.
| Neighborhood / Area | Why Host Here? (Target Guests & Appeal) | Key Attractions & Landmarks |
|---|---|---|
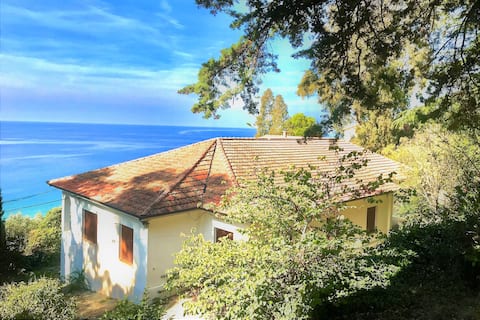
| Santa Maria di Castellabate | The main tourist town in Castellabate, known for its beautiful beaches and vibrant atmosphere. Ideal for visitors looking for sea and relaxation with easy access to restaurants and shops. | Santa Maria Beach, Castellabate Castle, Punta Licosa Nature Reserve, Via delle Stelle, Local seafood restaurants |
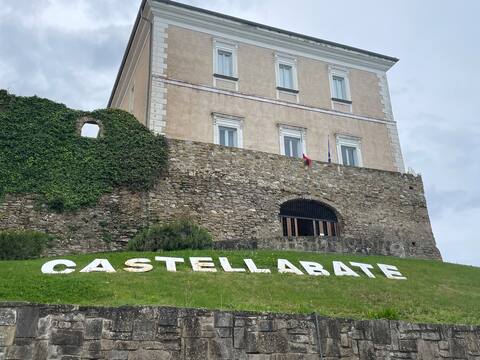
| Castellabate Village | A charming medieval hilltop village with stunning views of the coast, perfect for tourists interested in history and picturesque landscapes. Offers a more authentic Italian experience. | Castellabate Castle, Church of Santa Maria a Mare, Historical center, Local artisan shops, Scenic viewpoints |
| San Marco di Castellabate | A quieter seaside area ideal for families and those looking for peaceful beach time. Features beautiful beaches and a laid-back atmosphere for a relaxing vacation. | San Marco Beach, Punta Tresino, Local beach clubs, Nature trails, Seaside promenades |
| Alano Beach | A hidden gem known for its clear waters and tranquility. This area attracts locals and tourists seeking a less crowded beach experience away from the main tourist spots. | Alano Beach, Natural swimming pools, Scenic walking paths, Nearby hiking trails, Wildlife observation |
| Licosa | A part of the Cilento National Park, known for its natural beauty and historical significance. Great for outdoor enthusiasts and nature lovers looking for hiking and exploration. | Licosa Island, Nature trails, Camping sites, Historical ruins, Scenic coastal views |
| Ogliastro Marina | A small fishing village with authentic Italian charm and cozy beaches. Attracts visitors looking for a quiet escape with local cultural experiences. | Ogliastro Marina Beach, Fishing tours, Local trattorias, Cultural events, Scenic boat rides |
| San Marco | Known for its local cuisine and vibrant market scene, this area is bustling with life and great for food lovers who enjoy exploring local flavors. | Local markets, Historic buildings, Culinary classes, Food festivals, Beachside bars |
| Cilento Coast | Renowned for its breathtaking coastal scenery and pristine nature. Perfect for those who value outdoor activities like hiking, swimming, and exploring hidden coves. | Cilento National Park, Hidden beaches, Hiking trails, Kayaking spots, Birdwatching areas |
Understanding Airbnb License Requirements & STR Laws in Castellabate (2025)
Yes, Castellabate, Campania, Italy enforces high STR regulations. Obtaining a license and ensuring compliance is almost certainly required according to current 2025 STR laws. Always verify the latest short term rental regulations and Airbnb license requirements directly with local government authorities for Castellabate to ensure full compliance before hosting.
(Source: AirROI data, 2025, based on 45% licensed listings)
Top Performing Airbnb Properties in Castellabate (2025)
Benchmark your potential! Explore examples of top-performing Airbnb properties in Castellabatebased on Trailing Twelve Month (TTM) revenue. Analyze their characteristics, revenue, occupancy rate, and ADR to understand what drives success in this market.
Villa degli Inglés
Entire Place • 6 bedrooms
Pretty villa with sea views
Entire Place • 4 bedrooms
Villa vue mer (Capri) piscine plage
Entire Place • 5 bedrooms
Villa Gemma in Castellabate Seafront
Entire Place • 2 bedrooms
Exclusive oceanfront home with a terrace
Entire Place • 2 bedrooms
villa with private access to the sea and parking
Entire Place • 3 bedrooms
Note: Performance varies based on location, size, amenities, seasonality, and management quality. Data reflects the past 12 months.
Top Performing Airbnb Hosts in Castellabate (2025)
Learn from the best! This table showcases top-performing Airbnb hosts in Castellabate based on the number of properties managed and estimated total revenue over the past year. Analyze their scale and performance metrics.
| Host Name | Properties | Grossing Revenue | Stay Reviews | Avg Rating |
|---|---|---|---|---|
| Monica | 5 | $76,058 | 180 | 4.84/5.0 |
| Host #474685232 | 3 | $59,474 | 1 | 0.00/5.0 |
| Elena | 2 | $56,213 | 65 | 4.91/5.0 |
| Giovanna | 1 | $55,512 | 45 | 4.76/5.0 |
| Birte | 4 | $52,270 | 84 | 4.83/5.0 |
| Eleonore | 1 | $45,977 | 6 | 5.00/5.0 |
| Maria Chantal | 3 | $45,106 | 5 | 1.67/5.0 |
| Francesco | 2 | $43,823 | 13 | 4.82/5.0 |
| Federica | 3 | $41,492 | 40 | 4.98/5.0 |
| Novasol | 5 | $39,471 | 25 | 2.57/5.0 |
Analyzing the strategies of top hosts, such as their property selection, pricing, and guest communication, can offer valuable lessons for optimizing your own Airbnb operations in Castellabate.
Dive Deeper: Advanced Castellabate STR Market Data (2025)
Ready to unlock more insights? AirROI provides access to advanced metrics and comprehensive Airbnb data for Castellabate. Explore detailed analytics beyond this report to refine your investment strategy, optimize pricing, and maximize your vacation rental profits.
Explore Advanced MetricsCastellabate Short-Term Rental Market Composition (2025): Property & Room Types
Room Type Distribution
Property Type Distribution
Market Composition Insights for Castellabate
- The Castellabate Airbnb market composition is heavily skewed towards Entire Home/Apt listings, which make up 94.4% of the 108 active rentals. This indicates strong guest preference for privacy and space.
- Looking at the property type distribution in Castellabate, Apartment/Condo properties are the most common (55.6%), reflecting the local real estate landscape.
- Houses represent a significant 36.1% portion, catering likely to families or larger groups.
- The presence of 5.6% Hotel/Boutique listings indicates integration with traditional hospitality.
- Smaller segments like others (combined 2.8%) offer potential for unique stay experiences.
Castellabate Airbnb Room Capacity Analysis (2025): Bedroom Distribution
Distribution of Listings by Number of Bedrooms
Room Capacity Insights for Castellabate
- The dominant room capacity in Castellabate is 2 bedrooms listings, making up 50.9% of the market. This suggests a strong demand for properties suitable for couples or solo travelers.
- Together, 2 bedrooms and 1 bedroom properties represent 78.7% of the active Airbnb listings in Castellabate, indicating a high concentration in these sizes.
Castellabate Vacation Rental Guest Capacity Trends (2025)
Distribution of Listings by Guest Capacity
Guest Capacity Insights for Castellabate
- The most common guest capacity trend in Castellabate vacation rentals is listings accommodating 4 guests (35.2%). This suggests the primary traveler segment is likely small families or groups.
- Properties designed for 4 guests and 2 guests dominate the Castellabate STR market, accounting for 52.8% of listings.
- 25.0% of properties accommodate 6+ guests, serving the market segment for larger families or group travel in Castellabate.
- On average, properties in Castellabate are equipped to host 4.4 guests.
Castellabate Airbnb Booking Patterns (2025): Available vs. Booked Days
Available Days Distribution
Booked Days Distribution
Booking Pattern Insights for Castellabate
- The most common availability pattern in Castellabate falls within the 271-366 days range, representing 73.1% of listings. This suggests many properties have significant open periods on their calendars.
- Approximately 98.1% of listings show high availability (181+ days open annually), indicating potential for increased bookings or specific owner usage patterns.
- For booked days, the 31-90 days range is most frequent in Castellabate (37%), reflecting common guest stay durations or potential owner blocking patterns.
- A notable 2.8% of properties secure long booking periods (181+ days booked per year), highlighting successful long-term rental strategies or significant owner usage.
Castellabate Airbnb Minimum Stay Requirements Analysis
Distribution of Listings by Minimum Night Requirement
1 Night
23 listings
23% of total
2 Nights
14 listings
14% of total
3 Nights
14 listings
14% of total
4-6 Nights
13 listings
13% of total
7-29 Nights
27 listings
27% of total
30+ Nights
9 listings
9% of total
Key Insights
- The most prevalent minimum stay requirement in Castellabate is 7-29 Nights, adopted by 27% of listings. This highlights the market's preference for shorter, flexible bookings.
Recommendations
- Align with the market by considering a 7-29 Nights minimum stay, as 27% of Castellabate hosts use this setting.
- If feasible, allowing 1-night stays, especially midweek or during low season, could capture last-minute bookings, as only 23% currently do.
- Explore offering discounts for stays of 30+ nights to attract the 9% of the market seeking extended stays.
- Adjust minimum nights based on seasonality – potentially shorter during low season and longer during peak demand periods in Castellabate.
Castellabate Airbnb Cancellation Policy Trends Analysis (2025)
Super Strict 60 Days
7 listings
8.9% of total
Flexible
18 listings
22.8% of total
Moderate
32 listings
40.5% of total
Strict
22 listings
27.8% of total
Cancellation Policy Insights for Castellabate
- The prevailing Airbnb cancellation policy trend in Castellabate is Moderate, used by 40.5% of listings.
- There's a relatively balanced mix between guest-friendly (63.3%) and stricter (27.8%) policies, offering choices for different guest needs.
Recommendations for Hosts
- Consider adopting a Moderate policy to align with the 40.5% market standard in Castellabate.
- Regularly review your cancellation policy against competitors and market demand shifts in Castellabate.
Castellabate STR Booking Lead Time Analysis (2025)
Average Booking Lead Time by Month
Booking Lead Time Insights for Castellabate
- The overall average booking lead time for vacation rentals in Castellabate is 64 days.
- Guests book furthest in advance for stays during October (average 138 days), likely coinciding with peak travel demand or local events.
- The shortest booking windows occur for stays in February (average 30 days), indicating more last-minute travel plans during this time.
- Seasonally, Fall (92 days avg.) sees the longest lead times, while Winter (61 days avg.) has the shortest, reflecting typical travel planning cycles.
Recommendations for Hosts
- Use the overall average lead time (64 days) as a baseline for your pricing and availability strategy in Castellabate.
- For October stays, consider implementing length-of-stay discounts or slightly higher rates for bookings made less than 138 days out to capitalize on advance planning.
- Target marketing efforts for the Fall season well in advance (at least 92 days) to capture early planners.
- Monitor your own booking lead times against these Castellabate averages to identify opportunities for dynamic pricing adjustments.
Popular & Essential Airbnb Amenities in Castellabate (2025)
Amenity Prevalence
Amenity Insights for Castellabate
- Essential amenities in Castellabate that guests expect include: Kitchen. Lacking these (this) could significantly impact bookings.
- Popular amenities like Washer, TV, Wifi are common but not universal. Offering these can provide a competitive edge.
- Warning: Wifi is not universally provided but is considered essential globally. Ensure reliable Wifi is offered.
Recommendations for Hosts
- Ensure your listing includes all essential amenities for Castellabate: Kitchen.
- Prioritize adding missing essentials: Kitchen.
- Consider adding popular differentiators like Washer or TV to increase appeal.
- Highlight unique or less common amenities you offer (e.g., hot tub, dedicated workspace, EV charger) in your listing description and photos.
- Regularly check competitor amenities in Castellabate to stay competitive.
Castellabate Airbnb Guest Demographics & Profile Analysis (2025)
Guest Profile Summary for Castellabate
- The typical guest profile for Airbnb in Castellabate consists of a mix of domestic (44%) and international guests, with top international origins including Germany, typically belonging to the Post-2000s (Gen Z/Alpha) group (50%), primarily speaking English or Italian.
- Domestic travelers account for 44.4% of guests.
- Key international markets include Italy (44.4%) and Germany (11.2%).
- Top languages spoken are English (38.2%) followed by Italian (25.2%).
- A significant demographic segment is the Post-2000s (Gen Z/Alpha) group, representing 50% of guests.
Recommendations for Hosts
- Balance marketing efforts between domestic and international channels based on the guest mix.
- Tailor amenities and listing descriptions to appeal to the dominant Post-2000s (Gen Z/Alpha) demographic (e.g., highlight fast WiFi, smart home features, local guides).
- Highlight unique local experiences or amenities relevant to the primary guest profile.
- Consider seasonal promotions aligned with peak travel times for key origin markets.
Nearby Short-Term Rental Market Comparison
How does the Castellabate Airbnb market stack up against its neighbors? Compare key performance metrics like average monthly revenue, ADR, and occupancy rates in surrounding areas to understand the broader regional STR landscape.
| Market | Active Properties | Monthly Revenue | Daily Rate | Avg. Occupancy |
|---|---|---|---|---|
| Positano | 683 | $6,671 | $624.23 | 53% |
| Praiano | 331 | $4,415 | $403.56 | 55% |
| Conca dei Marini | 112 | $4,308 | $395.84 | 53% |
| Capri | 423 | $3,942 | $586.54 | 41% |
| Sorrento | 1,475 | $3,702 | $325.69 | 50% |
| Amalfi | 463 | $3,284 | $317.75 | 48% |
| Massa Lubrense | 832 | $3,255 | $413.33 | 45% |
| Ravello | 261 | $3,201 | $317.16 | 47% |
| Furore | 141 | $3,098 | $340.51 | 51% |
| Atrani | 129 | $2,687 | $212.49 | 54% |