Agerola Airbnb Market Analysis 2025: Short Term Rental Data & Vacation Rental Statistics in Campania, Italy
Is Airbnb profitable in Agerola in 2025? Explore comprehensive Airbnb analytics for Agerola, Campania, Italy to uncover income potential. This 2025 STR market report for Agerola, based on AirROI data from April 2024 to March 2025, reveals key trends in the market of 359 active listings.
Whether you're considering an Airbnb investment in Agerola, optimizing your existing vacation rental, or exploring rental arbitrage opportunities, understanding the Agerola Airbnb data is crucial. Navigating the high regulation landscape is key to maximizing your short term rental income potential. Let's dive into the specifics.
Key Agerola Airbnb Performance Metrics Overview
Monthly Airbnb Revenue Variations & Income Potential in Agerola (2025)
Understanding the monthly revenue variations for Airbnb listings in Agerola is key to maximizing your short term rental income potential. Seasonality significantly impacts earnings. Our analysis, based on data from the past 12 months, shows that the peak revenue month for STRs in Agerola is typically August, while March often presents the lowest earnings, highlighting opportunities for strategic pricing adjustments during shoulder and low seasons. Explore the typical Airbnb income in Agerola across different performance tiers:
- Best-in-class properties (Top 10%) achieve $2,550+ monthly, often utilizing dynamic pricing and superior guest experiences.
- Strong performing properties (Top 25%) earn $1,731 or more, indicating effective management and desirable locations/amenities.
- Typical properties (Median) generate around $1,066 per month, representing the average market performance.
- Entry-level properties (Bottom 25%) see earnings around $547, often with potential for optimization.
Average Monthly Airbnb Earnings Trend in Agerola
Agerola Airbnb Occupancy Rate Trends (2025)
Maximize your bookings by understanding the Agerola STR occupancy trends. Seasonal demand shifts significantly influence how often properties are booked. Typically, Augustsees the highest demand (peak season occupancy), while March experiences the lowest (low season). Effective strategies, like adjusting minimum stays or offering promotions, can boost occupancy during slower periods. Here's how different property tiers perform in Agerola:
- Best-in-class properties (Top 10%) achieve 69%+ occupancy, indicating high desirability and potentially optimized availability.
- Strong performing properties (Top 25%) maintain 53% or higher occupancy, suggesting good market fit and guest satisfaction.
- Typical properties (Median) have an occupancy rate around 33%.
- Entry-level properties (Bottom 25%) average 16% occupancy, potentially facing higher vacancy.
Average Monthly Occupancy Rate Trend in Agerola
Average Daily Rate (ADR) Airbnb Trends in Agerola (2025)
Effective short term rental pricing strategy in Agerola involves understanding monthly ADR fluctuations. The Average Daily Rate (ADR) for Airbnb in Agerola typically peaks in August and dips lowest during March. Leveraging Airbnb dynamic pricing tools or strategies based on this seasonality can significantly boost revenue. Here's a look at the typical nightly rates achieved:
- Best-in-class properties (Top 10%) command rates of $166+ per night, often due to premium features or locations.
- Strong performing properties (Top 25%) achieve nightly rates of $122 or more.
- Typical properties (Median) charge around $97 per night.
- Entry-level properties (Bottom 25%) earn around $81 per night.
Average Daily Rate (ADR) Trend by Month in Agerola
Get Live Agerola Market Intelligence 👇

Explore Real-time Analytics
Airbnb Seasonality Analysis & Trends in Agerola (2025)
Peak Season (August, June, May)
- Revenue averages $1,958 per month
- Occupancy rates average 50.3%
- Daily rates average $117
Shoulder Season
- Revenue averages $1,269 per month
- Occupancy maintains around 36.9%
- Daily rates hold near $111
Low Season (January, March, December)
- Revenue drops to average $637 per month
- Occupancy decreases to average 21.8%
- Daily rates adjust to average $105
Seasonality Insights for Agerola
- The Airbnb seasonality in Agerola shows highly seasonal trends requiring careful strategy. While the sections above show seasonal averages, it's also insightful to look at the extremes:
- During the high season, the absolute peak month showcases Agerola's highest earning potential, with monthly revenues capable of climbing to $2,038, occupancy reaching a high of 55.9%, and ADRs peaking at $121.
- Conversely, the slowest single month of the year, typically falling within the low season, marks the market's lowest point. In this month, revenue might dip to $567, occupancy could drop to 19.3%, and ADRs may adjust down to $102.
- Understanding both the seasonal averages and these monthly peaks and troughs in revenue, occupancy, and ADR is crucial for maximizing your Airbnb profit potential in Agerola.
Seasonal Strategies for Maximizing Profit
- Peak Season: Maximize revenue through premium pricing and potentially longer minimum stays. Ensure high availability.
- Low Season: Offer competitive pricing, special promotions (e.g., extended stay discounts), and flexible cancellation policies. Target off-season travelers like remote workers or budget-conscious guests.
- Shoulder Seasons: Implement dynamic pricing that balances peak and low rates. Target weekend travelers or specific events. Offer slightly more flexible terms than peak season.
- Regularly analyze your own performance against these Agerola seasonality benchmarks and adjust your pricing and availability strategy accordingly.
Best Areas for Airbnb Investment in Agerola (2025)
Exploring the top neighborhoods for short-term rentals in Agerola? This section highlights key areas, outlining why they are attractive for hosts and guests, along with notable local attractions. Consider these locations based on your target guest profile and investment strategy.
| Neighborhood / Area | Why Host Here? (Target Guests & Appeal) | Key Attractions & Landmarks |
|---|---|---|
| Agerola Town Center | Centrally located with easy access to shops, cafes, and restaurants. This area attracts visitors looking to explore local culture and cuisine. | Agerola Gastronomy, Sentiero degli dei hiking trail, Church of San Matteo, Cascate di Furore, Local artisan shops |
| Praiano | A short distance from Agerola, Praiano offers stunning views of the Amalfi Coast and is a quieter alternative to Positano, attracting travelers seeking relaxation and scenic beauty. | Marina di Praia, Torre a Mare, Path of the Gods hike, Local beaches, Chiesa di San Giovanni Battista |
| Furore | Famous for its fjord and picturesque scenery, Furore is popular with nature lovers and photographers looking for breathtaking landscapes. | Furore Fjord, Church of San Elia, Scenic viewpoints, Local vineyards, Hiking trails |
| Vettica Maggiore | Known for its incredible coastal views and proximity to hiking trails, this area is ideal for outdoor enthusiasts visiting the Amalfi Coast. | Hiking trails to Amalfi, Chiesa di San Giacomo, Views of the coast, Local seafood restaurants, Cultural events |
| Bomerano | A beautiful village with panoramic views of the coastline, Bomerano is favored by visitors interested in hiking the Sentiero degli Dei. | Sentiero degli Dei trailhead, Local olive oil farms, Artisan shops, Traditional Bomerano cuisine, Charming local culture |
| Nocelle | A small village above Positano, Nocelle offers stunning views and is a great spot for those looking to escape the crowds while still enjoying the Amalfi Coast. | Views of Positano, Path of the Gods, Local trattorias, Hiking paths, Quiet atmosphere |
| Conca dei Marini | A scenic coastal village that serves as a gateway to some of the Amalfi Coast's best-hidden gems, ideal for those looking for a peaceful retreat. | Emerald Grotto, Local lemon groves, Beach clubs, Historical sites, Culinary experiences |
| Agerola's Natural Parks | Surrounded by natural beauty, this area is perfect for eco-tourism and adventure seekers with plenty of outdoor activities available. | Natural parks and landscapes, Mountain biking, Hiking, Flora and fauna exploration, Local festivals |
Understanding Airbnb License Requirements & STR Laws in Agerola (2025)
Yes, Agerola, Campania, Italy enforces high STR regulations. Obtaining a license and ensuring compliance is almost certainly required according to current 2025 STR laws. Always verify the latest short term rental regulations and Airbnb license requirements directly with local government authorities for Agerola to ensure full compliance before hosting.
(Source: AirROI data, 2025, based on 68% licensed listings)
Top Performing Airbnb Properties in Agerola (2025)
Benchmark your potential! Explore examples of top-performing Airbnb properties in Agerolabased on Trailing Twelve Month (TTM) revenue. Analyze their characteristics, revenue, occupancy rate, and ADR to understand what drives success in this market.

Villa del Moro Oltremare
Entire Place • 2 bedrooms

Hakuna Matata Among Trails - Apartment
Entire Place • 2 bedrooms
Louis House in Agerola for Amalfi Positano Pompeii
Entire Place • 2 bedrooms
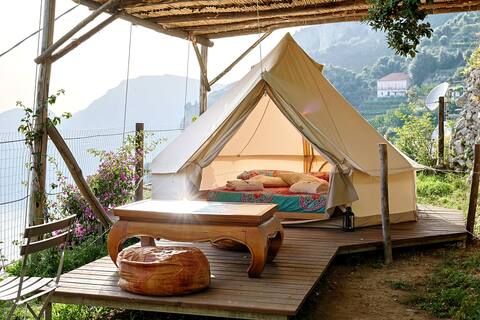
Aphrodite - The Lighthouse of the Glamping Gods
Private Room • 1 bedroom
Aramara Costa d'Amalfi
Entire Place • 3 bedrooms
La Casa de Pino
Entire Place • 2 bedrooms
Note: Performance varies based on location, size, amenities, seasonality, and management quality. Data reflects the past 12 months.
Top Performing Airbnb Hosts in Agerola (2025)
Learn from the best! This table showcases top-performing Airbnb hosts in Agerola based on the number of properties managed and estimated total revenue over the past year. Analyze their scale and performance metrics.
| Host Name | Properties | Grossing Revenue | Stay Reviews | Avg Rating |
|---|---|---|---|---|
| Vincenzo | 4 | $92,132 | 562 | 4.88/5.0 |
| Fiorina | 6 | $84,201 | 278 | 4.87/5.0 |
| Maria | 8 | $83,868 | 47 | 2.37/5.0 |
| Lucia | 4 | $82,072 | 182 | 5.00/5.0 |
| Matteo | 5 | $78,422 | 186 | 4.90/5.0 |
| Luisa | 3 | $78,281 | 267 | 4.95/5.0 |
| Ilenia | 4 | $68,835 | 770 | 4.85/5.0 |
| Pina | 1 | $67,749 | 137 | 4.84/5.0 |
| Juan Carlos | 6 | $65,487 | 1254 | 4.93/5.0 |
| Rita | 3 | $63,209 | 745 | 4.95/5.0 |
Analyzing the strategies of top hosts, such as their property selection, pricing, and guest communication, can offer valuable lessons for optimizing your own Airbnb operations in Agerola.
Dive Deeper: Advanced Agerola STR Market Data (2025)
Ready to unlock more insights? AirROI provides access to advanced metrics and comprehensive Airbnb data for Agerola. Explore detailed analytics beyond this report to refine your investment strategy, optimize pricing, and maximize your vacation rental profits.
Explore Advanced MetricsAgerola Short-Term Rental Market Composition (2025): Property & Room Types
Room Type Distribution
Property Type Distribution
Market Composition Insights for Agerola
- The Agerola Airbnb market composition is heavily skewed towards Entire Home/Apt listings, which make up 56% of the 359 active rentals. This indicates strong guest preference for privacy and space.
- However, a notable 38.2% share for Private Rooms suggests opportunities for budget-conscious travelers or hosts renting out spare rooms.
- Looking at the property type distribution in Agerola, Apartment/Condo properties are the most common (44%), reflecting the local real estate landscape.
- Houses represent a significant 19.8% portion, catering likely to families or larger groups.
- The presence of 29.8% Hotel/Boutique listings indicates integration with traditional hospitality.
- Smaller segments like others (combined 0.6%) offer potential for unique stay experiences.
Agerola Airbnb Room Capacity Analysis (2025): Bedroom Distribution
Distribution of Listings by Number of Bedrooms
Room Capacity Insights for Agerola
- The dominant room capacity in Agerola is 1 bedroom listings, making up 52.9% of the market. This suggests a strong demand for properties suitable for couples or solo travelers.
- Together, 1 bedroom and 2 bedrooms properties represent 72.7% of the active Airbnb listings in Agerola, indicating a high concentration in these sizes.
- With over half the market (52.9%) consisting of studios or 1-bedroom units, Agerola is particularly well-suited for individuals or couples.
- Listings with 3+ bedrooms (7.6%) represent a smaller niche, potentially indicating an underserved market for larger group accommodations in Agerola.
Agerola Vacation Rental Guest Capacity Trends (2025)
Distribution of Listings by Guest Capacity
Guest Capacity Insights for Agerola
- The most common guest capacity trend in Agerola vacation rentals is listings accommodating 2 guests (27.9%). This suggests the primary traveler segment is likely couples or solo travelers.
- Properties designed for 2 guests and 4 guests dominate the Agerola STR market, accounting for 51.3% of listings.
- On average, properties in Agerola are equipped to host 2.9 guests.
Agerola Airbnb Booking Patterns (2025): Available vs. Booked Days
Available Days Distribution
Booked Days Distribution
Booking Pattern Insights for Agerola
- The most common availability pattern in Agerola falls within the 271-366 days range, representing 52.1% of listings. This suggests many properties have significant open periods on their calendars.
- Approximately 89.7% of listings show high availability (181+ days open annually), indicating potential for increased bookings or specific owner usage patterns.
- For booked days, the 91-180 days range is most frequent in Agerola (37.3%), reflecting common guest stay durations or potential owner blocking patterns.
- A notable 11.7% of properties secure long booking periods (181+ days booked per year), highlighting successful long-term rental strategies or significant owner usage.
Agerola Airbnb Minimum Stay Requirements Analysis
Distribution of Listings by Minimum Night Requirement
1 Night
119 listings
35.5% of total
2 Nights
120 listings
35.8% of total
3 Nights
25 listings
7.5% of total
4-6 Nights
7 listings
2.1% of total
7-29 Nights
16 listings
4.8% of total
30+ Nights
48 listings
14.3% of total
Key Insights
- The most prevalent minimum stay requirement in Agerola is 2 Nights, adopted by 35.8% of listings. This highlights the market's preference for shorter, flexible bookings.
- A strong majority (71.3%) of the Agerola Airbnb data shows acceptance of very short stays (1-2 nights), indicating a dynamic, high-turnover market.
- A significant segment (14.3%) caters to monthly stays (30+ nights) in Agerola, pointing to opportunities in the extended-stay market.
Recommendations
- Align with the market by considering a 2 Nights minimum stay, as 35.8% of Agerola hosts use this setting.
- Explore offering discounts for stays of 30+ nights to attract the 14.3% of the market seeking extended stays.
- Adjust minimum nights based on seasonality – potentially shorter during low season and longer during peak demand periods in Agerola.
Agerola Airbnb Cancellation Policy Trends Analysis (2025)
Super Strict 30 Days
7 listings
2.3% of total
Super Strict 60 Days
2 listings
0.7% of total
Flexible
60 listings
19.8% of total
Moderate
190 listings
62.7% of total
Strict
44 listings
14.5% of total
Cancellation Policy Insights for Agerola
- The prevailing Airbnb cancellation policy trend in Agerola is Moderate, used by 62.7% of listings.
- The market strongly favors guest-friendly terms, with 82.5% of listings offering Flexible or Moderate policies. This suggests guests in Agerola may expect booking flexibility.
Recommendations for Hosts
- Consider adopting a Moderate policy to align with the 62.7% market standard in Agerola.
- Using a Strict policy might deter some guests, as only 14.5% of listings use it. Evaluate if potential revenue protection outweighs possible lower booking rates.
- Regularly review your cancellation policy against competitors and market demand shifts in Agerola.
Agerola STR Booking Lead Time Analysis (2025)
Average Booking Lead Time by Month
Booking Lead Time Insights for Agerola
- The overall average booking lead time for vacation rentals in Agerola is 53 days.
- Guests book furthest in advance for stays during June (average 72 days), likely coinciding with peak travel demand or local events.
- The shortest booking windows occur for stays in December (average 38 days), indicating more last-minute travel plans during this time.
- Seasonally, Summer (67 days avg.) sees the longest lead times, while Winter (45 days avg.) has the shortest, reflecting typical travel planning cycles.
Recommendations for Hosts
- Use the overall average lead time (53 days) as a baseline for your pricing and availability strategy in Agerola.
- For June stays, consider implementing length-of-stay discounts or slightly higher rates for bookings made less than 72 days out to capitalize on advance planning.
- Target marketing efforts for the Summer season well in advance (at least 67 days) to capture early planners.
- Monitor your own booking lead times against these Agerola averages to identify opportunities for dynamic pricing adjustments.
Popular & Essential Airbnb Amenities in Agerola (2025)
Amenity Prevalence
Amenity Insights for Agerola
- Essential amenities in Agerola that guests expect include: Wifi, Heating. Lacking these (any) could significantly impact bookings.
- Popular amenities like Essentials, Hair dryer, Hot water are common but not universal. Offering these can provide a competitive edge.
Recommendations for Hosts
- Ensure your listing includes all essential amenities for Agerola: Wifi, Heating.
- Prioritize adding missing essentials: Wifi, Heating.
- Consider adding popular differentiators like Essentials or Hair dryer to increase appeal.
- Highlight unique or less common amenities you offer (e.g., hot tub, dedicated workspace, EV charger) in your listing description and photos.
- Regularly check competitor amenities in Agerola to stay competitive.
Agerola Airbnb Guest Demographics & Profile Analysis (2025)
Guest Profile Summary for Agerola
- The typical guest profile for Airbnb in Agerola consists of predominantly international visitors (95%), with top international origins including France, typically belonging to the Post-2000s (Gen Z/Alpha) group (50%), primarily speaking English or French.
- Domestic travelers account for 5.4% of guests.
- Key international markets include United States (18%) and France (10.6%).
- Top languages spoken are English (45.1%) followed by French (11.4%).
- A significant demographic segment is the Post-2000s (Gen Z/Alpha) group, representing 50% of guests.
Recommendations for Hosts
- Focus marketing internationally, particularly towards travelers from France.
- Tailor amenities and listing descriptions to appeal to the dominant Post-2000s (Gen Z/Alpha) demographic (e.g., highlight fast WiFi, smart home features, local guides).
- Highlight unique local experiences or amenities relevant to the primary guest profile.
- Consider seasonal promotions aligned with peak travel times for key origin markets.
Nearby Short-Term Rental Market Comparison
How does the Agerola Airbnb market stack up against its neighbors? Compare key performance metrics like average monthly revenue, ADR, and occupancy rates in surrounding areas to understand the broader regional STR landscape.
| Market | Active Properties | Monthly Revenue | Daily Rate | Avg. Occupancy |
|---|---|---|---|---|
| Positano | 683 | $6,671 | $624.23 | 53% |
| Praiano | 331 | $4,415 | $403.56 | 55% |
| Conca dei Marini | 112 | $4,308 | $395.84 | 53% |
| Capri | 423 | $3,942 | $586.54 | 41% |
| Sorrento | 1,475 | $3,702 | $325.69 | 50% |
| Amalfi | 463 | $3,284 | $317.75 | 48% |
| Massa Lubrense | 832 | $3,255 | $413.33 | 45% |
| Ravello | 261 | $3,201 | $317.16 | 47% |
| Furore | 141 | $3,098 | $340.51 | 51% |
| Atrani | 129 | $2,687 | $212.49 | 54% |