Rossano Scalo Airbnb Market Analysis 2025: Short Term Rental Data & Vacation Rental Statistics in Calabria, Italy
Is Airbnb profitable in Rossano Scalo in 2025? Explore comprehensive Airbnb analytics for Rossano Scalo, Calabria, Italy to uncover income potential. This 2025 STR market report for Rossano Scalo, based on AirROI data from April 2024 to March 2025, reveals key trends in the niche market of 20 active listings.
Whether you're considering an Airbnb investment in Rossano Scalo, optimizing your existing vacation rental, or exploring rental arbitrage opportunities, understanding the Rossano Scalo Airbnb data is crucial. Understanding the local regulations is key to maximizing your short term rental income potential. Let's dive into the specifics.
Key Rossano Scalo Airbnb Performance Metrics Overview
Monthly Airbnb Revenue Variations & Income Potential in Rossano Scalo (2025)
Understanding the monthly revenue variations for Airbnb listings in Rossano Scalo is key to maximizing your short term rental income potential. Seasonality significantly impacts earnings. Our analysis, based on data from the past 12 months, shows that the peak revenue month for STRs in Rossano Scalo is typically August, while February often presents the lowest earnings, highlighting opportunities for strategic pricing adjustments during shoulder and low seasons. Explore the typical Airbnb income in Rossano Scalo across different performance tiers:
- Best-in-class properties (Top 10%) achieve $1,642+ monthly, often utilizing dynamic pricing and superior guest experiences.
- Strong performing properties (Top 25%) earn $959 or more, indicating effective management and desirable locations/amenities.
- Typical properties (Median) generate around $508 per month, representing the average market performance.
- Entry-level properties (Bottom 25%) see earnings around $218, often with potential for optimization.
Average Monthly Airbnb Earnings Trend in Rossano Scalo
Rossano Scalo Airbnb Occupancy Rate Trends (2025)
Maximize your bookings by understanding the Rossano Scalo STR occupancy trends. Seasonal demand shifts significantly influence how often properties are booked. Typically, Augustsees the highest demand (peak season occupancy), while May experiences the lowest (low season). Effective strategies, like adjusting minimum stays or offering promotions, can boost occupancy during slower periods. Here's how different property tiers perform in Rossano Scalo:
- Best-in-class properties (Top 10%) achieve 56%+ occupancy, indicating high desirability and potentially optimized availability.
- Strong performing properties (Top 25%) maintain 37% or higher occupancy, suggesting good market fit and guest satisfaction.
- Typical properties (Median) have an occupancy rate around 18%.
- Entry-level properties (Bottom 25%) average 10% occupancy, potentially facing higher vacancy.
Average Monthly Occupancy Rate Trend in Rossano Scalo
Average Daily Rate (ADR) Airbnb Trends in Rossano Scalo (2025)
Effective short term rental pricing strategy in Rossano Scalo involves understanding monthly ADR fluctuations. The Average Daily Rate (ADR) for Airbnb in Rossano Scalo typically peaks in August and dips lowest during March. Leveraging Airbnb dynamic pricing tools or strategies based on this seasonality can significantly boost revenue. Here's a look at the typical nightly rates achieved:
- Best-in-class properties (Top 10%) command rates of $137+ per night, often due to premium features or locations.
- Strong performing properties (Top 25%) achieve nightly rates of $103 or more.
- Typical properties (Median) charge around $71 per night.
- Entry-level properties (Bottom 25%) earn around $55 per night.
Average Daily Rate (ADR) Trend by Month in Rossano Scalo
Get Live Rossano Scalo Market Intelligence 👇

Explore Real-time Analytics
Airbnb Seasonality Analysis & Trends in Rossano Scalo (2025)
Peak Season (August, July, May)
- Revenue averages $1,230 per month
- Occupancy rates average 32.2%
- Daily rates average $95
Shoulder Season
- Revenue averages $627 per month
- Occupancy maintains around 23.5%
- Daily rates hold near $85
Low Season (February, March, December)
- Revenue drops to average $370 per month
- Occupancy decreases to average 21.2%
- Daily rates adjust to average $67
Seasonality Insights for Rossano Scalo
- The Airbnb seasonality in Rossano Scalo shows highly seasonal trends requiring careful strategy. While the sections above show seasonal averages, it's also insightful to look at the extremes:
- During the high season, the absolute peak month showcases Rossano Scalo's highest earning potential, with monthly revenues capable of climbing to $1,699, occupancy reaching a high of 45.8%, and ADRs peaking at $99.
- Conversely, the slowest single month of the year, typically falling within the low season, marks the market's lowest point. In this month, revenue might dip to $290, occupancy could drop to 13.3%, and ADRs may adjust down to $67.
- Understanding both the seasonal averages and these monthly peaks and troughs in revenue, occupancy, and ADR is crucial for maximizing your Airbnb profit potential in Rossano Scalo.
Seasonal Strategies for Maximizing Profit
- Peak Season: Maximize revenue through premium pricing and potentially longer minimum stays. Ensure high availability.
- Low Season: Offer competitive pricing, special promotions (e.g., extended stay discounts), and flexible cancellation policies. Target off-season travelers like remote workers or budget-conscious guests.
- Shoulder Seasons: Implement dynamic pricing that balances peak and low rates. Target weekend travelers or specific events. Offer slightly more flexible terms than peak season.
- Regularly analyze your own performance against these Rossano Scalo seasonality benchmarks and adjust your pricing and availability strategy accordingly.
Best Areas for Airbnb Investment in Rossano Scalo (2025)
Exploring the top neighborhoods for short-term rentals in Rossano Scalo? This section highlights key areas, outlining why they are attractive for hosts and guests, along with notable local attractions. Consider these locations based on your target guest profile and investment strategy.
| Neighborhood / Area | Why Host Here? (Target Guests & Appeal) | Key Attractions & Landmarks |
|---|---|---|
| Centro Storico | The historic center of Rossano Scalo, rich in culture and history, attracts tourists interested in Italian heritage, architecture, and local cuisine. | Rossano Cathedral, Byzantine Museum of Calligraphy, Saint Mark's Mountain, Piana di Sibari, Civita di Rota |
| Rossano Beach | A popular beach destination that draws visitors seeking sun, sea, and relaxation. Ideal for families and beachgoers during the summer months. | Spiaggia di Rossano, Lido la Dolce Vita, Aranceto Beach, Il Faro Beach, La Tonnara Beach |
| Sila National Park | A natural park offering stunning landscapes and outdoor activities, such as hiking and skiing, attracting nature lovers and adventure seekers. | Sila Mountain, Lake Arvo, Silvio Pellico, Wildlife watching, Botanical Gardens of Sila |
| Cassano allo Ionio | A nearby town with historical significance and beautiful landscapes, appealing to tourists looking for cultural experiences beyond Rossano. | Abbey of Santa Maria del Patire, Piana di Sibari, Rocca Imperiale, Museo Archeologico, Castello di Roseto |
| Civita di Rota | A picturesque village known for its stunning views and charming old town, drawing guests interested in unique and scenic experiences. | Historic houses, Chiesa di San Francesco, Ancient stone bridges, Local festivals, Natural views |
| Castrovillari | Known for its vibrant historical center and proximity to national parks, it attracts visitors who enjoy both culture and nature. | Castrovillari Castle, Museo Archeologico, National Park of Pollino, Via dei Venti, Local gastronomy |
| Corigliano Calabro | A town with a rich history and beautiful coastal scenery, perfect for travelers seeking a blend of culture, history, and relaxation. | Castle of Corigliano, Historic center, Corigliano Beach, San Francesco di Paola Church, Local wineries |
| Cariati | A charming coastal village famous for its beaches and historical architecture, ideal for visitors looking for a tranquil seaside escape. | Cariati Beach, Old Town, San Domenico Church, Local markets, Vineyards nearby |
Understanding Airbnb License Requirements & STR Laws in Rossano Scalo (2025)
With 25% of listings showing registration in 2025, understanding potential Airbnb license requirements is crucial in Rossano Scalo. Always verify the latest short term rental regulations and Airbnb license requirements directly with local government authorities for Rossano Scalo to ensure full compliance before hosting.
(Source: AirROI data, 2025, based on 25% licensed listings)
Top Performing Airbnb Properties in Rossano Scalo (2025)
Benchmark your potential! Explore examples of top-performing Airbnb properties in Rossano Scalobased on Trailing Twelve Month (TTM) revenue. Analyze their characteristics, revenue, occupancy rate, and ADR to understand what drives success in this market.
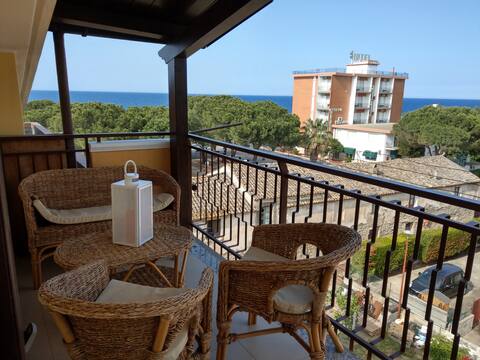
Loft style apartment just steps from the sea
Entire Place • 1 bedroom

Spacious apartment
Entire Place • 2 bedrooms
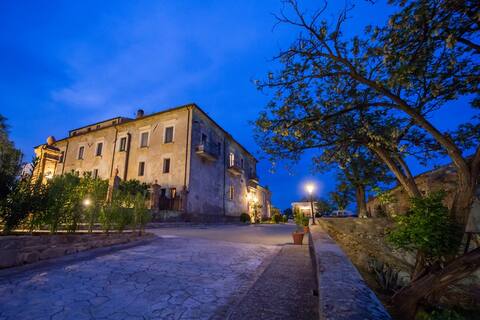
Tenuta Ciminata Greco - Superior apartment
Entire Place • 1 bedroom
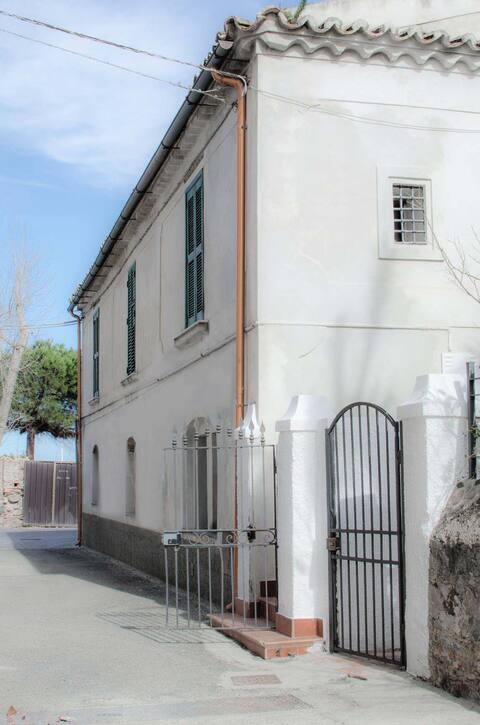
House overlooking the sea
Entire Place • 2 bedrooms

Studio-Apartment few steps from the beach (300mt)
Entire Place • 2 bedrooms
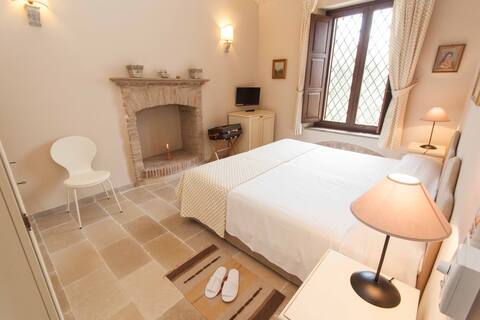
Tenuta Ciminata Greco - Double/Double Room
Entire Place • 1 bedroom
Note: Performance varies based on location, size, amenities, seasonality, and management quality. Data reflects the past 12 months.
Top Performing Airbnb Hosts in Rossano Scalo (2025)
Learn from the best! This table showcases top-performing Airbnb hosts in Rossano Scalo based on the number of properties managed and estimated total revenue over the past year. Analyze their scale and performance metrics.
| Host Name | Properties | Grossing Revenue | Stay Reviews | Avg Rating |
|---|---|---|---|---|
| Mario | 2 | $19,814 | 36 | 4.91/5.0 |
| Anna | 1 | $17,549 | 14 | 4.93/5.0 |
| Fe | 1 | $15,516 | 22 | 4.77/5.0 |
| Francesco | 1 | $7,165 | 29 | 4.72/5.0 |
| Dario | 1 | $5,848 | 28 | 4.89/5.0 |
| Margaret | 1 | $4,900 | 108 | 4.89/5.0 |
| Antonio | 1 | $4,321 | 12 | 4.92/5.0 |
| Giovanna Beatrice | 1 | $3,975 | 5 | 4.20/5.0 |
| Host #498073987 | 1 | $3,945 | 2 | 0.00/5.0 |
| Elena Maria | 1 | $3,751 | 11 | 4.73/5.0 |
Analyzing the strategies of top hosts, such as their property selection, pricing, and guest communication, can offer valuable lessons for optimizing your own Airbnb operations in Rossano Scalo.
Dive Deeper: Advanced Rossano Scalo STR Market Data (2025)
Ready to unlock more insights? AirROI provides access to advanced metrics and comprehensive Airbnb data for Rossano Scalo. Explore detailed analytics beyond this report to refine your investment strategy, optimize pricing, and maximize your vacation rental profits.
Explore Advanced MetricsRossano Scalo Short-Term Rental Market Composition (2025): Property & Room Types
Room Type Distribution
Property Type Distribution
Market Composition Insights for Rossano Scalo
- The Rossano Scalo Airbnb market composition is heavily skewed towards Entire Home/Apt listings, which make up 85% of the 20 active rentals. This indicates strong guest preference for privacy and space.
- Looking at the property type distribution in Rossano Scalo, Apartment/Condo properties are the most common (50%), reflecting the local real estate landscape.
- Houses represent a significant 25% portion, catering likely to families or larger groups.
- The presence of 15% Hotel/Boutique listings indicates integration with traditional hospitality.
Rossano Scalo Airbnb Room Capacity Analysis (2025): Bedroom Distribution
Distribution of Listings by Number of Bedrooms
Room Capacity Insights for Rossano Scalo
- The dominant room capacity in Rossano Scalo is 2 bedrooms listings, making up 50% of the market. This suggests a strong demand for properties suitable for couples or solo travelers.
- Together, 2 bedrooms and 1 bedroom properties represent 85.0% of the active Airbnb listings in Rossano Scalo, indicating a high concentration in these sizes.
Rossano Scalo Vacation Rental Guest Capacity Trends (2025)
Distribution of Listings by Guest Capacity
Guest Capacity Insights for Rossano Scalo
- The most common guest capacity trend in Rossano Scalo vacation rentals is listings accommodating 4 guests (50%). This suggests the primary traveler segment is likely small families or groups.
- Properties designed for 4 guests and 2 guests dominate the Rossano Scalo STR market, accounting for 65.0% of listings.
- On average, properties in Rossano Scalo are equipped to host 3.8 guests.
Rossano Scalo Airbnb Booking Patterns (2025): Available vs. Booked Days
Available Days Distribution
Booked Days Distribution
Booking Pattern Insights for Rossano Scalo
- The most common availability pattern in Rossano Scalo falls within the 271-366 days range, representing 85% of listings. This suggests many properties have significant open periods on their calendars.
- Approximately 90.0% of listings show high availability (181+ days open annually), indicating potential for increased bookings or specific owner usage patterns.
- For booked days, the 31-90 days range is most frequent in Rossano Scalo (50%), reflecting common guest stay durations or potential owner blocking patterns.
- A notable 10.0% of properties secure long booking periods (181+ days booked per year), highlighting successful long-term rental strategies or significant owner usage.
Rossano Scalo Airbnb Minimum Stay Requirements Analysis
Distribution of Listings by Minimum Night Requirement
1 Night
8 listings
42.1% of total
2 Nights
3 listings
15.8% of total
3 Nights
1 listings
5.3% of total
4-6 Nights
3 listings
15.8% of total
7-29 Nights
4 listings
21.1% of total
Key Insights
- The most prevalent minimum stay requirement in Rossano Scalo is 1 Night, adopted by 42.1% of listings. This highlights the market's preference for shorter, flexible bookings.
Recommendations
- Align with the market by considering a 1 Night minimum stay, as 42.1% of Rossano Scalo hosts use this setting.
- Adjust minimum nights based on seasonality – potentially shorter during low season and longer during peak demand periods in Rossano Scalo.
Rossano Scalo Airbnb Cancellation Policy Trends Analysis (2025)
Flexible
5 listings
35.7% of total
Moderate
6 listings
42.9% of total
Strict
3 listings
21.4% of total
Cancellation Policy Insights for Rossano Scalo
- The prevailing Airbnb cancellation policy trend in Rossano Scalo is Moderate, used by 42.9% of listings.
- The market strongly favors guest-friendly terms, with 78.6% of listings offering Flexible or Moderate policies. This suggests guests in Rossano Scalo may expect booking flexibility.
Recommendations for Hosts
- Consider adopting a Moderate policy to align with the 42.9% market standard in Rossano Scalo.
- Regularly review your cancellation policy against competitors and market demand shifts in Rossano Scalo.
Rossano Scalo STR Booking Lead Time Analysis (2025)
Average Booking Lead Time by Month
Booking Lead Time Insights for Rossano Scalo
- The overall average booking lead time for vacation rentals in Rossano Scalo is 59 days.
- Guests book furthest in advance for stays during July (average 86 days), likely coinciding with peak travel demand or local events.
- The shortest booking windows occur for stays in March (average 0 days), indicating more last-minute travel plans during this time.
- Seasonally, Summer (81 days avg.) sees the longest lead times, while Winter (22 days avg.) has the shortest, reflecting typical travel planning cycles.
Recommendations for Hosts
- Use the overall average lead time (59 days) as a baseline for your pricing and availability strategy in Rossano Scalo.
- For July stays, consider implementing length-of-stay discounts or slightly higher rates for bookings made less than 86 days out to capitalize on advance planning.
- During March, focus on last-minute booking availability and promotions, as guests book with very short notice (0 days avg.).
- Target marketing efforts for the Summer season well in advance (at least 81 days) to capture early planners.
- Monitor your own booking lead times against these Rossano Scalo averages to identify opportunities for dynamic pricing adjustments.
Popular & Essential Airbnb Amenities in Rossano Scalo (2025)
Amenity Prevalence
Amenity Insights for Rossano Scalo
- Essential amenities in Rossano Scalo that guests expect include: TV, Essentials, Hot water. Lacking these (any) could significantly impact bookings.
- Popular amenities like Kitchen, Washer, Wifi are common but not universal. Offering these can provide a competitive edge.
- Warning: Wifi is not universally provided but is considered essential globally. Ensure reliable Wifi is offered.
Recommendations for Hosts
- Ensure your listing includes all essential amenities for Rossano Scalo: TV, Essentials, Hot water.
- Prioritize adding missing essentials: Hot water.
- Consider adding popular differentiators like Kitchen or Washer to increase appeal.
- Highlight unique or less common amenities you offer (e.g., hot tub, dedicated workspace, EV charger) in your listing description and photos.
- Regularly check competitor amenities in Rossano Scalo to stay competitive.
Rossano Scalo Airbnb Guest Demographics & Profile Analysis (2025)
Guest Profile Summary for Rossano Scalo
- The typical guest profile for Airbnb in Rossano Scalo consists of predominantly international visitors (67%), with top international origins including Germany, typically belonging to the Post-2000s (Gen Z/Alpha) group (50%), primarily speaking English or Italian.
- Domestic travelers account for 33.3% of guests.
- Key international markets include Italy (33.3%) and Germany (12.5%).
- Top languages spoken are English (35.1%) followed by Italian (22.1%).
- A significant demographic segment is the Post-2000s (Gen Z/Alpha) group, representing 50% of guests.
Recommendations for Hosts
- Focus marketing internationally, particularly towards travelers from Germany.
- Tailor amenities and listing descriptions to appeal to the dominant Post-2000s (Gen Z/Alpha) demographic (e.g., highlight fast WiFi, smart home features, local guides).
- Highlight unique local experiences or amenities relevant to the primary guest profile.
- Consider seasonal promotions aligned with peak travel times for key origin markets.
Nearby Short-Term Rental Market Comparison
How does the Rossano Scalo Airbnb market stack up against its neighbors? Compare key performance metrics like average monthly revenue, ADR, and occupancy rates in surrounding areas to understand the broader regional STR landscape.
| Market | Active Properties | Monthly Revenue | Daily Rate | Avg. Occupancy |
|---|---|---|---|---|
| San Michele Salentino | 74 | $2,208 | $260.22 | 44% |
| Torregrotta | 16 | $2,105 | $267.72 | 36% |
| Polignano a Mare | 624 | $1,978 | $205.82 | 44% |
| Castellana Grotte | 185 | $1,845 | $219.26 | 43% |
| Torchiara | 21 | $1,737 | $280.56 | 26% |
| Ostuni | 1,576 | $1,730 | $250.45 | 39% |
| Tropea | 10 | $1,702 | $157.29 | 49% |
| Ceglie Messapica | 380 | $1,660 | $223.98 | 41% |
| Martina Franca | 569 | $1,657 | $217.67 | 39% |
| Monopoli | 1,141 | $1,637 | $195.75 | 43% |