Bernalda Airbnb Market Analysis 2025: Short Term Rental Data & Vacation Rental Statistics in Basilicata, Italy
Is Airbnb profitable in Bernalda in 2025? Explore comprehensive Airbnb analytics for Bernalda, Basilicata, Italy to uncover income potential. This 2025 STR market report for Bernalda, based on AirROI data from April 2024 to March 2025, reveals key trends in the niche market of 25 active listings.
Whether you're considering an Airbnb investment in Bernalda, optimizing your existing vacation rental, or exploring rental arbitrage opportunities, understanding the Bernalda Airbnb data is crucial. Navigating the high regulation landscape is key to maximizing your short term rental income potential. Let's dive into the specifics.
Key Bernalda Airbnb Performance Metrics Overview
Monthly Airbnb Revenue Variations & Income Potential in Bernalda (2025)
Understanding the monthly revenue variations for Airbnb listings in Bernalda is key to maximizing your short term rental income potential. Seasonality significantly impacts earnings. Our analysis, based on data from the past 12 months, shows that the peak revenue month for STRs in Bernalda is typically August, while February often presents the lowest earnings, highlighting opportunities for strategic pricing adjustments during shoulder and low seasons. Explore the typical Airbnb income in Bernalda across different performance tiers:
- Best-in-class properties (Top 10%) achieve $2,580+ monthly, often utilizing dynamic pricing and superior guest experiences.
- Strong performing properties (Top 25%) earn $952 or more, indicating effective management and desirable locations/amenities.
- Typical properties (Median) generate around $458 per month, representing the average market performance.
- Entry-level properties (Bottom 25%) see earnings around $254, often with potential for optimization.
Average Monthly Airbnb Earnings Trend in Bernalda
Bernalda Airbnb Occupancy Rate Trends (2025)
Maximize your bookings by understanding the Bernalda STR occupancy trends. Seasonal demand shifts significantly influence how often properties are booked. Typically, Augustsees the highest demand (peak season occupancy), while January experiences the lowest (low season). Effective strategies, like adjusting minimum stays or offering promotions, can boost occupancy during slower periods. Here's how different property tiers perform in Bernalda:
- Best-in-class properties (Top 10%) achieve 56%+ occupancy, indicating high desirability and potentially optimized availability.
- Strong performing properties (Top 25%) maintain 31% or higher occupancy, suggesting good market fit and guest satisfaction.
- Typical properties (Median) have an occupancy rate around 17%.
- Entry-level properties (Bottom 25%) average 9% occupancy, potentially facing higher vacancy.
Average Monthly Occupancy Rate Trend in Bernalda
Average Daily Rate (ADR) Airbnb Trends in Bernalda (2025)
Effective short term rental pricing strategy in Bernalda involves understanding monthly ADR fluctuations. The Average Daily Rate (ADR) for Airbnb in Bernalda typically peaks in July and dips lowest during November. Leveraging Airbnb dynamic pricing tools or strategies based on this seasonality can significantly boost revenue. Here's a look at the typical nightly rates achieved:
- Best-in-class properties (Top 10%) command rates of $141+ per night, often due to premium features or locations.
- Strong performing properties (Top 25%) achieve nightly rates of $107 or more.
- Typical properties (Median) charge around $86 per night.
- Entry-level properties (Bottom 25%) earn around $66 per night.
Average Daily Rate (ADR) Trend by Month in Bernalda
Get Live Bernalda Market Intelligence 👇

Explore Real-time Analytics
Airbnb Seasonality Analysis & Trends in Bernalda (2025)
Peak Season (August, May, April)
- Revenue averages $1,433 per month
- Occupancy rates average 28.5%
- Daily rates average $100
Shoulder Season
- Revenue averages $739 per month
- Occupancy maintains around 22.5%
- Daily rates hold near $94
Low Season (January, February, September)
- Revenue drops to average $443 per month
- Occupancy decreases to average 16.6%
- Daily rates adjust to average $91
Seasonality Insights for Bernalda
- The Airbnb seasonality in Bernalda shows highly seasonal trends requiring careful strategy. While the sections above show seasonal averages, it's also insightful to look at the extremes:
- During the high season, the absolute peak month showcases Bernalda's highest earning potential, with monthly revenues capable of climbing to $1,690, occupancy reaching a high of 50.5%, and ADRs peaking at $101.
- Conversely, the slowest single month of the year, typically falling within the low season, marks the market's lowest point. In this month, revenue might dip to $377, occupancy could drop to 14.3%, and ADRs may adjust down to $88.
- Understanding both the seasonal averages and these monthly peaks and troughs in revenue, occupancy, and ADR is crucial for maximizing your Airbnb profit potential in Bernalda.
Seasonal Strategies for Maximizing Profit
- Peak Season: Maximize revenue through premium pricing and potentially longer minimum stays. Ensure high availability.
- Low Season: Offer competitive pricing, special promotions (e.g., extended stay discounts), and flexible cancellation policies. Target off-season travelers like remote workers or budget-conscious guests.
- Shoulder Seasons: Implement dynamic pricing that balances peak and low rates. Target weekend travelers or specific events. Offer slightly more flexible terms than peak season.
- Regularly analyze your own performance against these Bernalda seasonality benchmarks and adjust your pricing and availability strategy accordingly.
Best Areas for Airbnb Investment in Bernalda (2025)
Exploring the top neighborhoods for short-term rentals in Bernalda? This section highlights key areas, outlining why they are attractive for hosts and guests, along with notable local attractions. Consider these locations based on your target guest profile and investment strategy.
| Neighborhood / Area | Why Host Here? (Target Guests & Appeal) | Key Attractions & Landmarks |
|---|---|---|
| Historic Center | The heart of Bernalda, featuring charming narrow streets and traditional architecture. Attracts tourists for its local culture, gastronomy, and historical significance, making it a prime spot for travelers looking to immerse themselves in Italian heritage. | Castello di Bernalda, Chiesa Madre, Piazza San Bernardino, Local trattorias and gelaterias |
| Beach Resorts | Close proximity to the Ionian sea, this area is perfect for beach lovers. The coastline offers beautiful sandy beaches and numerous activities such as water sports, sunbathing, and beachside dining, attracting families and tourists during the summer. | Metaponto Beach, Lido Onda Blu, Oasis Beach, Historical sites along the coast |
| Cultural Sites | Rich in history and culture, this area showcases the ancient Greek influences in the region. Ideal for those interested in historical tours and cultural experiences, making it perfect for educational trips and cultural tourism. | Archaeological Park of Metaponto, Sanctuary of Demeter, Excursions to Matera, Ancient ruins nearby |
| Wine Country | Located near vineyards and wineries, this area attracts tourists interested in wine tasting and gastronomic experiences. A perfect getaway for wine enthusiasts and culinary tourists looking to immerse themselves in local flavors and traditions. | Vineyard tours, Wine tastings, Local food markets, Culinary festivals |
| Nature Trails | Bernalda is surrounded by beautiful landscapes and nature parks, perfect for outdoor enthusiasts. This area attracts eco-tourists, hikers, and families looking to enjoy nature and outdoor activities during their stay. | Park of Gallipoli Cognato, Hiking trails, Scenic viewpoints, Bird watching spots |
| Local Markets | The area known for its vibrant local markets and artisanal crafts, attracting tourists looking to experience the local lifestyle and shop for unique souvenirs. A great location for those interested in local culture and handcrafted goods. | Bernalda's weekly market, Artisan workshops, Local craft stores, Culinary specialties |
| Gastronomy Hub | Renowned for its delicious local cuisine, this area captures the taste of Basilicata. Perfect for foodies looking to enjoy authentic local dishes, regional specialties, and cooking classes during their stay. | Local restaurants, Cooking schools, Food festivals, Culinary workshops |
| Festival Area | Home to local festivals and events throughout the year, this area draws crowds looking to participate in cultural celebrations and events. An exciting option for tourists looking to experience the local culture first-hand. | Local summer festivals, Fairs and events, Tradition of Tarantella dances, Food and wine festivals |
Understanding Airbnb License Requirements & STR Laws in Bernalda (2025)
Yes, Bernalda, Basilicata, Italy enforces high STR regulations. Obtaining a license and ensuring compliance is almost certainly required according to current 2025 STR laws. Always verify the latest short term rental regulations and Airbnb license requirements directly with local government authorities for Bernalda to ensure full compliance before hosting.
(Source: AirROI data, 2025, based on 36% licensed listings)
Top Performing Airbnb Properties in Bernalda (2025)
Benchmark your potential! Explore examples of top-performing Airbnb properties in Bernaldabased on Trailing Twelve Month (TTM) revenue. Analyze their characteristics, revenue, occupancy rate, and ADR to understand what drives success in this market.

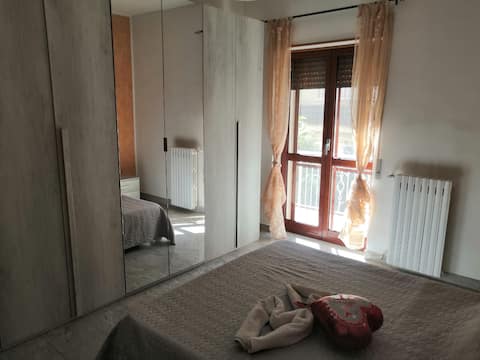
Eldoh
Entire Place • 2 bedrooms
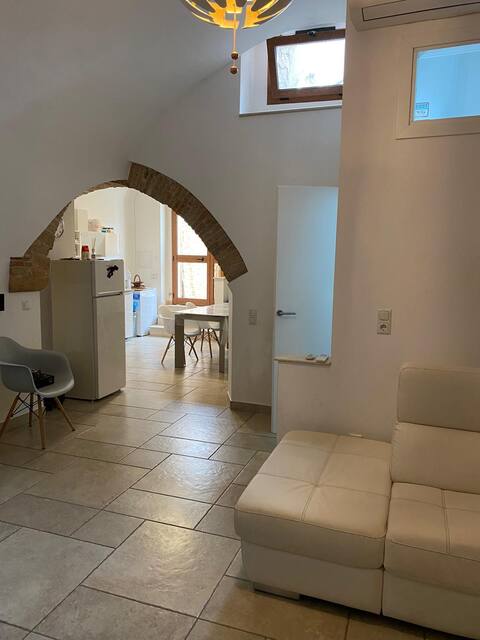
In Grace's House
Entire Place • 2 bedrooms
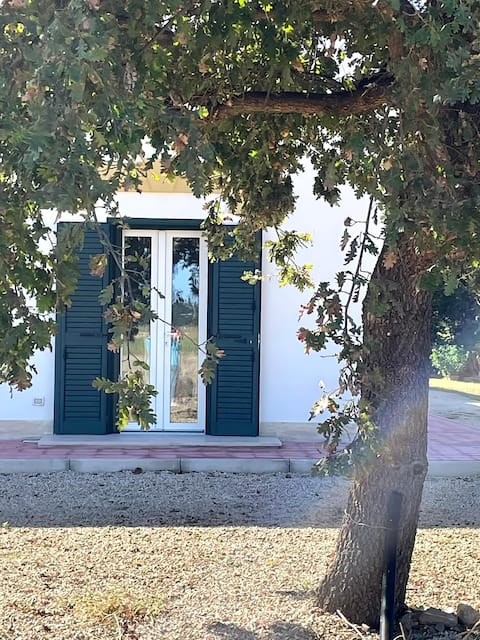
Charm and comfort in Via Eraclea
Entire Place • 2 bedrooms
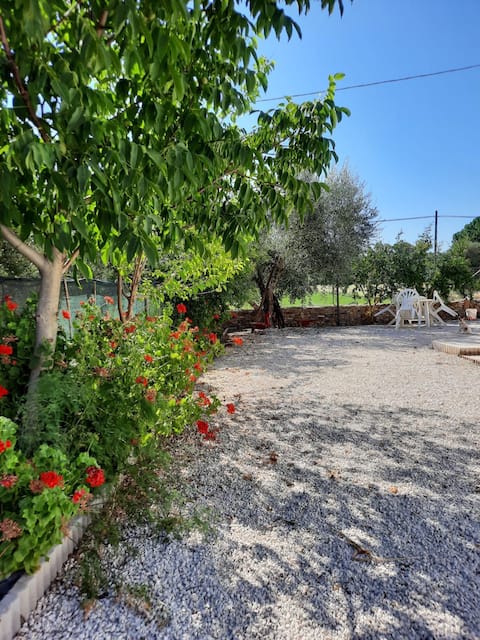
On the roof of Metaponto. Casa Quercia
Entire Place • 1 bedroom
Angelo's Country House (Casavacanze)
Entire Place • 1 bedroom

On the roof of Metaponto. Casa Gelso
Entire Place • 1 bedroom
Note: Performance varies based on location, size, amenities, seasonality, and management quality. Data reflects the past 12 months.
Top Performing Airbnb Hosts in Bernalda (2025)
Learn from the best! This table showcases top-performing Airbnb hosts in Bernalda based on the number of properties managed and estimated total revenue over the past year. Analyze their scale and performance metrics.
| Host Name | Properties | Grossing Revenue | Stay Reviews | Avg Rating |
|---|---|---|---|---|
| Anna | 1 | $30,389 | 4 | 5.00/5.0 |
| Ornella | 2 | $15,498 | 12 | 5.00/5.0 |
| Grazia | 1 | $13,572 | 3 | 4.67/5.0 |
| Filippo | 1 | $10,615 | 7 | 4.86/5.0 |
| Stefania | 2 | $8,268 | 3 | 2.33/5.0 |
| Gianluca | 1 | $7,668 | 25 | 5.00/5.0 |
| Anna | 1 | $6,116 | 3 | 4.33/5.0 |
| Antonietta | 1 | $5,826 | 16 | 4.63/5.0 |
| Michele | 1 | $4,014 | 8 | 4.13/5.0 |
| Mimmo | 1 | $3,976 | 6 | 4.83/5.0 |
Analyzing the strategies of top hosts, such as their property selection, pricing, and guest communication, can offer valuable lessons for optimizing your own Airbnb operations in Bernalda.
Dive Deeper: Advanced Bernalda STR Market Data (2025)
Ready to unlock more insights? AirROI provides access to advanced metrics and comprehensive Airbnb data for Bernalda. Explore detailed analytics beyond this report to refine your investment strategy, optimize pricing, and maximize your vacation rental profits.
Explore Advanced MetricsBernalda Short-Term Rental Market Composition (2025): Property & Room Types
Room Type Distribution
Property Type Distribution
Market Composition Insights for Bernalda
- The Bernalda Airbnb market composition is heavily skewed towards Entire Home/Apt listings, which make up 100% of the 25 active rentals. This indicates strong guest preference for privacy and space.
- Looking at the property type distribution in Bernalda, House properties are the most common (56%), reflecting the local real estate landscape.
- Houses represent a significant 56% portion, catering likely to families or larger groups.
- Smaller segments like others (combined 4.0%) offer potential for unique stay experiences.
Bernalda Airbnb Room Capacity Analysis (2025): Bedroom Distribution
Distribution of Listings by Number of Bedrooms
Room Capacity Insights for Bernalda
- The dominant room capacity in Bernalda is 2 bedrooms listings, making up 44% of the market. This suggests a strong demand for properties suitable for couples or solo travelers.
- Together, 2 bedrooms and 1 bedroom properties represent 84.0% of the active Airbnb listings in Bernalda, indicating a high concentration in these sizes.
- Listings with 3+ bedrooms (8.0%) represent a smaller niche, potentially indicating an underserved market for larger group accommodations in Bernalda.
Bernalda Vacation Rental Guest Capacity Trends (2025)
Distribution of Listings by Guest Capacity
Guest Capacity Insights for Bernalda
- The most common guest capacity trend in Bernalda vacation rentals is listings accommodating 4 guests (44%). This suggests the primary traveler segment is likely small families or groups.
- Properties designed for 4 guests and 5 guests dominate the Bernalda STR market, accounting for 64.0% of listings.
- 20.0% of properties accommodate 6+ guests, serving the market segment for larger families or group travel in Bernalda.
- On average, properties in Bernalda are equipped to host 4.5 guests.
Bernalda Airbnb Booking Patterns (2025): Available vs. Booked Days
Available Days Distribution
Booked Days Distribution
Booking Pattern Insights for Bernalda
- The most common availability pattern in Bernalda falls within the 271-366 days range, representing 76% of listings. This suggests many properties have significant open periods on their calendars.
- Approximately 100.0% of listings show high availability (181+ days open annually), indicating potential for increased bookings or specific owner usage patterns.
- For booked days, the 1-30 days range is most frequent in Bernalda (52%), reflecting common guest stay durations or potential owner blocking patterns.
Bernalda Airbnb Minimum Stay Requirements Analysis
Distribution of Listings by Minimum Night Requirement
1 Night
4 listings
16.7% of total
2 Nights
10 listings
41.7% of total
3 Nights
2 listings
8.3% of total
4-6 Nights
3 listings
12.5% of total
7-29 Nights
5 listings
20.8% of total
Key Insights
- The most prevalent minimum stay requirement in Bernalda is 2 Nights, adopted by 41.7% of listings. This highlights the market's preference for shorter, flexible bookings.
Recommendations
- Align with the market by considering a 2 Nights minimum stay, as 41.7% of Bernalda hosts use this setting.
- If feasible, allowing 1-night stays, especially midweek or during low season, could capture last-minute bookings, as only 16.7% currently do.
- A 2-night minimum appears standard (41.7%). Consider this for weekends or peak periods.
- Adjust minimum nights based on seasonality – potentially shorter during low season and longer during peak demand periods in Bernalda.
Bernalda Airbnb Cancellation Policy Trends Analysis (2025)
Flexible
8 listings
38.1% of total
Moderate
11 listings
52.4% of total
Strict
2 listings
9.5% of total
Cancellation Policy Insights for Bernalda
- The prevailing Airbnb cancellation policy trend in Bernalda is Moderate, used by 52.4% of listings.
- The market strongly favors guest-friendly terms, with 90.5% of listings offering Flexible or Moderate policies. This suggests guests in Bernalda may expect booking flexibility.
- Strict cancellation policies are quite rare (9.5%), potentially making listings with this policy less competitive unless justified by high demand or property type.
Recommendations for Hosts
- Consider adopting a Moderate policy to align with the 52.4% market standard in Bernalda.
- Using a Strict policy might deter some guests, as only 9.5% of listings use it. Evaluate if potential revenue protection outweighs possible lower booking rates.
- Regularly review your cancellation policy against competitors and market demand shifts in Bernalda.
Bernalda STR Booking Lead Time Analysis (2025)
Average Booking Lead Time by Month
Booking Lead Time Insights for Bernalda
- The overall average booking lead time for vacation rentals in Bernalda is 42 days.
- Guests book furthest in advance for stays during October (average 102 days), likely coinciding with peak travel demand or local events.
- The shortest booking windows occur for stays in November (average 0 days), indicating more last-minute travel plans during this time.
- Seasonally, Spring (58 days avg.) sees the longest lead times, while Winter (16 days avg.) has the shortest, reflecting typical travel planning cycles.
Recommendations for Hosts
- Use the overall average lead time (42 days) as a baseline for your pricing and availability strategy in Bernalda.
- For October stays, consider implementing length-of-stay discounts or slightly higher rates for bookings made less than 102 days out to capitalize on advance planning.
- During November, focus on last-minute booking availability and promotions, as guests book with very short notice (0 days avg.).
- Target marketing efforts for the Spring season well in advance (at least 58 days) to capture early planners.
- Monitor your own booking lead times against these Bernalda averages to identify opportunities for dynamic pricing adjustments.
Popular & Essential Airbnb Amenities in Bernalda (2025)
Amenity Prevalence
Amenity Insights for Bernalda
- Essential amenities in Bernalda that guests expect include: Kitchen, Hot water. Lacking these (any) could significantly impact bookings.
- Popular amenities like Air conditioning, TV, Heating are common but not universal. Offering these can provide a competitive edge.
Recommendations for Hosts
- Ensure your listing includes all essential amenities for Bernalda: Kitchen, Hot water.
- Prioritize adding missing essentials: Hot water.
- Consider adding popular differentiators like Air conditioning or TV to increase appeal.
- Highlight unique or less common amenities you offer (e.g., hot tub, dedicated workspace, EV charger) in your listing description and photos.
- Regularly check competitor amenities in Bernalda to stay competitive.
Bernalda Airbnb Guest Demographics & Profile Analysis (2025)
Guest Profile Summary for Bernalda
- The typical guest profile for Airbnb in Bernalda consists of a mix of domestic (56%) and international guests, often arriving from nearby Florence, typically belonging to the Post-2000s (Gen Z/Alpha) group (50%), primarily speaking English or Italian.
- Domestic travelers account for 55.6% of guests.
- Key international markets include Italy (55.6%) and United States (11.1%).
- Top languages spoken are English (37.1%) followed by Italian (25.7%).
- A significant demographic segment is the Post-2000s (Gen Z/Alpha) group, representing 50% of guests.
Recommendations for Hosts
- Balance marketing efforts between domestic and international channels based on the guest mix.
- Tailor amenities and listing descriptions to appeal to the dominant Post-2000s (Gen Z/Alpha) demographic (e.g., highlight fast WiFi, smart home features, local guides).
- Highlight unique local experiences or amenities relevant to the primary guest profile.
- Consider seasonal promotions aligned with peak travel times for key origin markets.
Nearby Short-Term Rental Market Comparison
How does the Bernalda Airbnb market stack up against its neighbors? Compare key performance metrics like average monthly revenue, ADR, and occupancy rates in surrounding areas to understand the broader regional STR landscape.
| Market | Active Properties | Monthly Revenue | Daily Rate | Avg. Occupancy |
|---|---|---|---|---|
| San Michele Salentino | 74 | $2,208 | $260.22 | 44% |
| Polignano a Mare | 624 | $1,978 | $205.82 | 44% |
| Castellana Grotte | 185 | $1,845 | $219.26 | 43% |
| Torchiara | 21 | $1,737 | $280.56 | 26% |
| Ostuni | 1,576 | $1,730 | $250.45 | 39% |
| Ceglie Messapica | 380 | $1,660 | $223.98 | 41% |
| Martina Franca | 569 | $1,657 | $217.67 | 39% |
| Monopoli | 1,141 | $1,637 | $195.75 | 43% |
| Carovigno | 514 | $1,628 | $260.62 | 40% |
| Alberobello | 280 | $1,607 | $189.82 | 38% |