Veglie Airbnb Market Analysis 2025: Short Term Rental Data & Vacation Rental Statistics in Apulia, Italy
Is Airbnb profitable in Veglie in 2025? Explore comprehensive Airbnb analytics for Veglie, Apulia, Italy to uncover income potential. This 2025 STR market report for Veglie, based on AirROI data from April 2024 to March 2025, reveals key trends in the niche market of 37 active listings.
Whether you're considering an Airbnb investment in Veglie, optimizing your existing vacation rental, or exploring rental arbitrage opportunities, understanding the Veglie Airbnb data is crucial. Understanding the local regulations is key to maximizing your short term rental income potential. Let's dive into the specifics.
Key Veglie Airbnb Performance Metrics Overview
Monthly Airbnb Revenue Variations & Income Potential in Veglie (2025)
Understanding the monthly revenue variations for Airbnb listings in Veglie is key to maximizing your short term rental income potential. Seasonality significantly impacts earnings. Our analysis, based on data from the past 12 months, shows that the peak revenue month for STRs in Veglie is typically July, while January often presents the lowest earnings, highlighting opportunities for strategic pricing adjustments during shoulder and low seasons. Explore the typical Airbnb income in Veglie across different performance tiers:
- Best-in-class properties (Top 10%) achieve $2,503+ monthly, often utilizing dynamic pricing and superior guest experiences.
- Strong performing properties (Top 25%) earn $1,383 or more, indicating effective management and desirable locations/amenities.
- Typical properties (Median) generate around $461 per month, representing the average market performance.
- Entry-level properties (Bottom 25%) see earnings around $231, often with potential for optimization.
Average Monthly Airbnb Earnings Trend in Veglie
Veglie Airbnb Occupancy Rate Trends (2025)
Maximize your bookings by understanding the Veglie STR occupancy trends. Seasonal demand shifts significantly influence how often properties are booked. Typically, Augustsees the highest demand (peak season occupancy), while February experiences the lowest (low season). Effective strategies, like adjusting minimum stays or offering promotions, can boost occupancy during slower periods. Here's how different property tiers perform in Veglie:
- Best-in-class properties (Top 10%) achieve 46%+ occupancy, indicating high desirability and potentially optimized availability.
- Strong performing properties (Top 25%) maintain 32% or higher occupancy, suggesting good market fit and guest satisfaction.
- Typical properties (Median) have an occupancy rate around 18%.
- Entry-level properties (Bottom 25%) average 11% occupancy, potentially facing higher vacancy.
Average Monthly Occupancy Rate Trend in Veglie
Average Daily Rate (ADR) Airbnb Trends in Veglie (2025)
Effective short term rental pricing strategy in Veglie involves understanding monthly ADR fluctuations. The Average Daily Rate (ADR) for Airbnb in Veglie typically peaks in December and dips lowest during April. Leveraging Airbnb dynamic pricing tools or strategies based on this seasonality can significantly boost revenue. Here's a look at the typical nightly rates achieved:
- Best-in-class properties (Top 10%) command rates of $209+ per night, often due to premium features or locations.
- Strong performing properties (Top 25%) achieve nightly rates of $118 or more.
- Typical properties (Median) charge around $80 per night.
- Entry-level properties (Bottom 25%) earn around $63 per night.
Average Daily Rate (ADR) Trend by Month in Veglie
Get Live Veglie Market Intelligence 👇

Explore Real-time Analytics
Airbnb Seasonality Analysis & Trends in Veglie (2025)
Peak Season (July, August, June)
- Revenue averages $2,101 per month
- Occupancy rates average 39.1%
- Daily rates average $123
Shoulder Season
- Revenue averages $1,003 per month
- Occupancy maintains around 23.0%
- Daily rates hold near $123
Low Season (January, February, March)
- Revenue drops to average $230 per month
- Occupancy decreases to average 8.1%
- Daily rates adjust to average $142
Seasonality Insights for Veglie
- The Airbnb seasonality in Veglie shows highly seasonal trends requiring careful strategy. While the sections above show seasonal averages, it's also insightful to look at the extremes:
- During the high season, the absolute peak month showcases Veglie's highest earning potential, with monthly revenues capable of climbing to $2,732, occupancy reaching a high of 52.9%, and ADRs peaking at $147.
- Conversely, the slowest single month of the year, typically falling within the low season, marks the market's lowest point. In this month, revenue might dip to $166, occupancy could drop to 6.0%, and ADRs may adjust down to $111.
- Understanding both the seasonal averages and these monthly peaks and troughs in revenue, occupancy, and ADR is crucial for maximizing your Airbnb profit potential in Veglie.
Seasonal Strategies for Maximizing Profit
- Peak Season: Maximize revenue through premium pricing and potentially longer minimum stays. Ensure high availability.
- Low Season: Offer competitive pricing, special promotions (e.g., extended stay discounts), and flexible cancellation policies. Target off-season travelers like remote workers or budget-conscious guests.
- Shoulder Seasons: Implement dynamic pricing that balances peak and low rates. Target weekend travelers or specific events. Offer slightly more flexible terms than peak season.
- Regularly analyze your own performance against these Veglie seasonality benchmarks and adjust your pricing and availability strategy accordingly.
Best Areas for Airbnb Investment in Veglie (2025)
Exploring the top neighborhoods for short-term rentals in Veglie? This section highlights key areas, outlining why they are attractive for hosts and guests, along with notable local attractions. Consider these locations based on your target guest profile and investment strategy.
| Neighborhood / Area | Why Host Here? (Target Guests & Appeal) | Key Attractions & Landmarks |
|---|---|---|
| Centro Storico | The historic center of Veglie with its charming architecture and local culture. Great for visitors looking to experience the authentic Italian lifestyle. | Church of Santa Maria delle Grazie, Piazza Leone, Local markets, Traditional trattorias, Cultural festivals |
| Parco Comunale | A lovely park area perfect for relaxation and outdoor activities. Ideal for guests looking for a serene environment close to nature. | Walking trails, Playgrounds, Picnic areas, Green spaces, Local wildlife |
| Via Roma | A bustling street that serves as the main thoroughfare with shops, cafes, and restaurants. Attracts both tourists and locals alike. | Shopping boutiques, Cafes and eateries, Cultural events, Street performers, Local artisan shops |
| Surrounding Vineyards | The beautiful vineyards surrounding Veglie offer wine tourism opportunities, attracting visitors who enjoy wine tasting and scenic views. | Winery tours, Wine tasting events, Scenic countryside, Local wine festivals, Traditional Apulian cuisine |
| Salice Salentino | A nearby town known for its historic buildings and wine production. It's a popular spot for tourists exploring the Apulia region. | Historic churches, Wine cellars, Cultural heritage sites, Local wineries, Traditional festivals |
| Leverano | Close to Veglie, Leverano features a charming old town and is known for its local products. It offers a taste of authentic Apulia. | Historic center attractions, Local markets, Apulian cuisine, Traditional workshops, Festivals |
| Porto Cesareo | Only a short drive away, this coastal town has stunning beaches and attracts beach lovers and families looking for a seaside getaway. | Beautiful beaches, Marine reserves, Water sports, Restaurants by the sea, Fishermen's markets |
| Torre Lapillo | Famous for its crystal clear waters and sandy beaches, ideal for tourists looking for a beach escape with plenty of water activities. | Stunning beaches, Beach clubs, Scuba diving spots, Fishing opportunities, Local seafood restaurants |
Understanding Airbnb License Requirements & STR Laws in Veglie (2025)
With 16% of listings showing registration in 2025, understanding potential Airbnb license requirements is crucial in Veglie. Always verify the latest short term rental regulations and Airbnb license requirements directly with local government authorities for Veglie to ensure full compliance before hosting.
(Source: AirROI data, 2025, based on 16% licensed listings)
Top Performing Airbnb Properties in Veglie (2025)
Benchmark your potential! Explore examples of top-performing Airbnb properties in Vegliebased on Trailing Twelve Month (TTM) revenue. Analyze their characteristics, revenue, occupancy rate, and ADR to understand what drives success in this market.

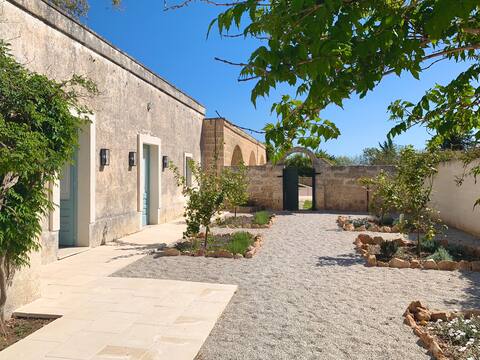
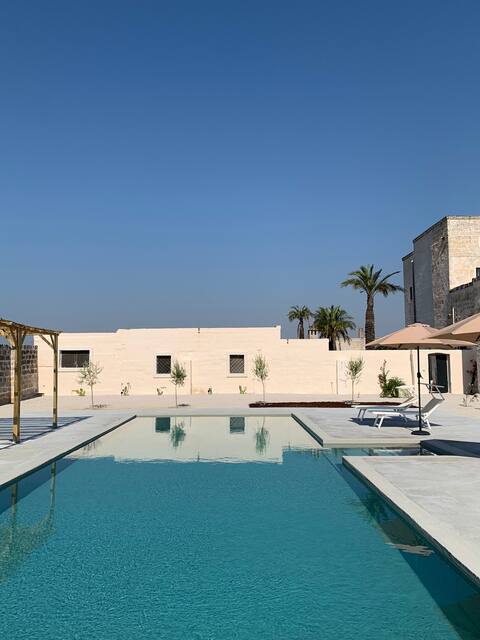
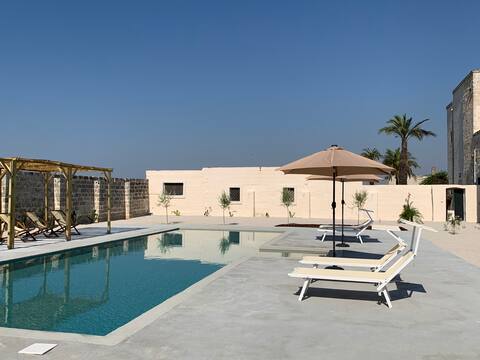
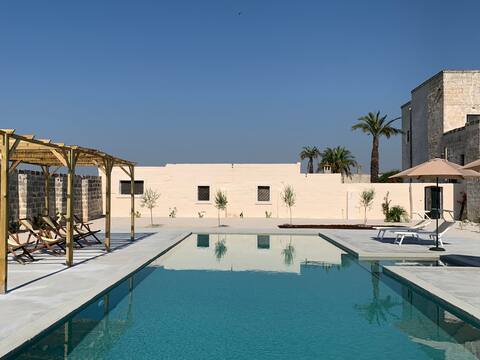
Charming Masseria La Noa with pool, beach 10 min.
Entire Place • 6 bedrooms
La Limonaia
Entire Place • 3 bedrooms
Charming Apt.(N1) in trendy Salento
Entire Place • 2 bedrooms
Charming Apt(2) in trendy Salento
Entire Place • 1 bedroom

Charming flat (3) in Masseria in trendy Salento
Entire Place • 2 bedrooms
Charming Apt.(N4) in trendy Salento
Private Room • 1 bedroom
Note: Performance varies based on location, size, amenities, seasonality, and management quality. Data reflects the past 12 months.
Top Performing Airbnb Hosts in Veglie (2025)
Learn from the best! This table showcases top-performing Airbnb hosts in Veglie based on the number of properties managed and estimated total revenue over the past year. Analyze their scale and performance metrics.
| Host Name | Properties | Grossing Revenue | Stay Reviews | Avg Rating |
|---|---|---|---|---|
| Sophie | 6 | $169,151 | 115 | 4.85/5.0 |
| Barbarhouse SRL | 6 | $27,031 | 13 | 2.28/5.0 |
| Valeriana | 1 | $6,627 | 51 | 4.94/5.0 |
| Catia HomeSweetHome | 1 | $6,550 | 31 | 4.81/5.0 |
| Clelia Patrizia | 1 | $3,617 | 27 | 4.63/5.0 |
| Melo | 3 | $3,421 | 11 | 4.78/5.0 |
| Valentina | 1 | $3,162 | 10 | 4.70/5.0 |
| Host #364319000 | 1 | $3,106 | 0 | 0.00/5.0 |
| Host #108951352 | 1 | $2,407 | 0 | 0.00/5.0 |
| Host #468297890 | 2 | $2,301 | 0 | 0.00/5.0 |
Analyzing the strategies of top hosts, such as their property selection, pricing, and guest communication, can offer valuable lessons for optimizing your own Airbnb operations in Veglie.
Dive Deeper: Advanced Veglie STR Market Data (2025)
Ready to unlock more insights? AirROI provides access to advanced metrics and comprehensive Airbnb data for Veglie. Explore detailed analytics beyond this report to refine your investment strategy, optimize pricing, and maximize your vacation rental profits.
Explore Advanced MetricsVeglie Short-Term Rental Market Composition (2025): Property & Room Types
Room Type Distribution
Property Type Distribution
Market Composition Insights for Veglie
- The Veglie Airbnb market composition is heavily skewed towards Entire Home/Apt listings, which make up 73% of the 37 active rentals. This indicates strong guest preference for privacy and space.
- Looking at the property type distribution in Veglie, Apartment/Condo properties are the most common (51.4%), reflecting the local real estate landscape.
- Houses represent a significant 32.4% portion, catering likely to families or larger groups.
- The presence of 16.2% Hotel/Boutique listings indicates integration with traditional hospitality.
Veglie Airbnb Room Capacity Analysis (2025): Bedroom Distribution
Distribution of Listings by Number of Bedrooms
Room Capacity Insights for Veglie
- The dominant room capacity in Veglie is 1 bedroom listings, making up 37.8% of the market. This suggests a strong demand for properties suitable for couples or solo travelers.
- Together, 1 bedroom and 2 bedrooms properties represent 62.1% of the active Airbnb listings in Veglie, indicating a high concentration in these sizes.
Veglie Vacation Rental Guest Capacity Trends (2025)
Distribution of Listings by Guest Capacity
Guest Capacity Insights for Veglie
- The most common guest capacity trend in Veglie vacation rentals is listings accommodating 4 guests (29.7%). This suggests the primary traveler segment is likely small families or groups.
- Properties designed for 4 guests and 3 guests dominate the Veglie STR market, accounting for 45.9% of listings.
- 13.5% of properties accommodate 6+ guests, serving the market segment for larger families or group travel in Veglie.
- On average, properties in Veglie are equipped to host 3.5 guests.
Veglie Airbnb Booking Patterns (2025): Available vs. Booked Days
Available Days Distribution
Booked Days Distribution
Booking Pattern Insights for Veglie
- The most common availability pattern in Veglie falls within the 271-366 days range, representing 89.2% of listings. This suggests many properties have significant open periods on their calendars.
- Approximately 100.0% of listings show high availability (181+ days open annually), indicating potential for increased bookings or specific owner usage patterns.
- For booked days, the 1-30 days range is most frequent in Veglie (59.5%), reflecting common guest stay durations or potential owner blocking patterns.
Veglie Airbnb Minimum Stay Requirements Analysis
Distribution of Listings by Minimum Night Requirement
1 Night
5 listings
13.5% of total
2 Nights
8 listings
21.6% of total
3 Nights
7 listings
18.9% of total
4-6 Nights
6 listings
16.2% of total
7-29 Nights
7 listings
18.9% of total
30+ Nights
4 listings
10.8% of total
Key Insights
- The most prevalent minimum stay requirement in Veglie is 2 Nights, adopted by 21.6% of listings. This highlights the market's preference for shorter, flexible bookings.
- A significant segment (10.8%) caters to monthly stays (30+ nights) in Veglie, pointing to opportunities in the extended-stay market.
Recommendations
- Align with the market by considering a 2 Nights minimum stay, as 21.6% of Veglie hosts use this setting.
- If feasible, allowing 1-night stays, especially midweek or during low season, could capture last-minute bookings, as only 13.5% currently do.
- Explore offering discounts for stays of 30+ nights to attract the 10.8% of the market seeking extended stays.
- Adjust minimum nights based on seasonality – potentially shorter during low season and longer during peak demand periods in Veglie.
Veglie Airbnb Cancellation Policy Trends Analysis (2025)
Flexible
6 listings
25% of total
Moderate
4 listings
16.7% of total
Strict
14 listings
58.3% of total
Cancellation Policy Insights for Veglie
- The prevailing Airbnb cancellation policy trend in Veglie is Strict, used by 58.3% of listings.
- A majority (58.3%) of hosts in Veglie utilize Firm or Strict policies, indicating a market where hosts prioritize booking security.
Recommendations for Hosts
- Consider adopting a Strict policy to align with the 58.3% market standard in Veglie.
- With 58.3% using Strict terms, this is a viable option in Veglie, particularly for high-value properties or during peak demand periods.
- Regularly review your cancellation policy against competitors and market demand shifts in Veglie.
Veglie STR Booking Lead Time Analysis (2025)
Average Booking Lead Time by Month
Booking Lead Time Insights for Veglie
- The overall average booking lead time for vacation rentals in Veglie is 55 days.
- Guests book furthest in advance for stays during July (average 107 days), likely coinciding with peak travel demand or local events.
- The shortest booking windows occur for stays in February (average 5 days), indicating more last-minute travel plans during this time.
- Seasonally, Summer (84 days avg.) sees the longest lead times, while Winter (34 days avg.) has the shortest, reflecting typical travel planning cycles.
Recommendations for Hosts
- Use the overall average lead time (55 days) as a baseline for your pricing and availability strategy in Veglie.
- For July stays, consider implementing length-of-stay discounts or slightly higher rates for bookings made less than 107 days out to capitalize on advance planning.
- During February, focus on last-minute booking availability and promotions, as guests book with very short notice (5 days avg.).
- Target marketing efforts for the Summer season well in advance (at least 84 days) to capture early planners.
- Monitor your own booking lead times against these Veglie averages to identify opportunities for dynamic pricing adjustments.
Popular & Essential Airbnb Amenities in Veglie (2025)
Amenity Prevalence
Amenity Insights for Veglie
- Popular amenities like Essentials, Hot water, Air conditioning are common but not universal. Offering these can provide a competitive edge.
- Warning: Wifi is not universally provided but is considered essential globally. Ensure reliable Wifi is offered.
Recommendations for Hosts
- Consider adding popular differentiators like Essentials or Hot water to increase appeal.
- Highlight unique or less common amenities you offer (e.g., hot tub, dedicated workspace, EV charger) in your listing description and photos.
- Regularly check competitor amenities in Veglie to stay competitive.
Veglie Airbnb Guest Demographics & Profile Analysis (2025)
Guest Profile Summary for Veglie
- The typical guest profile for Airbnb in Veglie consists of a mix of domestic (42%) and international guests, with top international origins including France, typically belonging to the Post-2000s (Gen Z/Alpha) group (50%), primarily speaking English or Italian.
- Domestic travelers account for 41.5% of guests.
- Key international markets include Italy (41.5%) and France (22.6%).
- Top languages spoken are English (35.4%) followed by Italian (25.3%).
- A significant demographic segment is the Post-2000s (Gen Z/Alpha) group, representing 50% of guests.
Recommendations for Hosts
- Balance marketing efforts between domestic and international channels based on the guest mix.
- Tailor amenities and listing descriptions to appeal to the dominant Post-2000s (Gen Z/Alpha) demographic (e.g., highlight fast WiFi, smart home features, local guides).
- Highlight unique local experiences or amenities relevant to the primary guest profile.
- Consider seasonal promotions aligned with peak travel times for key origin markets.
Nearby Short-Term Rental Market Comparison
How does the Veglie Airbnb market stack up against its neighbors? Compare key performance metrics like average monthly revenue, ADR, and occupancy rates in surrounding areas to understand the broader regional STR landscape.
| Market | Active Properties | Monthly Revenue | Daily Rate | Avg. Occupancy |
|---|---|---|---|---|
| San Michele Salentino | 74 | $2,208 | $260.22 | 44% |
| Polignano a Mare | 624 | $1,978 | $205.82 | 44% |
| Castellana Grotte | 185 | $1,845 | $219.26 | 43% |
| Ostuni | 1,576 | $1,730 | $250.45 | 39% |
| Ceglie Messapica | 380 | $1,660 | $223.98 | 41% |
| Martina Franca | 569 | $1,657 | $217.67 | 39% |
| Monopoli | 1,141 | $1,637 | $195.75 | 43% |
| Carovigno | 514 | $1,628 | $260.62 | 40% |
| Alberobello | 280 | $1,607 | $189.82 | 38% |
| San Vito dei Normanni | 168 | $1,604 | $219.74 | 43% |