Tuglie Airbnb Market Analysis 2025: Short Term Rental Data & Vacation Rental Statistics in Apulia, Italy
Is Airbnb profitable in Tuglie in 2025? Explore comprehensive Airbnb analytics for Tuglie, Apulia, Italy to uncover income potential. This 2025 STR market report for Tuglie, based on AirROI data from April 2024 to March 2025, reveals key trends in the niche market of 75 active listings.
Whether you're considering an Airbnb investment in Tuglie, optimizing your existing vacation rental, or exploring rental arbitrage opportunities, understanding the Tuglie Airbnb data is crucial. Navigating the high regulation landscape is key to maximizing your short term rental income potential. Let's dive into the specifics.
Key Tuglie Airbnb Performance Metrics Overview
Monthly Airbnb Revenue Variations & Income Potential in Tuglie (2025)
Understanding the monthly revenue variations for Airbnb listings in Tuglie is key to maximizing your short term rental income potential. Seasonality significantly impacts earnings. Our analysis, based on data from the past 12 months, shows that the peak revenue month for STRs in Tuglie is typically August, while November often presents the lowest earnings, highlighting opportunities for strategic pricing adjustments during shoulder and low seasons. Explore the typical Airbnb income in Tuglie across different performance tiers:
- Best-in-class properties (Top 10%) achieve $2,315+ monthly, often utilizing dynamic pricing and superior guest experiences.
- Strong performing properties (Top 25%) earn $1,252 or more, indicating effective management and desirable locations/amenities.
- Typical properties (Median) generate around $675 per month, representing the average market performance.
- Entry-level properties (Bottom 25%) see earnings around $308, often with potential for optimization.
Average Monthly Airbnb Earnings Trend in Tuglie
Tuglie Airbnb Occupancy Rate Trends (2025)
Maximize your bookings by understanding the Tuglie STR occupancy trends. Seasonal demand shifts significantly influence how often properties are booked. Typically, Augustsees the highest demand (peak season occupancy), while March experiences the lowest (low season). Effective strategies, like adjusting minimum stays or offering promotions, can boost occupancy during slower periods. Here's how different property tiers perform in Tuglie:
- Best-in-class properties (Top 10%) achieve 64%+ occupancy, indicating high desirability and potentially optimized availability.
- Strong performing properties (Top 25%) maintain 43% or higher occupancy, suggesting good market fit and guest satisfaction.
- Typical properties (Median) have an occupancy rate around 21%.
- Entry-level properties (Bottom 25%) average 12% occupancy, potentially facing higher vacancy.
Average Monthly Occupancy Rate Trend in Tuglie
Average Daily Rate (ADR) Airbnb Trends in Tuglie (2025)
Effective short term rental pricing strategy in Tuglie involves understanding monthly ADR fluctuations. The Average Daily Rate (ADR) for Airbnb in Tuglie typically peaks in August and dips lowest during April. Leveraging Airbnb dynamic pricing tools or strategies based on this seasonality can significantly boost revenue. Here's a look at the typical nightly rates achieved:
- Best-in-class properties (Top 10%) command rates of $235+ per night, often due to premium features or locations.
- Strong performing properties (Top 25%) achieve nightly rates of $145 or more.
- Typical properties (Median) charge around $82 per night.
- Entry-level properties (Bottom 25%) earn around $57 per night.
Average Daily Rate (ADR) Trend by Month in Tuglie
Get Live Tuglie Market Intelligence 👇

Explore Real-time Analytics
Airbnb Seasonality Analysis & Trends in Tuglie (2025)
Peak Season (August, July, October)
- Revenue averages $1,897 per month
- Occupancy rates average 41.4%
- Daily rates average $128
Shoulder Season
- Revenue averages $813 per month
- Occupancy maintains around 28.0%
- Daily rates hold near $122
Low Season (March, November, December)
- Revenue drops to average $466 per month
- Occupancy decreases to average 20.5%
- Daily rates adjust to average $129
Seasonality Insights for Tuglie
- The Airbnb seasonality in Tuglie shows highly seasonal trends requiring careful strategy. While the sections above show seasonal averages, it's also insightful to look at the extremes:
- During the high season, the absolute peak month showcases Tuglie's highest earning potential, with monthly revenues capable of climbing to $2,147, occupancy reaching a high of 50.4%, and ADRs peaking at $134.
- Conversely, the slowest single month of the year, typically falling within the low season, marks the market's lowest point. In this month, revenue might dip to $385, occupancy could drop to 18.5%, and ADRs may adjust down to $112.
- Understanding both the seasonal averages and these monthly peaks and troughs in revenue, occupancy, and ADR is crucial for maximizing your Airbnb profit potential in Tuglie.
Seasonal Strategies for Maximizing Profit
- Peak Season: Maximize revenue through premium pricing and potentially longer minimum stays. Ensure high availability.
- Low Season: Offer competitive pricing, special promotions (e.g., extended stay discounts), and flexible cancellation policies. Target off-season travelers like remote workers or budget-conscious guests.
- Shoulder Seasons: Implement dynamic pricing that balances peak and low rates. Target weekend travelers or specific events. Offer slightly more flexible terms than peak season.
- Regularly analyze your own performance against these Tuglie seasonality benchmarks and adjust your pricing and availability strategy accordingly.
Best Areas for Airbnb Investment in Tuglie (2025)
Exploring the top neighborhoods for short-term rentals in Tuglie? This section highlights key areas, outlining why they are attractive for hosts and guests, along with notable local attractions. Consider these locations based on your target guest profile and investment strategy.
| Neighborhood / Area | Why Host Here? (Target Guests & Appeal) | Key Attractions & Landmarks |
|---|---|---|
| Centro Storico | The historic center of Tuglie, offering charming streets, ancient architecture, and a glimpse into local culture. A great location for tourists looking to experience authentic Apulia. | Church of San Giovanni Battista, Tuglie's Historical Museum, Local artisan shops, Piazza Cavour, Nearby beaches of Gallipoli |
| Gallipoli | A famous coastal town near Tuglie, known for its stunning beaches and vibrant nightlife. Ideal for tourists who love sun, sea, and vibrant summer activities. | Gallipoli Beach, Castello di Gallipoli, Historic center of Gallipoli, Dine in beachfront restaurants, Nightclubs and bars along the coast |
| Santa Maria al Bagno | A lovely seaside resort area known for its clear waters and family-friendly atmosphere. Attracts families and beachgoers looking for relaxation. | Beaches of Santa Maria al Bagno, Natural Park of Porto Selvaggio, Beach clubs and cafes, Local seafood restaurants, Scenic coastal walks |
| Sannicandro di Bari | A picturesque town not far from Tuglie, offering a blend of history and nature. Popular with visitors seeking tranquility and exploration of Apulian countryside. | Ancient ruins, Countryside trails, Local vineyards, Traditional festivals, Charming town square |
| Lecce | Known as the 'Florence of the South', Lecce is famous for its baroque architecture and vibrant cultural scene. A must-visit for history and art lovers. | Piazza del Duomo, Basilica di Santa Croce, Roman Amphitheater, Local artisan workshops, Vibrant nightlife |
| Otranto | A historically rich town known for its coastal beauty and medieval castle. Ideal for travelers interested in history, culture, and stunning seaside views. | Otranto Castle, Cathedral of Otranto, Beaches and seaside bars, Scenic harbor, Ancient Olive trees |
| Porto Cesareo | Known for its beautiful beaches and vibrant marine life, it attracts visitors looking for water sports and relaxation by the sea. | Porto Cesareo beaches, Natural marine park, Water sports activities, Lively seafood markets, Restaurants with ocean views |
| Marina di Ugento | A popular coastal area with beautiful sandy beaches and family-friendly resorts. Great for hosting tourists during the summer season. | Sandy beaches, Water activities, Family-friendly resorts, Beachfront dining options, Natural protected areas nearby |
Understanding Airbnb License Requirements & STR Laws in Tuglie (2025)
Yes, Tuglie, Apulia, Italy enforces high STR regulations. Obtaining a license and ensuring compliance is almost certainly required according to current 2025 STR laws. Always verify the latest short term rental regulations and Airbnb license requirements directly with local government authorities for Tuglie to ensure full compliance before hosting.
(Source: AirROI data, 2025, based on 44% licensed listings)
Top Performing Airbnb Properties in Tuglie (2025)
Benchmark your potential! Explore examples of top-performing Airbnb properties in Tugliebased on Trailing Twelve Month (TTM) revenue. Analyze their characteristics, revenue, occupancy rate, and ADR to understand what drives success in this market.
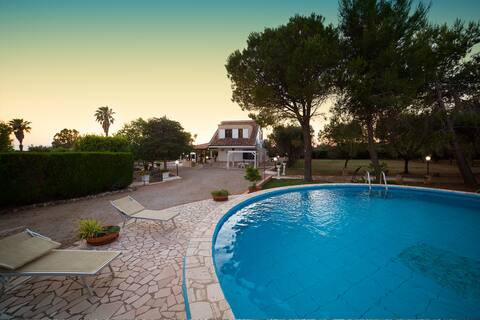
Villa dei Sogni Gallipoli
Entire Place • 4 bedrooms

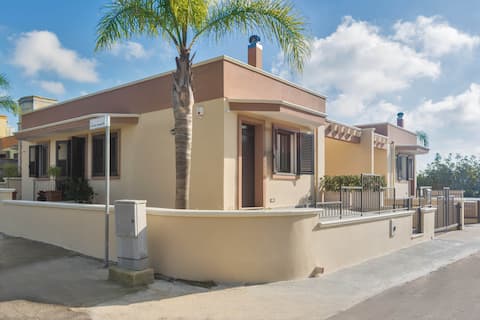
Magic of Salento in the woods with pool and tennis
Entire Place • 4 bedrooms
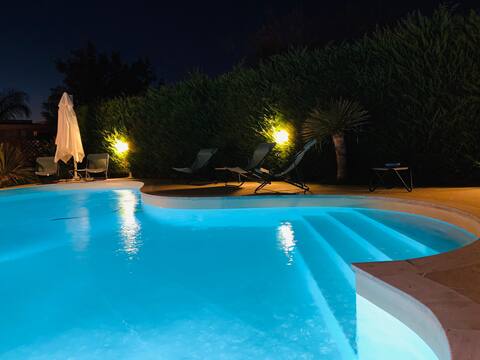
6p.l 3 bedrooms 2 bathrooms, parking garage, wifi, air conditioner
Entire Place • 4 bedrooms
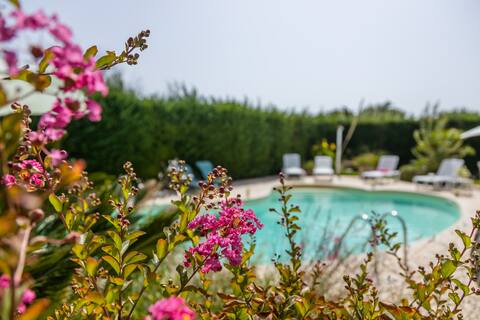
La Collina di Montegrappa - Superior King Suite
Entire Place • 1 bedroom

La Collina di Montegrappa - Family Suite
Entire Place • 1 bedroom
Suite De Luxe with Jacuzzi
Entire Place • 1 bedroom
Note: Performance varies based on location, size, amenities, seasonality, and management quality. Data reflects the past 12 months.
Top Performing Airbnb Hosts in Tuglie (2025)
Learn from the best! This table showcases top-performing Airbnb hosts in Tuglie based on the number of properties managed and estimated total revenue over the past year. Analyze their scale and performance metrics.
| Host Name | Properties | Grossing Revenue | Stay Reviews | Avg Rating |
|---|---|---|---|---|
| Guido | 10 | $121,609 | 98 | 3.36/5.0 |
| Michele | 2 | $39,580 | 46 | 4.78/5.0 |
| Host #72744709 | 1 | $37,120 | 1 | 0.00/5.0 |
| Emilio | 1 | $25,627 | 16 | 4.63/5.0 |
| Alina Viorica | 2 | $21,752 | 130 | 4.97/5.0 |
| Host #522155778 | 3 | $18,065 | 1 | 0.00/5.0 |
| Hotiday | 2 | $14,802 | 6 | 2.42/5.0 |
| Mirco | 2 | $12,262 | 86 | 4.97/5.0 |
| Barbarhouse SRL | 2 | $12,069 | 3 | 2.50/5.0 |
| Francesco | 3 | $11,882 | 115 | 4.84/5.0 |
Analyzing the strategies of top hosts, such as their property selection, pricing, and guest communication, can offer valuable lessons for optimizing your own Airbnb operations in Tuglie.
Dive Deeper: Advanced Tuglie STR Market Data (2025)
Ready to unlock more insights? AirROI provides access to advanced metrics and comprehensive Airbnb data for Tuglie. Explore detailed analytics beyond this report to refine your investment strategy, optimize pricing, and maximize your vacation rental profits.
Explore Advanced MetricsTuglie Short-Term Rental Market Composition (2025): Property & Room Types
Room Type Distribution
Property Type Distribution
Market Composition Insights for Tuglie
- The Tuglie Airbnb market composition is heavily skewed towards Entire Home/Apt listings, which make up 90.7% of the 75 active rentals. This indicates strong guest preference for privacy and space.
- Looking at the property type distribution in Tuglie, House properties are the most common (53.3%), reflecting the local real estate landscape.
- Houses represent a significant 53.3% portion, catering likely to families or larger groups.
- The presence of 12% Hotel/Boutique listings indicates integration with traditional hospitality.
- Smaller segments like unique stays (combined 2.7%) offer potential for unique stay experiences.
Tuglie Airbnb Room Capacity Analysis (2025): Bedroom Distribution
Distribution of Listings by Number of Bedrooms
Room Capacity Insights for Tuglie
- The dominant room capacity in Tuglie is 1 bedroom listings, making up 60% of the market. This suggests a strong demand for properties suitable for couples or solo travelers.
- Together, 1 bedroom and 2 bedrooms properties represent 85.3% of the active Airbnb listings in Tuglie, indicating a high concentration in these sizes.
- With over half the market (60%) consisting of studios or 1-bedroom units, Tuglie is particularly well-suited for individuals or couples.
- Listings with 3+ bedrooms (8.0%) represent a smaller niche, potentially indicating an underserved market for larger group accommodations in Tuglie.
Tuglie Vacation Rental Guest Capacity Trends (2025)
Distribution of Listings by Guest Capacity
Guest Capacity Insights for Tuglie
- The most common guest capacity trend in Tuglie vacation rentals is listings accommodating 4 guests (46.7%). This suggests the primary traveler segment is likely small families or groups.
- Properties designed for 4 guests and 2 guests dominate the Tuglie STR market, accounting for 65.4% of listings.
- 14.6% of properties accommodate 6+ guests, serving the market segment for larger families or group travel in Tuglie.
- On average, properties in Tuglie are equipped to host 3.9 guests.
Tuglie Airbnb Booking Patterns (2025): Available vs. Booked Days
Available Days Distribution
Booked Days Distribution
Booking Pattern Insights for Tuglie
- The most common availability pattern in Tuglie falls within the 271-366 days range, representing 81.3% of listings. This suggests many properties have significant open periods on their calendars.
- Approximately 96.0% of listings show high availability (181+ days open annually), indicating potential for increased bookings or specific owner usage patterns.
- For booked days, the 1-30 days range is most frequent in Tuglie (50.7%), reflecting common guest stay durations or potential owner blocking patterns.
- A notable 4.0% of properties secure long booking periods (181+ days booked per year), highlighting successful long-term rental strategies or significant owner usage.
Tuglie Airbnb Minimum Stay Requirements Analysis
Distribution of Listings by Minimum Night Requirement
1 Night
16 listings
22.9% of total
2 Nights
6 listings
8.6% of total
3 Nights
17 listings
24.3% of total
4-6 Nights
14 listings
20% of total
7-29 Nights
13 listings
18.6% of total
30+ Nights
4 listings
5.7% of total
Key Insights
- The most prevalent minimum stay requirement in Tuglie is 3 Nights, adopted by 24.3% of listings. This highlights the market's preference for longer commitments.
Recommendations
- Align with the market by considering a 3 Nights minimum stay, as 24.3% of Tuglie hosts use this setting.
- If feasible, allowing 1-night stays, especially midweek or during low season, could capture last-minute bookings, as only 22.9% currently do.
- Explore offering discounts for stays of 30+ nights to attract the 5.7% of the market seeking extended stays.
- Adjust minimum nights based on seasonality – potentially shorter during low season and longer during peak demand periods in Tuglie.
Tuglie Airbnb Cancellation Policy Trends Analysis (2025)
Super Strict 30 Days
3 listings
6.5% of total
Flexible
6 listings
13% of total
Moderate
20 listings
43.5% of total
Strict
17 listings
37% of total
Cancellation Policy Insights for Tuglie
- The prevailing Airbnb cancellation policy trend in Tuglie is Moderate, used by 43.5% of listings.
- There's a relatively balanced mix between guest-friendly (56.5%) and stricter (37.0%) policies, offering choices for different guest needs.
Recommendations for Hosts
- Consider adopting a Moderate policy to align with the 43.5% market standard in Tuglie.
- With 37% using Strict terms, this is a viable option in Tuglie, particularly for high-value properties or during peak demand periods.
- Regularly review your cancellation policy against competitors and market demand shifts in Tuglie.
Tuglie STR Booking Lead Time Analysis (2025)
Average Booking Lead Time by Month
Booking Lead Time Insights for Tuglie
- The overall average booking lead time for vacation rentals in Tuglie is 47 days.
- Guests book furthest in advance for stays during October (average 95 days), likely coinciding with peak travel demand or local events.
- The shortest booking windows occur for stays in February (average 27 days), indicating more last-minute travel plans during this time.
- Seasonally, Fall (68 days avg.) sees the longest lead times, while Winter (34 days avg.) has the shortest, reflecting typical travel planning cycles.
Recommendations for Hosts
- Use the overall average lead time (47 days) as a baseline for your pricing and availability strategy in Tuglie.
- For October stays, consider implementing length-of-stay discounts or slightly higher rates for bookings made less than 95 days out to capitalize on advance planning.
- Target marketing efforts for the Fall season well in advance (at least 68 days) to capture early planners.
- Monitor your own booking lead times against these Tuglie averages to identify opportunities for dynamic pricing adjustments.
Popular & Essential Airbnb Amenities in Tuglie (2025)
Amenity Prevalence
Amenity Insights for Tuglie
- Essential amenities in Tuglie that guests expect include: TV. Lacking these (this) could significantly impact bookings.
- Popular amenities like Hot water, Kitchen, Air conditioning are common but not universal. Offering these can provide a competitive edge.
- Warning: Wifi is not universally provided but is considered essential globally. Ensure reliable Wifi is offered.
Recommendations for Hosts
- Ensure your listing includes all essential amenities for Tuglie: TV.
- Prioritize adding missing essentials: TV.
- Consider adding popular differentiators like Hot water or Kitchen to increase appeal.
- Highlight unique or less common amenities you offer (e.g., hot tub, dedicated workspace, EV charger) in your listing description and photos.
- Regularly check competitor amenities in Tuglie to stay competitive.
Tuglie Airbnb Guest Demographics & Profile Analysis (2025)
Guest Profile Summary for Tuglie
- The typical guest profile for Airbnb in Tuglie consists of a mix of domestic (49%) and international guests, with top international origins including France, typically belonging to the Post-2000s (Gen Z/Alpha) group (50%), primarily speaking English or Italian.
- Domestic travelers account for 48.8% of guests.
- Key international markets include Italy (48.8%) and France (17.8%).
- Top languages spoken are English (32.4%) followed by Italian (25.5%).
- A significant demographic segment is the Post-2000s (Gen Z/Alpha) group, representing 50% of guests.
Recommendations for Hosts
- Balance marketing efforts between domestic and international channels based on the guest mix.
- Tailor amenities and listing descriptions to appeal to the dominant Post-2000s (Gen Z/Alpha) demographic (e.g., highlight fast WiFi, smart home features, local guides).
- Highlight unique local experiences or amenities relevant to the primary guest profile.
- Consider seasonal promotions aligned with peak travel times for key origin markets.
Nearby Short-Term Rental Market Comparison
How does the Tuglie Airbnb market stack up against its neighbors? Compare key performance metrics like average monthly revenue, ADR, and occupancy rates in surrounding areas to understand the broader regional STR landscape.
| Market | Active Properties | Monthly Revenue | Daily Rate | Avg. Occupancy |
|---|---|---|---|---|
| Kassopaia Municipal Unit | 520 | $2,555 | $278.54 | 55% |
| Afra | 15 | $2,551 | $306.19 | 54% |
| Agios Markos | 14 | $2,526 | $240.28 | 48% |
| San Michele Salentino | 74 | $2,208 | $260.22 | 44% |
| Spartilas | 27 | $2,202 | $317.90 | 50% |
| Perithia | 54 | $2,092 | $267.76 | 43% |
| Kokkini | 11 | $2,038 | $178.70 | 55% |
| Kira Chrisikou | 41 | $2,034 | $443.23 | 42% |
| Polignano a Mare | 624 | $1,978 | $205.82 | 44% |
| Kamara | 14 | $1,890 | $184.93 | 49% |