Taranto Airbnb Market Analysis 2025: Short Term Rental Data & Vacation Rental Statistics in Apulia, Italy
Is Airbnb profitable in Taranto in 2025? Explore comprehensive Airbnb analytics for Taranto, Apulia, Italy to uncover income potential. This 2025 STR market report for Taranto, based on AirROI data from April 2024 to March 2025, reveals key trends in the market of 329 active listings.
Whether you're considering an Airbnb investment in Taranto, optimizing your existing vacation rental, or exploring rental arbitrage opportunities, understanding the Taranto Airbnb data is crucial. Navigating the high regulation landscape is key to maximizing your short term rental income potential. Let's dive into the specifics.
Key Taranto Airbnb Performance Metrics Overview
Monthly Airbnb Revenue Variations & Income Potential in Taranto (2025)
Understanding the monthly revenue variations for Airbnb listings in Taranto is key to maximizing your short term rental income potential. Seasonality significantly impacts earnings. Our analysis, based on data from the past 12 months, shows that the peak revenue month for STRs in Taranto is typically August, while January often presents the lowest earnings, highlighting opportunities for strategic pricing adjustments during shoulder and low seasons. Explore the typical Airbnb income in Taranto across different performance tiers:
- Best-in-class properties (Top 10%) achieve $2,086+ monthly, often utilizing dynamic pricing and superior guest experiences.
- Strong performing properties (Top 25%) earn $1,311 or more, indicating effective management and desirable locations/amenities.
- Typical properties (Median) generate around $710 per month, representing the average market performance.
- Entry-level properties (Bottom 25%) see earnings around $309, often with potential for optimization.
Average Monthly Airbnb Earnings Trend in Taranto
Taranto Airbnb Occupancy Rate Trends (2025)
Maximize your bookings by understanding the Taranto STR occupancy trends. Seasonal demand shifts significantly influence how often properties are booked. Typically, Augustsees the highest demand (peak season occupancy), while January experiences the lowest (low season). Effective strategies, like adjusting minimum stays or offering promotions, can boost occupancy during slower periods. Here's how different property tiers perform in Taranto:
- Best-in-class properties (Top 10%) achieve 64%+ occupancy, indicating high desirability and potentially optimized availability.
- Strong performing properties (Top 25%) maintain 43% or higher occupancy, suggesting good market fit and guest satisfaction.
- Typical properties (Median) have an occupancy rate around 25%.
- Entry-level properties (Bottom 25%) average 11% occupancy, potentially facing higher vacancy.
Average Monthly Occupancy Rate Trend in Taranto
Average Daily Rate (ADR) Airbnb Trends in Taranto (2025)
Effective short term rental pricing strategy in Taranto involves understanding monthly ADR fluctuations. The Average Daily Rate (ADR) for Airbnb in Taranto typically peaks in August and dips lowest during October. Leveraging Airbnb dynamic pricing tools or strategies based on this seasonality can significantly boost revenue. Here's a look at the typical nightly rates achieved:
- Best-in-class properties (Top 10%) command rates of $151+ per night, often due to premium features or locations.
- Strong performing properties (Top 25%) achieve nightly rates of $102 or more.
- Typical properties (Median) charge around $76 per night.
- Entry-level properties (Bottom 25%) earn around $57 per night.
Average Daily Rate (ADR) Trend by Month in Taranto
Get Live Taranto Market Intelligence 👇

Explore Real-time Analytics
Airbnb Seasonality Analysis & Trends in Taranto (2025)
Peak Season (August, May, July)
- Revenue averages $1,435 per month
- Occupancy rates average 40.1%
- Daily rates average $101
Shoulder Season
- Revenue averages $938 per month
- Occupancy maintains around 28.6%
- Daily rates hold near $97
Low Season (January, February, March)
- Revenue drops to average $599 per month
- Occupancy decreases to average 23.9%
- Daily rates adjust to average $94
Seasonality Insights for Taranto
- The Airbnb seasonality in Taranto shows highly seasonal trends requiring careful strategy. While the sections above show seasonal averages, it's also insightful to look at the extremes:
- During the high season, the absolute peak month showcases Taranto's highest earning potential, with monthly revenues capable of climbing to $1,547, occupancy reaching a high of 45.8%, and ADRs peaking at $106.
- Conversely, the slowest single month of the year, typically falling within the low season, marks the market's lowest point. In this month, revenue might dip to $578, occupancy could drop to 21.0%, and ADRs may adjust down to $93.
- Understanding both the seasonal averages and these monthly peaks and troughs in revenue, occupancy, and ADR is crucial for maximizing your Airbnb profit potential in Taranto.
Seasonal Strategies for Maximizing Profit
- Peak Season: Maximize revenue through premium pricing and potentially longer minimum stays. Ensure high availability.
- Low Season: Offer competitive pricing, special promotions (e.g., extended stay discounts), and flexible cancellation policies. Target off-season travelers like remote workers or budget-conscious guests.
- Shoulder Seasons: Implement dynamic pricing that balances peak and low rates. Target weekend travelers or specific events. Offer slightly more flexible terms than peak season.
- Regularly analyze your own performance against these Taranto seasonality benchmarks and adjust your pricing and availability strategy accordingly.
Best Areas for Airbnb Investment in Taranto (2025)
Exploring the top neighborhoods for short-term rentals in Taranto? This section highlights key areas, outlining why they are attractive for hosts and guests, along with notable local attractions. Consider these locations based on your target guest profile and investment strategy.
| Neighborhood / Area | Why Host Here? (Target Guests & Appeal) | Key Attractions & Landmarks |
|---|---|---|
| Historic Center | The Historic Center of Taranto offers beautiful architecture and a rich cultural heritage, making it attractive for tourists interested in history and art. | Taranto Cathedral, Castello Aragonese, Museo Archeologico Nazionale, Piazza della Vittoria, Cattedrale di San Cataldo |
| Marina di Taranto | A popular seaside district that draws visitors for its beaches and waterfront activities, making it ideal for those seeking sun and relaxation. | Lido Taranto, Marina di Taranto, Spiaggia di San Vito, Fishing Harbour, Restaurants by the Sea |
| Città Vecchia | The Old Town area, known for its narrow streets and historic charm, is perfect for tourists wanting to explore authentic southern Italian life. | Ponte Girevole, Church of San Domenico, Museo diocesano, Via Duomo, Palazzo degli Scolopi |
| Taranto Waterfront | Offers scenic views and a promenade that attracts both locals and tourists, ideal for evening strolls and leisure activities. | Lungomare Vittorio Emanuele, Piazza Ebalia, Isola del Borgo Antico, Historical monuments along the coast |
| Sava | A nearby town famous for its wineries and local cuisine, attracting visitors who are interested in food and wine experiences. | Local wineries, Traditional Apulian cuisine, Historical churches, Cultural festivals |
| Martina Franca | Known for its baroque architecture and festivals, this nearby town attracts visitors interested in culture and arts. | Palazzo Ducale, Basilica di San Martino, Trulli houses, Concerts and festivals |
| Mottola | A town with beautiful landscapes and rich history, it appeals to nature lovers and those interested in exploring the countryside. | The Mottola rock churches, Natural parks, Local food trails |
| Grottaglie | Famous for its ceramics and quaint old town, this area draws visitors looking for unique artisan products and local culture. | Ceramics workshops, Old town charm, Local markets |
Understanding Airbnb License Requirements & STR Laws in Taranto (2025)
Yes, Taranto, Apulia, Italy enforces high STR regulations. Obtaining a license and ensuring compliance is almost certainly required according to current 2025 STR laws. Always verify the latest short term rental regulations and Airbnb license requirements directly with local government authorities for Taranto to ensure full compliance before hosting.
(Source: AirROI data, 2025, based on 46% licensed listings)
Top Performing Airbnb Properties in Taranto (2025)
Benchmark your potential! Explore examples of top-performing Airbnb properties in Tarantobased on Trailing Twelve Month (TTM) revenue. Analyze their characteristics, revenue, occupancy rate, and ADR to understand what drives success in this market.

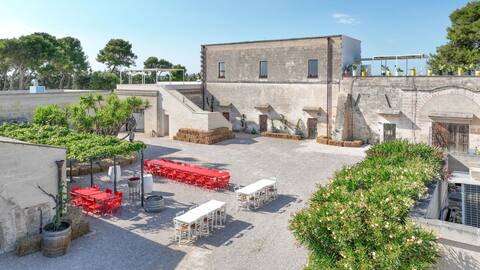
La Gigasuite. Design Villa at Sea with Spa & Pool
Entire Place • 8 bedrooms
Masseria tenute Emerà
Entire Place • 2 bedrooms
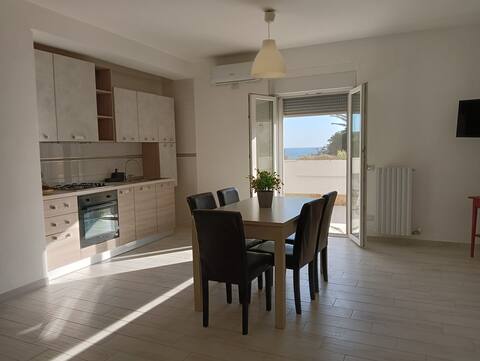
Glicine
Entire Place • 2 bedrooms

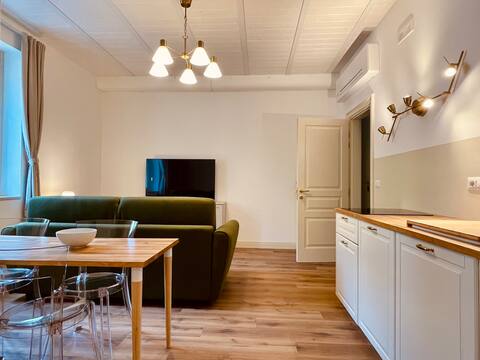
Papavero
Entire Place • 2 bedrooms
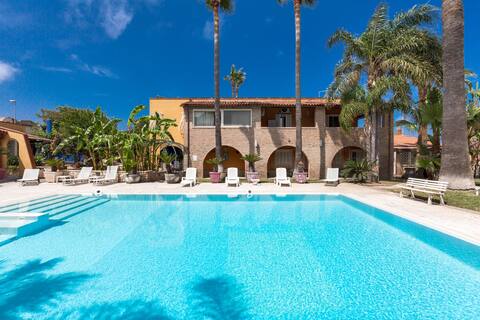
3997 Villa Thalissa by BarbarHouse
Entire Place • 7 bedrooms
Pitagora Palace, Athlete Suite
Entire Place • 1 bedroom
Note: Performance varies based on location, size, amenities, seasonality, and management quality. Data reflects the past 12 months.
Top Performing Airbnb Hosts in Taranto (2025)
Learn from the best! This table showcases top-performing Airbnb hosts in Taranto based on the number of properties managed and estimated total revenue over the past year. Analyze their scale and performance metrics.
| Host Name | Properties | Grossing Revenue | Stay Reviews | Avg Rating |
|---|---|---|---|---|
| Pamela | 14 | $180,700 | 28 | 1.35/5.0 |
| Cosimo | 6 | $104,939 | 70 | 4.13/5.0 |
| Barbarhouse SRL | 9 | $91,322 | 10 | 1.56/5.0 |
| Welcome To Italy | 5 | $62,675 | 48 | 4.38/5.0 |
| Liliana E Pierpaolo | 1 | $61,692 | 5 | 5.00/5.0 |
| Guido | 4 | $57,060 | 19 | 3.60/5.0 |
| Host #93984333 | 3 | $50,559 | 0 | 0.00/5.0 |
| Sandra | 3 | $39,596 | 78 | 4.59/5.0 |
| Flavio | 9 | $39,094 | 127 | 3.63/5.0 |
| Linda | 7 | $34,743 | 17 | 1.27/5.0 |
Analyzing the strategies of top hosts, such as their property selection, pricing, and guest communication, can offer valuable lessons for optimizing your own Airbnb operations in Taranto.
Dive Deeper: Advanced Taranto STR Market Data (2025)
Ready to unlock more insights? AirROI provides access to advanced metrics and comprehensive Airbnb data for Taranto. Explore detailed analytics beyond this report to refine your investment strategy, optimize pricing, and maximize your vacation rental profits.
Explore Advanced MetricsTaranto Short-Term Rental Market Composition (2025): Property & Room Types
Room Type Distribution
Property Type Distribution
Market Composition Insights for Taranto
- The Taranto Airbnb market composition is heavily skewed towards Entire Home/Apt listings, which make up 72.3% of the 329 active rentals. This indicates strong guest preference for privacy and space.
- Looking at the property type distribution in Taranto, Apartment/Condo properties are the most common (61.4%), reflecting the local real estate landscape.
- Houses represent a significant 23.1% portion, catering likely to families or larger groups.
- The presence of 14% Hotel/Boutique listings indicates integration with traditional hospitality.
- Smaller segments like others (combined 1.5%) offer potential for unique stay experiences.
Taranto Airbnb Room Capacity Analysis (2025): Bedroom Distribution
Distribution of Listings by Number of Bedrooms
Room Capacity Insights for Taranto
- The dominant room capacity in Taranto is 1 bedroom listings, making up 60.2% of the market. This suggests a strong demand for properties suitable for couples or solo travelers.
- Together, 1 bedroom and 2 bedrooms properties represent 86.0% of the active Airbnb listings in Taranto, indicating a high concentration in these sizes.
- With over half the market (60.2%) consisting of studios or 1-bedroom units, Taranto is particularly well-suited for individuals or couples.
- Listings with 3+ bedrooms (7.3%) represent a smaller niche, potentially indicating an underserved market for larger group accommodations in Taranto.
Taranto Vacation Rental Guest Capacity Trends (2025)
Distribution of Listings by Guest Capacity
Guest Capacity Insights for Taranto
- The most common guest capacity trend in Taranto vacation rentals is listings accommodating 4 guests (39.5%). This suggests the primary traveler segment is likely small families or groups.
- Properties designed for 4 guests and 2 guests dominate the Taranto STR market, accounting for 63.2% of listings.
- On average, properties in Taranto are equipped to host 3.3 guests.
Taranto Airbnb Booking Patterns (2025): Available vs. Booked Days
Available Days Distribution
Booked Days Distribution
Booking Pattern Insights for Taranto
- The most common availability pattern in Taranto falls within the 271-366 days range, representing 74.5% of listings. This suggests many properties have significant open periods on their calendars.
- Approximately 93.3% of listings show high availability (181+ days open annually), indicating potential for increased bookings or specific owner usage patterns.
- For booked days, the 31-90 days range is most frequent in Taranto (39.5%), reflecting common guest stay durations or potential owner blocking patterns.
- A notable 7.6% of properties secure long booking periods (181+ days booked per year), highlighting successful long-term rental strategies or significant owner usage.
Taranto Airbnb Minimum Stay Requirements Analysis
Distribution of Listings by Minimum Night Requirement
1 Night
143 listings
46.9% of total
2 Nights
74 listings
24.3% of total
3 Nights
22 listings
7.2% of total
4-6 Nights
15 listings
4.9% of total
7-29 Nights
32 listings
10.5% of total
30+ Nights
19 listings
6.2% of total
Key Insights
- The most prevalent minimum stay requirement in Taranto is 1 Night, adopted by 46.9% of listings. This highlights the market's preference for shorter, flexible bookings.
- A strong majority (71.2%) of the Taranto Airbnb data shows acceptance of very short stays (1-2 nights), indicating a dynamic, high-turnover market.
Recommendations
- Align with the market by considering a 1 Night minimum stay, as 46.9% of Taranto hosts use this setting.
- Explore offering discounts for stays of 30+ nights to attract the 6.2% of the market seeking extended stays.
- Adjust minimum nights based on seasonality – potentially shorter during low season and longer during peak demand periods in Taranto.
Taranto Airbnb Cancellation Policy Trends Analysis (2025)
Flexible
59 listings
29.9% of total
Moderate
93 listings
47.2% of total
Strict
45 listings
22.8% of total
Cancellation Policy Insights for Taranto
- The prevailing Airbnb cancellation policy trend in Taranto is Moderate, used by 47.2% of listings.
- The market strongly favors guest-friendly terms, with 77.1% of listings offering Flexible or Moderate policies. This suggests guests in Taranto may expect booking flexibility.
Recommendations for Hosts
- Consider adopting a Moderate policy to align with the 47.2% market standard in Taranto.
- Regularly review your cancellation policy against competitors and market demand shifts in Taranto.
Taranto STR Booking Lead Time Analysis (2025)
Average Booking Lead Time by Month
Booking Lead Time Insights for Taranto
- The overall average booking lead time for vacation rentals in Taranto is 35 days.
- Guests book furthest in advance for stays during May (average 60 days), likely coinciding with peak travel demand or local events.
- The shortest booking windows occur for stays in February (average 24 days), indicating more last-minute travel plans during this time.
- Seasonally, Summer (51 days avg.) sees the longest lead times, while Winter (26 days avg.) has the shortest, reflecting typical travel planning cycles.
Recommendations for Hosts
- Use the overall average lead time (35 days) as a baseline for your pricing and availability strategy in Taranto.
- For May stays, consider implementing length-of-stay discounts or slightly higher rates for bookings made less than 60 days out to capitalize on advance planning.
- Target marketing efforts for the Summer season well in advance (at least 51 days) to capture early planners.
- Monitor your own booking lead times against these Taranto averages to identify opportunities for dynamic pricing adjustments.
Popular & Essential Airbnb Amenities in Taranto (2025)
Amenity Prevalence
Amenity Insights for Taranto
- Essential amenities in Taranto that guests expect include: Air conditioning, TV. Lacking these (any) could significantly impact bookings.
- Popular amenities like Heating, Kitchen, Essentials are common but not universal. Offering these can provide a competitive edge.
- Warning: Wifi is not universally provided but is considered essential globally. Ensure reliable Wifi is offered.
Recommendations for Hosts
- Ensure your listing includes all essential amenities for Taranto: Air conditioning, TV.
- Prioritize adding missing essentials: Air conditioning, TV.
- Consider adding popular differentiators like Heating or Kitchen to increase appeal.
- Highlight unique or less common amenities you offer (e.g., hot tub, dedicated workspace, EV charger) in your listing description and photos.
- Regularly check competitor amenities in Taranto to stay competitive.
Taranto Airbnb Guest Demographics & Profile Analysis (2025)
Guest Profile Summary for Taranto
- The typical guest profile for Airbnb in Taranto consists of predominantly international visitors (66%), with top international origins including France, typically belonging to the Post-2000s (Gen Z/Alpha) group (50%), primarily speaking English or Italian.
- Domestic travelers account for 34.4% of guests.
- Key international markets include Italy (34.4%) and France (19.9%).
- Top languages spoken are English (36.8%) followed by Italian (19%).
- A significant demographic segment is the Post-2000s (Gen Z/Alpha) group, representing 50% of guests.
Recommendations for Hosts
- Focus marketing internationally, particularly towards travelers from France.
- Tailor amenities and listing descriptions to appeal to the dominant Post-2000s (Gen Z/Alpha) demographic (e.g., highlight fast WiFi, smart home features, local guides).
- Highlight unique local experiences or amenities relevant to the primary guest profile.
- Consider seasonal promotions aligned with peak travel times for key origin markets.
Nearby Short-Term Rental Market Comparison
How does the Taranto Airbnb market stack up against its neighbors? Compare key performance metrics like average monthly revenue, ADR, and occupancy rates in surrounding areas to understand the broader regional STR landscape.
| Market | Active Properties | Monthly Revenue | Daily Rate | Avg. Occupancy |
|---|---|---|---|---|
| San Michele Salentino | 74 | $2,208 | $260.22 | 44% |
| Polignano a Mare | 624 | $1,978 | $205.82 | 44% |
| Castellana Grotte | 185 | $1,845 | $219.26 | 43% |
| Ostuni | 1,576 | $1,730 | $250.45 | 39% |
| Ceglie Messapica | 380 | $1,660 | $223.98 | 41% |
| Martina Franca | 569 | $1,657 | $217.67 | 39% |
| Monopoli | 1,141 | $1,637 | $195.75 | 43% |
| Carovigno | 514 | $1,628 | $260.62 | 40% |
| Alberobello | 280 | $1,607 | $189.82 | 38% |
| San Vito dei Normanni | 168 | $1,604 | $219.74 | 43% |