Soleto Airbnb Market Analysis 2025: Short Term Rental Data & Vacation Rental Statistics in Apulia, Italy
Is Airbnb profitable in Soleto in 2025? Explore comprehensive Airbnb analytics for Soleto, Apulia, Italy to uncover income potential. This 2025 STR market report for Soleto, based on AirROI data from April 2024 to March 2025, reveals key trends in the niche market of 25 active listings.
Whether you're considering an Airbnb investment in Soleto, optimizing your existing vacation rental, or exploring rental arbitrage opportunities, understanding the Soleto Airbnb data is crucial. Navigating the high regulation landscape is key to maximizing your short term rental income potential. Let's dive into the specifics.
Key Soleto Airbnb Performance Metrics Overview
Monthly Airbnb Revenue Variations & Income Potential in Soleto (2025)
Understanding the monthly revenue variations for Airbnb listings in Soleto is key to maximizing your short term rental income potential. Seasonality significantly impacts earnings. Our analysis, based on data from the past 12 months, shows that the peak revenue month for STRs in Soleto is typically May, while February often presents the lowest earnings, highlighting opportunities for strategic pricing adjustments during shoulder and low seasons. Explore the typical Airbnb income in Soleto across different performance tiers:
- Best-in-class properties (Top 10%) achieve $1,550+ monthly, often utilizing dynamic pricing and superior guest experiences.
- Strong performing properties (Top 25%) earn $807 or more, indicating effective management and desirable locations/amenities.
- Typical properties (Median) generate around $328 per month, representing the average market performance.
- Entry-level properties (Bottom 25%) see earnings around $190, often with potential for optimization.
Average Monthly Airbnb Earnings Trend in Soleto
Soleto Airbnb Occupancy Rate Trends (2025)
Maximize your bookings by understanding the Soleto STR occupancy trends. Seasonal demand shifts significantly influence how often properties are booked. Typically, Augustsees the highest demand (peak season occupancy), while February experiences the lowest (low season). Effective strategies, like adjusting minimum stays or offering promotions, can boost occupancy during slower periods. Here's how different property tiers perform in Soleto:
- Best-in-class properties (Top 10%) achieve 43%+ occupancy, indicating high desirability and potentially optimized availability.
- Strong performing properties (Top 25%) maintain 26% or higher occupancy, suggesting good market fit and guest satisfaction.
- Typical properties (Median) have an occupancy rate around 16%.
- Entry-level properties (Bottom 25%) average 10% occupancy, potentially facing higher vacancy.
Average Monthly Occupancy Rate Trend in Soleto
Average Daily Rate (ADR) Airbnb Trends in Soleto (2025)
Effective short term rental pricing strategy in Soleto involves understanding monthly ADR fluctuations. The Average Daily Rate (ADR) for Airbnb in Soleto typically peaks in August and dips lowest during February. Leveraging Airbnb dynamic pricing tools or strategies based on this seasonality can significantly boost revenue. Here's a look at the typical nightly rates achieved:
- Best-in-class properties (Top 10%) command rates of $164+ per night, often due to premium features or locations.
- Strong performing properties (Top 25%) achieve nightly rates of $96 or more.
- Typical properties (Median) charge around $59 per night.
- Entry-level properties (Bottom 25%) earn around $44 per night.
Average Daily Rate (ADR) Trend by Month in Soleto
Get Live Soleto Market Intelligence 👇

Explore Real-time Analytics
Airbnb Seasonality Analysis & Trends in Soleto (2025)
Peak Season (May, August, July)
- Revenue averages $1,139 per month
- Occupancy rates average 32.9%
- Daily rates average $86
Shoulder Season
- Revenue averages $555 per month
- Occupancy maintains around 20.0%
- Daily rates hold near $79
Low Season (January, February, November)
- Revenue drops to average $64 per month
- Occupancy decreases to average 4.5%
- Daily rates adjust to average $71
Seasonality Insights for Soleto
- The Airbnb seasonality in Soleto shows highly seasonal trends requiring careful strategy. While the sections above show seasonal averages, it's also insightful to look at the extremes:
- During the high season, the absolute peak month showcases Soleto's highest earning potential, with monthly revenues capable of climbing to $1,320, occupancy reaching a high of 46.5%, and ADRs peaking at $90.
- Conversely, the slowest single month of the year, typically falling within the low season, marks the market's lowest point. In this month, revenue might dip to $0, occupancy could drop to 0.0%, and ADRs may adjust down to $70.
- Understanding both the seasonal averages and these monthly peaks and troughs in revenue, occupancy, and ADR is crucial for maximizing your Airbnb profit potential in Soleto.
Seasonal Strategies for Maximizing Profit
- Peak Season: Maximize revenue through premium pricing and potentially longer minimum stays. Ensure high availability.
- Low Season: Offer competitive pricing, special promotions (e.g., extended stay discounts), and flexible cancellation policies. Target off-season travelers like remote workers or budget-conscious guests.
- Shoulder Seasons: Implement dynamic pricing that balances peak and low rates. Target weekend travelers or specific events. Offer slightly more flexible terms than peak season.
- Regularly analyze your own performance against these Soleto seasonality benchmarks and adjust your pricing and availability strategy accordingly.
Best Areas for Airbnb Investment in Soleto (2025)
Exploring the top neighborhoods for short-term rentals in Soleto? This section highlights key areas, outlining why they are attractive for hosts and guests, along with notable local attractions. Consider these locations based on your target guest profile and investment strategy.
| Neighborhood / Area | Why Host Here? (Target Guests & Appeal) | Key Attractions & Landmarks |
|---|---|---|
| Historic Center | The heart of Soleto, featuring stunning architecture and rich history. A charming area that attracts tourists interested in local culture and history. | Soleto Castle, Church of Santa Maria Assunta, Piazza della Repubblica, Historic streets, Local artisan shops |
| Countryside Retreats | This area offers beautiful countryside views and a peaceful setting for those wishing to escape the hustle of city life. Perfect for relaxation and outdoor activities. | Olive groves, Local farms, Hiking trails, Tranquil landscapes, Organic markets |
| Vicinia delle Murge | A picturesque area with rolling hills and traditional stone houses, great for visitors looking for an authentic Apulian experience. | Traditional trulli, Scenic viewpoints, Local festivals, Culinary experiences, Nature walks |
| Coastal Access | Proximity to the coast, providing beautiful beaches and water activities. A great option for sun-seeking travelers. | Beaches of Otranto, Seaside promenades, Water sports activities, Beaches with local amenities |
| Local Market District | Bustling area filled with local markets and eateries. Ideal for foodies and those who want to experience local cuisine. | Weekly market, Local restaurants, Food tasting tours, Culinary workshops |
| Cultural Center | An area rich with cultural venues, events, and local performances, appealing to those interested in art and music. | Theatrical performances, Art galleries, Cultural festivals, Music events, Workshops |
| Wine Region | Famous for its vineyards and wineries, this area is perfect for wine lovers and those looking to explore local viticulture. | Vineyard tours, Wine tasting, Scenic drives, Wine festivals, Gastronomic experiences |
| Adventure Spots | Ideal for those looking for outdoor adventures such as hiking, cycling, and exploring nature trails. | Hiking routes, Cycling paths, Adventure parks, Natural reserves, Outdoor sports activities |
Understanding Airbnb License Requirements & STR Laws in Soleto (2025)
Yes, Soleto, Apulia, Italy enforces high STR regulations. Obtaining a license and ensuring compliance is almost certainly required according to current 2025 STR laws. Always verify the latest short term rental regulations and Airbnb license requirements directly with local government authorities for Soleto to ensure full compliance before hosting.
(Source: AirROI data, 2025, based on 52% licensed listings)
Top Performing Airbnb Properties in Soleto (2025)
Benchmark your potential! Explore examples of top-performing Airbnb properties in Soletobased on Trailing Twelve Month (TTM) revenue. Analyze their characteristics, revenue, occupancy rate, and ADR to understand what drives success in this market.
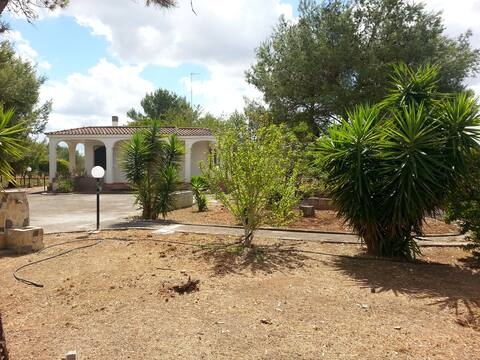
The new Alma
Entire Place • 3 bedrooms
The House of Grandparents
Entire Place • 1 bedroom
La cambera te lu Ucciu
Entire Place • 1 bedroom
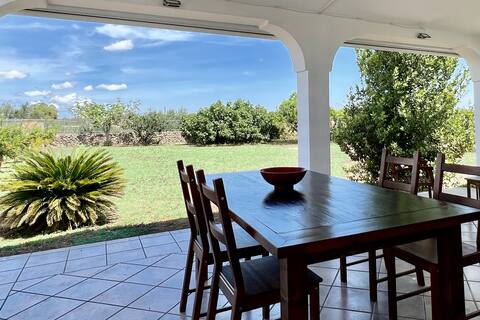
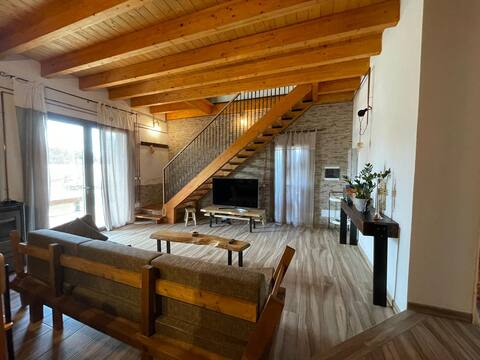
Very quiet villa in a strategic location
Entire Place • 3 bedrooms
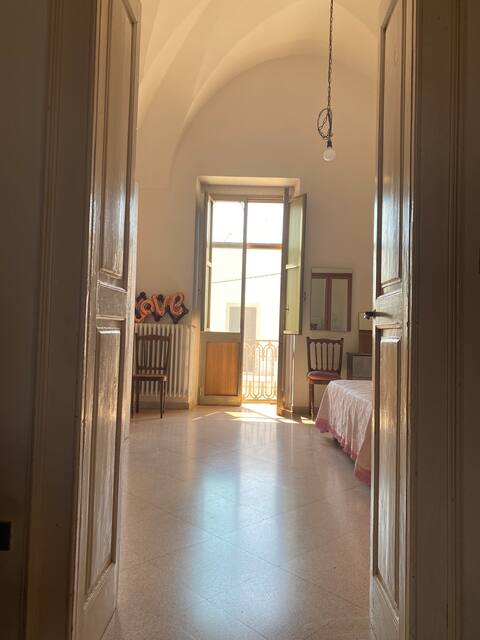
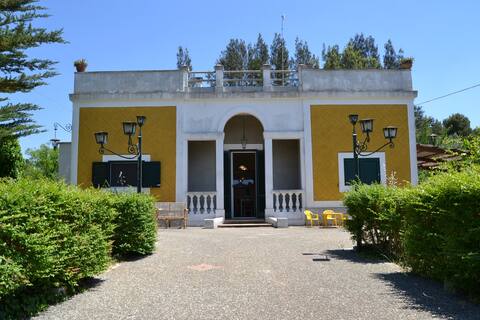
Star vaulted house in Salento
Entire Place • 2 bedrooms
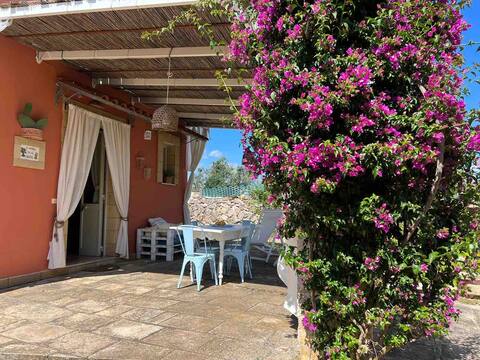
Villa Dema
Entire Place • 2 bedrooms
Note: Performance varies based on location, size, amenities, seasonality, and management quality. Data reflects the past 12 months.
Top Performing Airbnb Hosts in Soleto (2025)
Learn from the best! This table showcases top-performing Airbnb hosts in Soleto based on the number of properties managed and estimated total revenue over the past year. Analyze their scale and performance metrics.
| Host Name | Properties | Grossing Revenue | Stay Reviews | Avg Rating |
|---|---|---|---|---|
| Maria | 1 | $23,143 | 6 | 5.00/5.0 |
| Francesco | 1 | $9,399 | 11 | 4.91/5.0 |
| Alessandra | 1 | $9,174 | 58 | 4.95/5.0 |
| Serena | 3 | $7,071 | 43 | 4.97/5.0 |
| Antonella | 1 | $4,696 | 15 | 4.73/5.0 |
| Valentina | 1 | $4,255 | 3 | 5.00/5.0 |
| Host #313588281 | 1 | $3,973 | 0 | 0.00/5.0 |
| Host #468627724 | 2 | $3,725 | 0 | 0.00/5.0 |
| Raffaella | 1 | $3,692 | 9 | 5.00/5.0 |
| Host #35051390 | 1 | $3,468 | 0 | 0.00/5.0 |
Analyzing the strategies of top hosts, such as their property selection, pricing, and guest communication, can offer valuable lessons for optimizing your own Airbnb operations in Soleto.
Dive Deeper: Advanced Soleto STR Market Data (2025)
Ready to unlock more insights? AirROI provides access to advanced metrics and comprehensive Airbnb data for Soleto. Explore detailed analytics beyond this report to refine your investment strategy, optimize pricing, and maximize your vacation rental profits.
Explore Advanced MetricsSoleto Short-Term Rental Market Composition (2025): Property & Room Types
Room Type Distribution
Property Type Distribution
Market Composition Insights for Soleto
- The Soleto Airbnb market composition is heavily skewed towards Entire Home/Apt listings, which make up 84% of the 25 active rentals. This indicates strong guest preference for privacy and space.
- Looking at the property type distribution in Soleto, House properties are the most common (60%), reflecting the local real estate landscape.
- Houses represent a significant 60% portion, catering likely to families or larger groups.
Soleto Airbnb Room Capacity Analysis (2025): Bedroom Distribution
Distribution of Listings by Number of Bedrooms
Room Capacity Insights for Soleto
- The dominant room capacity in Soleto is 1 bedroom listings, making up 56% of the market. This suggests a strong demand for properties suitable for couples or solo travelers.
- Together, 1 bedroom and 3 bedrooms properties represent 76.0% of the active Airbnb listings in Soleto, indicating a high concentration in these sizes.
- With over half the market (56%) consisting of studios or 1-bedroom units, Soleto is particularly well-suited for individuals or couples.
Soleto Vacation Rental Guest Capacity Trends (2025)
Distribution of Listings by Guest Capacity
Guest Capacity Insights for Soleto
- The most common guest capacity trend in Soleto vacation rentals is listings accommodating 2 guests (40%). This suggests the primary traveler segment is likely couples or solo travelers.
- Properties designed for 2 guests and 6 guests dominate the Soleto STR market, accounting for 56.0% of listings.
- 20.0% of properties accommodate 6+ guests, serving the market segment for larger families or group travel in Soleto.
- On average, properties in Soleto are equipped to host 3.1 guests.
Soleto Airbnb Booking Patterns (2025): Available vs. Booked Days
Available Days Distribution
Booked Days Distribution
Booking Pattern Insights for Soleto
- The most common availability pattern in Soleto falls within the 271-366 days range, representing 88% of listings. This suggests many properties have significant open periods on their calendars.
- Approximately 100.0% of listings show high availability (181+ days open annually), indicating potential for increased bookings or specific owner usage patterns.
- For booked days, the 1-30 days range is most frequent in Soleto (48%), reflecting common guest stay durations or potential owner blocking patterns.
Soleto Airbnb Minimum Stay Requirements Analysis
Distribution of Listings by Minimum Night Requirement
1 Night
5 listings
20.8% of total
2 Nights
6 listings
25% of total
3 Nights
6 listings
25% of total
4-6 Nights
4 listings
16.7% of total
7-29 Nights
3 listings
12.5% of total
Key Insights
- The most prevalent minimum stay requirement in Soleto is 2 Nights, adopted by 25% of listings. This highlights the market's preference for shorter, flexible bookings.
Recommendations
- Align with the market by considering a 2 Nights minimum stay, as 25% of Soleto hosts use this setting.
- If feasible, allowing 1-night stays, especially midweek or during low season, could capture last-minute bookings, as only 20.8% currently do.
- Adjust minimum nights based on seasonality – potentially shorter during low season and longer during peak demand periods in Soleto.
Soleto Airbnb Cancellation Policy Trends Analysis (2025)
Flexible
1 listings
5.3% of total
Moderate
9 listings
47.4% of total
Strict
9 listings
47.4% of total
Cancellation Policy Insights for Soleto
- The prevailing Airbnb cancellation policy trend in Soleto is Moderate, used by 47.4% of listings.
- There's a relatively balanced mix between guest-friendly (52.7%) and stricter (47.4%) policies, offering choices for different guest needs.
Recommendations for Hosts
- Consider adopting a Moderate policy to align with the 47.4% market standard in Soleto.
- With 47.4% using Strict terms, this is a viable option in Soleto, particularly for high-value properties or during peak demand periods.
- Regularly review your cancellation policy against competitors and market demand shifts in Soleto.
Soleto STR Booking Lead Time Analysis (2025)
Average Booking Lead Time by Month
Booking Lead Time Insights for Soleto
- The overall average booking lead time for vacation rentals in Soleto is 76 days.
- Guests book furthest in advance for stays during February (average 104 days), likely coinciding with peak travel demand or local events.
- The shortest booking windows occur for stays in January (average 0 days), indicating more last-minute travel plans during this time.
- Seasonally, Spring (64 days avg.) sees the longest lead times, while Winter (42 days avg.) has the shortest, reflecting typical travel planning cycles.
Recommendations for Hosts
- Use the overall average lead time (76 days) as a baseline for your pricing and availability strategy in Soleto.
- For February stays, consider implementing length-of-stay discounts or slightly higher rates for bookings made less than 104 days out to capitalize on advance planning.
- During January, focus on last-minute booking availability and promotions, as guests book with very short notice (0 days avg.).
- Target marketing efforts for the Spring season well in advance (at least 64 days) to capture early planners.
- Monitor your own booking lead times against these Soleto averages to identify opportunities for dynamic pricing adjustments.
Popular & Essential Airbnb Amenities in Soleto (2025)
Amenity Prevalence
Amenity Insights for Soleto
- Essential amenities in Soleto that guests expect include: Essentials, Hot water, Kitchen. Lacking these (any) could significantly impact bookings.
- Popular amenities like Air conditioning, Refrigerator, Dishes and silverware are common but not universal. Offering these can provide a competitive edge.
Recommendations for Hosts
- Ensure your listing includes all essential amenities for Soleto: Essentials, Hot water, Kitchen.
- Prioritize adding missing essentials: Hot water, Kitchen.
- Consider adding popular differentiators like Air conditioning or Refrigerator to increase appeal.
- Highlight unique or less common amenities you offer (e.g., hot tub, dedicated workspace, EV charger) in your listing description and photos.
- Regularly check competitor amenities in Soleto to stay competitive.
Soleto Airbnb Guest Demographics & Profile Analysis (2025)
Guest Profile Summary for Soleto
- The typical guest profile for Airbnb in Soleto consists of a mix of domestic (49%) and international guests, with top international origins including France, typically belonging to the Post-2000s (Gen Z/Alpha) group (50%), primarily speaking English or Italian.
- Domestic travelers account for 48.6% of guests.
- Key international markets include Italy (48.6%) and France (27%).
- Top languages spoken are English (34.4%) followed by Italian (23.4%).
- A significant demographic segment is the Post-2000s (Gen Z/Alpha) group, representing 50% of guests.
Recommendations for Hosts
- Balance marketing efforts between domestic and international channels based on the guest mix.
- Tailor amenities and listing descriptions to appeal to the dominant Post-2000s (Gen Z/Alpha) demographic (e.g., highlight fast WiFi, smart home features, local guides).
- Highlight unique local experiences or amenities relevant to the primary guest profile.
- Consider seasonal promotions aligned with peak travel times for key origin markets.
Nearby Short-Term Rental Market Comparison
How does the Soleto Airbnb market stack up against its neighbors? Compare key performance metrics like average monthly revenue, ADR, and occupancy rates in surrounding areas to understand the broader regional STR landscape.
| Market | Active Properties | Monthly Revenue | Daily Rate | Avg. Occupancy |
|---|---|---|---|---|
| Kassopaia Municipal Unit | 520 | $2,555 | $278.54 | 55% |
| Afra | 15 | $2,551 | $306.19 | 54% |
| Agios Markos | 14 | $2,526 | $240.28 | 48% |
| San Michele Salentino | 74 | $2,208 | $260.22 | 44% |
| Spartilas | 27 | $2,202 | $317.90 | 50% |
| Perithia | 54 | $2,092 | $267.76 | 43% |
| Kokkini | 11 | $2,038 | $178.70 | 55% |
| Kira Chrisikou | 41 | $2,034 | $443.23 | 42% |
| Polignano a Mare | 624 | $1,978 | $205.82 | 44% |
| Kamara | 14 | $1,890 | $184.93 | 49% |