Polignano a Mare Airbnb Market Analysis 2025: Short Term Rental Data & Vacation Rental Statistics in Apulia, Italy
Is Airbnb profitable in Polignano a Mare in 2025? Explore comprehensive Airbnb analytics for Polignano a Mare, Apulia, Italy to uncover income potential. This 2025 STR market report for Polignano a Mare, based on AirROI data from April 2024 to March 2025, reveals key trends in the market of 624 active listings.
Whether you're considering an Airbnb investment in Polignano a Mare, optimizing your existing vacation rental, or exploring rental arbitrage opportunities, understanding the Polignano a Mare Airbnb data is crucial. Navigating the high regulation landscape is key to maximizing your short term rental income potential. Let's dive into the specifics.
Key Polignano a Mare Airbnb Performance Metrics Overview
Monthly Airbnb Revenue Variations & Income Potential in Polignano a Mare (2025)
Understanding the monthly revenue variations for Airbnb listings in Polignano a Mare is key to maximizing your short term rental income potential. Seasonality significantly impacts earnings. Our analysis, based on data from the past 12 months, shows that the peak revenue month for STRs in Polignano a Mare is typically August, while January often presents the lowest earnings, highlighting opportunities for strategic pricing adjustments during shoulder and low seasons. Explore the typical Airbnb income in Polignano a Mare across different performance tiers:
- Best-in-class properties (Top 10%) achieve $5,283+ monthly, often utilizing dynamic pricing and superior guest experiences.
- Strong performing properties (Top 25%) earn $3,197 or more, indicating effective management and desirable locations/amenities.
- Typical properties (Median) generate around $1,807 per month, representing the average market performance.
- Entry-level properties (Bottom 25%) see earnings around $911, often with potential for optimization.
Average Monthly Airbnb Earnings Trend in Polignano a Mare
Polignano a Mare Airbnb Occupancy Rate Trends (2025)
Maximize your bookings by understanding the Polignano a Mare STR occupancy trends. Seasonal demand shifts significantly influence how often properties are booked. Typically, Augustsees the highest demand (peak season occupancy), while January experiences the lowest (low season). Effective strategies, like adjusting minimum stays or offering promotions, can boost occupancy during slower periods. Here's how different property tiers perform in Polignano a Mare:
- Best-in-class properties (Top 10%) achieve 72%+ occupancy, indicating high desirability and potentially optimized availability.
- Strong performing properties (Top 25%) maintain 57% or higher occupancy, suggesting good market fit and guest satisfaction.
- Typical properties (Median) have an occupancy rate around 37%.
- Entry-level properties (Bottom 25%) average 17% occupancy, potentially facing higher vacancy.
Average Monthly Occupancy Rate Trend in Polignano a Mare
Average Daily Rate (ADR) Airbnb Trends in Polignano a Mare (2025)
Effective short term rental pricing strategy in Polignano a Mare involves understanding monthly ADR fluctuations. The Average Daily Rate (ADR) for Airbnb in Polignano a Mare typically peaks in August and dips lowest during March. Leveraging Airbnb dynamic pricing tools or strategies based on this seasonality can significantly boost revenue. Here's a look at the typical nightly rates achieved:
- Best-in-class properties (Top 10%) command rates of $341+ per night, often due to premium features or locations.
- Strong performing properties (Top 25%) achieve nightly rates of $216 or more.
- Typical properties (Median) charge around $146 per night.
- Entry-level properties (Bottom 25%) earn around $108 per night.
Average Daily Rate (ADR) Trend by Month in Polignano a Mare
Get Live Polignano a Mare Market Intelligence 👇

Explore Real-time Analytics
Airbnb Seasonality Analysis & Trends in Polignano a Mare (2025)
Peak Season (August, July, June)
- Revenue averages $4,173 per month
- Occupancy rates average 54.6%
- Daily rates average $235
Shoulder Season
- Revenue averages $2,497 per month
- Occupancy maintains around 39.2%
- Daily rates hold near $196
Low Season (January, February, December)
- Revenue drops to average $1,103 per month
- Occupancy decreases to average 22.6%
- Daily rates adjust to average $178
Seasonality Insights for Polignano a Mare
- The Airbnb seasonality in Polignano a Mare shows highly seasonal trends requiring careful strategy. While the sections above show seasonal averages, it's also insightful to look at the extremes:
- During the high season, the absolute peak month showcases Polignano a Mare's highest earning potential, with monthly revenues capable of climbing to $4,685, occupancy reaching a high of 60.1%, and ADRs peaking at $247.
- Conversely, the slowest single month of the year, typically falling within the low season, marks the market's lowest point. In this month, revenue might dip to $996, occupancy could drop to 19.6%, and ADRs may adjust down to $175.
- Understanding both the seasonal averages and these monthly peaks and troughs in revenue, occupancy, and ADR is crucial for maximizing your Airbnb profit potential in Polignano a Mare.
Seasonal Strategies for Maximizing Profit
- Peak Season: Maximize revenue through premium pricing and potentially longer minimum stays. Ensure high availability.
- Low Season: Offer competitive pricing, special promotions (e.g., extended stay discounts), and flexible cancellation policies. Target off-season travelers like remote workers or budget-conscious guests.
- Shoulder Seasons: Implement dynamic pricing that balances peak and low rates. Target weekend travelers or specific events. Offer slightly more flexible terms than peak season.
- Regularly analyze your own performance against these Polignano a Mare seasonality benchmarks and adjust your pricing and availability strategy accordingly.
Best Areas for Airbnb Investment in Polignano a Mare (2025)
Exploring the top neighborhoods for short-term rentals in Polignano a Mare? This section highlights key areas, outlining why they are attractive for hosts and guests, along with notable local attractions. Consider these locations based on your target guest profile and investment strategy.
| Neighborhood / Area | Why Host Here? (Target Guests & Appeal) | Key Attractions & Landmarks |
|---|---|---|
| Old Town | Charming historical center with narrow streets, stunning architecture, and local shops. It's a popular destination for tourists looking to experience the authentic Italian culture and cuisine. | Piazza Vittorio Emanuele II, Church of Santa Maria Assunta, Lama Monachile Beach, Local trattorias and gelaterias, Historic cafés |
| Lama Monachile Beach | Famous for its picturesque beach framed by cliffs, attracting beach-goers and photographers. Ideal for rentals focused on sun-seekers and adventurers. | Lama Monachile Beach, Cliffside views, Sea kayaking tours, Beachside restaurants |
| San Vito | A beautiful area known for its scenic coastline and tranquil atmosphere. Attracts families and couples looking for a quiet getaway. | San Vito Beach, Scenic hiking trails, Charming villas, Local festivals |
| Grotta Palazzese | Known for its unique cave restaurant, it draws culinary enthusiasts and couples seeking romantic dining experiences. A hotspot for photos and special occasions. | Grotta Palazzese restaurant, Beach access, Stunning cave views, Sunset spots |
| Polignano al Mare Cliffs | Renowned for breathtaking cliffside views and thrilling experiences such as cliff diving. Popular among adventure seekers and scenic photographers. | Cliff diving spots, Walking trails, Spectacular views of the Adriatic Sea, Local artisan shops |
| Visit to Grotte di Castellana | Attracts tourists interested in natural wonders and ancient caves. Perfect for guests interested in nature and geology during their stay. | Grotte di Castellana caves, Guided tours, Photography opportunities, Nature walks |
| Local Wineries | Famous for regional wines, attracting wine enthusiasts and foodies. Great for experience-based stays and culinary tourism. | Wine tasting tours, Vineyard visits, Local food markets |
| Events and Festivals | Hosts various cultural events throughout the year, bringing visitors to experience local traditions and festivities. Ideal for short-term rentals during peak festival times. | Polignano a mare Festival, Summer concerts, Art festivals, Local markets |
Understanding Airbnb License Requirements & STR Laws in Polignano a Mare (2025)
Yes, Polignano a Mare, Apulia, Italy enforces high STR regulations. Obtaining a license and ensuring compliance is almost certainly required according to current 2025 STR laws. Always verify the latest short term rental regulations and Airbnb license requirements directly with local government authorities for Polignano a Mare to ensure full compliance before hosting.
(Source: AirROI data, 2025, based on 73% licensed listings)
Top Performing Airbnb Properties in Polignano a Mare (2025)
Benchmark your potential! Explore examples of top-performing Airbnb properties in Polignano a Marebased on Trailing Twelve Month (TTM) revenue. Analyze their characteristics, revenue, occupancy rate, and ADR to understand what drives success in this market.
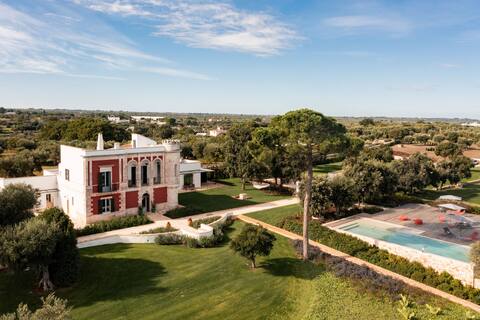
Tenuta Castione
Entire Place • 6 bedrooms

Peace, quiet, ideal for families villa with pool
Entire Place • 6 bedrooms

Palazzo Penelope
Entire Place • 4 bedrooms

Villa del Vento
Entire Place • 6 bedrooms
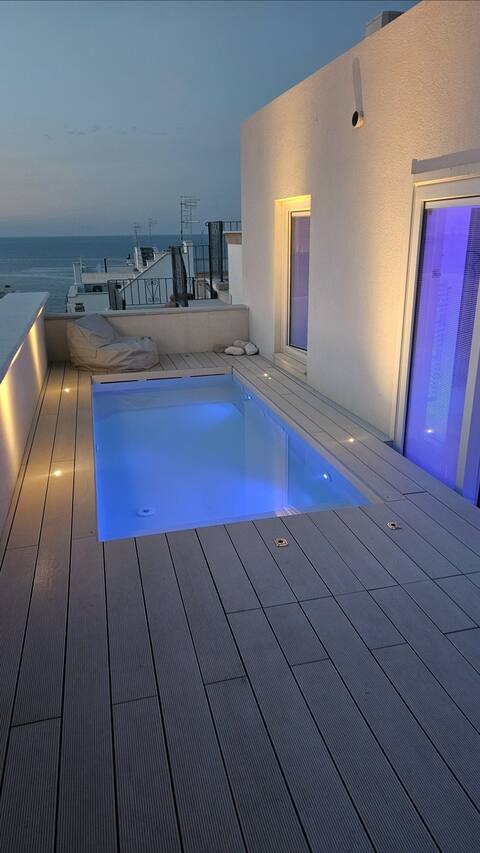
Il Gelso Bianco, luxury pool apartment
Entire Place • 3 bedrooms
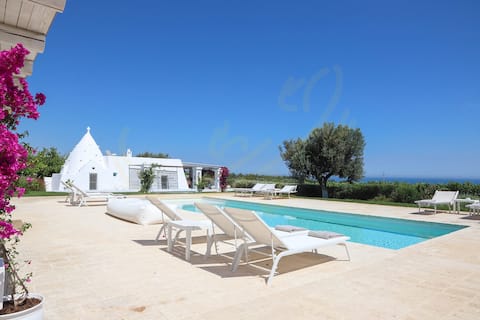
TDTrulli del Podere Trulli with Pool & Scenic View
Entire Place • 5 bedrooms
Note: Performance varies based on location, size, amenities, seasonality, and management quality. Data reflects the past 12 months.
Top Performing Airbnb Hosts in Polignano a Mare (2025)
Learn from the best! This table showcases top-performing Airbnb hosts in Polignano a Mare based on the number of properties managed and estimated total revenue over the past year. Analyze their scale and performance metrics.
| Host Name | Properties | Grossing Revenue | Stay Reviews | Avg Rating |
|---|---|---|---|---|
| Trulli & Dimore | 10 | $603,000 | 208 | 4.73/5.0 |
| WePuglia Srl | 14 | $402,713 | 368 | 4.81/5.0 |
| Alessandro | 8 | $388,949 | 386 | 4.79/5.0 |
| Donna | 8 | $347,866 | 121 | 3.70/5.0 |
| Wonderful Italy Puglia | 9 | $338,675 | 141 | 4.31/5.0 |
| HelloApulia | 5 | $296,422 | 81 | 4.92/5.0 |
| Vito | 9 | $279,721 | 262 | 4.33/5.0 |
| Host #108944780 | 1 | $234,929 | 1 | 0.00/5.0 |
| Sergio By ULIVEUS Real Estate | 1 | $213,872 | 18 | 5.00/5.0 |
| Stephen | 3 | $210,110 | 200 | 4.96/5.0 |
Analyzing the strategies of top hosts, such as their property selection, pricing, and guest communication, can offer valuable lessons for optimizing your own Airbnb operations in Polignano a Mare.
Dive Deeper: Advanced Polignano a Mare STR Market Data (2025)
Ready to unlock more insights? AirROI provides access to advanced metrics and comprehensive Airbnb data for Polignano a Mare. Explore detailed analytics beyond this report to refine your investment strategy, optimize pricing, and maximize your vacation rental profits.
Explore Advanced MetricsPolignano a Mare Short-Term Rental Market Composition (2025): Property & Room Types
Room Type Distribution
Property Type Distribution
Market Composition Insights for Polignano a Mare
- The Polignano a Mare Airbnb market composition is heavily skewed towards Entire Home/Apt listings, which make up 85.4% of the 624 active rentals. This indicates strong guest preference for privacy and space.
- Looking at the property type distribution in Polignano a Mare, House properties are the most common (47.3%), reflecting the local real estate landscape.
- Houses represent a significant 47.3% portion, catering likely to families or larger groups.
- The presence of 7.4% Hotel/Boutique listings indicates integration with traditional hospitality.
- Smaller segments like unique stays, others (combined 2.9%) offer potential for unique stay experiences.
Polignano a Mare Airbnb Room Capacity Analysis (2025): Bedroom Distribution
Distribution of Listings by Number of Bedrooms
Room Capacity Insights for Polignano a Mare
- The dominant room capacity in Polignano a Mare is 1 bedroom listings, making up 48.9% of the market. This suggests a strong demand for properties suitable for couples or solo travelers.
- Together, 1 bedroom and 2 bedrooms properties represent 77.4% of the active Airbnb listings in Polignano a Mare, indicating a high concentration in these sizes.
Polignano a Mare Vacation Rental Guest Capacity Trends (2025)
Distribution of Listings by Guest Capacity
Guest Capacity Insights for Polignano a Mare
- The most common guest capacity trend in Polignano a Mare vacation rentals is listings accommodating 4 guests (33.5%). This suggests the primary traveler segment is likely small families or groups.
- Properties designed for 4 guests and 2 guests dominate the Polignano a Mare STR market, accounting for 56.4% of listings.
- 18.1% of properties accommodate 6+ guests, serving the market segment for larger families or group travel in Polignano a Mare.
- On average, properties in Polignano a Mare are equipped to host 3.7 guests.
Polignano a Mare Airbnb Booking Patterns (2025): Available vs. Booked Days
Available Days Distribution
Booked Days Distribution
Booking Pattern Insights for Polignano a Mare
- The most common availability pattern in Polignano a Mare falls within the 271-366 days range, representing 44.7% of listings. This suggests many properties have significant open periods on their calendars.
- Approximately 83.6% of listings show high availability (181+ days open annually), indicating potential for increased bookings or specific owner usage patterns.
- For booked days, the 91-180 days range is most frequent in Polignano a Mare (39.9%), reflecting common guest stay durations or potential owner blocking patterns.
- A notable 17.9% of properties secure long booking periods (181+ days booked per year), highlighting successful long-term rental strategies or significant owner usage.
Polignano a Mare Airbnb Minimum Stay Requirements Analysis
Distribution of Listings by Minimum Night Requirement
1 Night
148 listings
24.6% of total
2 Nights
157 listings
26.1% of total
3 Nights
126 listings
21% of total
4-6 Nights
45 listings
7.5% of total
7-29 Nights
40 listings
6.7% of total
30+ Nights
85 listings
14.1% of total
Key Insights
- The most prevalent minimum stay requirement in Polignano a Mare is 2 Nights, adopted by 26.1% of listings. This highlights the market's preference for shorter, flexible bookings.
- A significant segment (14.1%) caters to monthly stays (30+ nights) in Polignano a Mare, pointing to opportunities in the extended-stay market.
Recommendations
- Align with the market by considering a 2 Nights minimum stay, as 26.1% of Polignano a Mare hosts use this setting.
- If feasible, allowing 1-night stays, especially midweek or during low season, could capture last-minute bookings, as only 24.6% currently do.
- Explore offering discounts for stays of 30+ nights to attract the 14.1% of the market seeking extended stays.
- Adjust minimum nights based on seasonality – potentially shorter during low season and longer during peak demand periods in Polignano a Mare.
Polignano a Mare Airbnb Cancellation Policy Trends Analysis (2025)
Super Strict 30 Days
14 listings
2.7% of total
Super Strict 60 Days
6 listings
1.2% of total
Flexible
97 listings
18.7% of total
Moderate
248 listings
47.7% of total
Strict
155 listings
29.8% of total
Cancellation Policy Insights for Polignano a Mare
- The prevailing Airbnb cancellation policy trend in Polignano a Mare is Moderate, used by 47.7% of listings.
- There's a relatively balanced mix between guest-friendly (66.4%) and stricter (29.8%) policies, offering choices for different guest needs.
Recommendations for Hosts
- Consider adopting a Moderate policy to align with the 47.7% market standard in Polignano a Mare.
- Regularly review your cancellation policy against competitors and market demand shifts in Polignano a Mare.
Polignano a Mare STR Booking Lead Time Analysis (2025)
Average Booking Lead Time by Month
Booking Lead Time Insights for Polignano a Mare
- The overall average booking lead time for vacation rentals in Polignano a Mare is 53 days.
- Guests book furthest in advance for stays during June (average 82 days), likely coinciding with peak travel demand or local events.
- The shortest booking windows occur for stays in December (average 30 days), indicating more last-minute travel plans during this time.
- Seasonally, Summer (76 days avg.) sees the longest lead times, while Winter (36 days avg.) has the shortest, reflecting typical travel planning cycles.
Recommendations for Hosts
- Use the overall average lead time (53 days) as a baseline for your pricing and availability strategy in Polignano a Mare.
- For June stays, consider implementing length-of-stay discounts or slightly higher rates for bookings made less than 82 days out to capitalize on advance planning.
- Target marketing efforts for the Summer season well in advance (at least 76 days) to capture early planners.
- Monitor your own booking lead times against these Polignano a Mare averages to identify opportunities for dynamic pricing adjustments.
Popular & Essential Airbnb Amenities in Polignano a Mare (2025)
Amenity Prevalence
Amenity Insights for Polignano a Mare
- Essential amenities in Polignano a Mare that guests expect include: Air conditioning, Wifi. Lacking these (any) could significantly impact bookings.
- Popular amenities like Essentials, Hot water, Hair dryer are common but not universal. Offering these can provide a competitive edge.
Recommendations for Hosts
- Ensure your listing includes all essential amenities for Polignano a Mare: Air conditioning, Wifi.
- Prioritize adding missing essentials: Air conditioning, Wifi.
- Consider adding popular differentiators like Essentials or Hot water to increase appeal.
- Highlight unique or less common amenities you offer (e.g., hot tub, dedicated workspace, EV charger) in your listing description and photos.
- Regularly check competitor amenities in Polignano a Mare to stay competitive.
Polignano a Mare Airbnb Guest Demographics & Profile Analysis (2025)
Guest Profile Summary for Polignano a Mare
- The typical guest profile for Airbnb in Polignano a Mare consists of predominantly international visitors (93%), with top international origins including United Kingdom, typically belonging to the Post-2000s (Gen Z/Alpha) group (50%), primarily speaking English or French.
- Domestic travelers account for 7.2% of guests.
- Key international markets include United States (18.2%) and United Kingdom (11.9%).
- Top languages spoken are English (44.3%) followed by French (12%).
- A significant demographic segment is the Post-2000s (Gen Z/Alpha) group, representing 50% of guests.
Recommendations for Hosts
- Focus marketing internationally, particularly towards travelers from United Kingdom.
- Tailor amenities and listing descriptions to appeal to the dominant Post-2000s (Gen Z/Alpha) demographic (e.g., highlight fast WiFi, smart home features, local guides).
- Highlight unique local experiences or amenities relevant to the primary guest profile.
- Consider seasonal promotions aligned with peak travel times for key origin markets.
Nearby Short-Term Rental Market Comparison
How does the Polignano a Mare Airbnb market stack up against its neighbors? Compare key performance metrics like average monthly revenue, ADR, and occupancy rates in surrounding areas to understand the broader regional STR landscape.
| Market | Active Properties | Monthly Revenue | Daily Rate | Avg. Occupancy |
|---|---|---|---|---|
| San Michele Salentino | 74 | $2,208 | $260.22 | 44% |
| Castellana Grotte | 185 | $1,845 | $219.26 | 43% |
| Ostuni | 1,576 | $1,730 | $250.45 | 39% |
| Ceglie Messapica | 380 | $1,660 | $223.98 | 41% |
| Martina Franca | 569 | $1,657 | $217.67 | 39% |
| Monopoli | 1,141 | $1,637 | $195.75 | 43% |
| Carovigno | 514 | $1,628 | $260.62 | 40% |
| Alberobello | 280 | $1,607 | $189.82 | 38% |
| San Vito dei Normanni | 168 | $1,604 | $219.74 | 43% |
| San Pietro in Lama | 11 | $1,601 | $158.18 | 41% |