Parabita Airbnb Market Analysis 2025: Short Term Rental Data & Vacation Rental Statistics in Apulia, Italy
Is Airbnb profitable in Parabita in 2025? Explore comprehensive Airbnb analytics for Parabita, Apulia, Italy to uncover income potential. This 2025 STR market report for Parabita, based on AirROI data from April 2024 to March 2025, reveals key trends in the niche market of 81 active listings.
Whether you're considering an Airbnb investment in Parabita, optimizing your existing vacation rental, or exploring rental arbitrage opportunities, understanding the Parabita Airbnb data is crucial. Navigating the high regulation landscape is key to maximizing your short term rental income potential. Let's dive into the specifics.
Key Parabita Airbnb Performance Metrics Overview
Monthly Airbnb Revenue Variations & Income Potential in Parabita (2025)
Understanding the monthly revenue variations for Airbnb listings in Parabita is key to maximizing your short term rental income potential. Seasonality significantly impacts earnings. Our analysis, based on data from the past 12 months, shows that the peak revenue month for STRs in Parabita is typically August, while January often presents the lowest earnings, highlighting opportunities for strategic pricing adjustments during shoulder and low seasons. Explore the typical Airbnb income in Parabita across different performance tiers:
- Best-in-class properties (Top 10%) achieve $2,736+ monthly, often utilizing dynamic pricing and superior guest experiences.
- Strong performing properties (Top 25%) earn $1,580 or more, indicating effective management and desirable locations/amenities.
- Typical properties (Median) generate around $805 per month, representing the average market performance.
- Entry-level properties (Bottom 25%) see earnings around $409, often with potential for optimization.
Average Monthly Airbnb Earnings Trend in Parabita
Parabita Airbnb Occupancy Rate Trends (2025)
Maximize your bookings by understanding the Parabita STR occupancy trends. Seasonal demand shifts significantly influence how often properties are booked. Typically, Augustsees the highest demand (peak season occupancy), while January experiences the lowest (low season). Effective strategies, like adjusting minimum stays or offering promotions, can boost occupancy during slower periods. Here's how different property tiers perform in Parabita:
- Best-in-class properties (Top 10%) achieve 62%+ occupancy, indicating high desirability and potentially optimized availability.
- Strong performing properties (Top 25%) maintain 43% or higher occupancy, suggesting good market fit and guest satisfaction.
- Typical properties (Median) have an occupancy rate around 22%.
- Entry-level properties (Bottom 25%) average 13% occupancy, potentially facing higher vacancy.
Average Monthly Occupancy Rate Trend in Parabita
Average Daily Rate (ADR) Airbnb Trends in Parabita (2025)
Effective short term rental pricing strategy in Parabita involves understanding monthly ADR fluctuations. The Average Daily Rate (ADR) for Airbnb in Parabita typically peaks in August and dips lowest during March. Leveraging Airbnb dynamic pricing tools or strategies based on this seasonality can significantly boost revenue. Here's a look at the typical nightly rates achieved:
- Best-in-class properties (Top 10%) command rates of $265+ per night, often due to premium features or locations.
- Strong performing properties (Top 25%) achieve nightly rates of $147 or more.
- Typical properties (Median) charge around $92 per night.
- Entry-level properties (Bottom 25%) earn around $66 per night.
Average Daily Rate (ADR) Trend by Month in Parabita
Get Live Parabita Market Intelligence 👇

Explore Real-time Analytics
Airbnb Seasonality Analysis & Trends in Parabita (2025)
Peak Season (August, July, November)
- Revenue averages $2,023 per month
- Occupancy rates average 44.2%
- Daily rates average $149
Shoulder Season
- Revenue averages $1,119 per month
- Occupancy maintains around 27.8%
- Daily rates hold near $139
Low Season (January, March, December)
- Revenue drops to average $502 per month
- Occupancy decreases to average 15.9%
- Daily rates adjust to average $124
Seasonality Insights for Parabita
- The Airbnb seasonality in Parabita shows highly seasonal trends requiring careful strategy. While the sections above show seasonal averages, it's also insightful to look at the extremes:
- During the high season, the absolute peak month showcases Parabita's highest earning potential, with monthly revenues capable of climbing to $2,335, occupancy reaching a high of 49.1%, and ADRs peaking at $164.
- Conversely, the slowest single month of the year, typically falling within the low season, marks the market's lowest point. In this month, revenue might dip to $430, occupancy could drop to 14.6%, and ADRs may adjust down to $122.
- Understanding both the seasonal averages and these monthly peaks and troughs in revenue, occupancy, and ADR is crucial for maximizing your Airbnb profit potential in Parabita.
Seasonal Strategies for Maximizing Profit
- Peak Season: Maximize revenue through premium pricing and potentially longer minimum stays. Ensure high availability.
- Low Season: Offer competitive pricing, special promotions (e.g., extended stay discounts), and flexible cancellation policies. Target off-season travelers like remote workers or budget-conscious guests.
- Shoulder Seasons: Implement dynamic pricing that balances peak and low rates. Target weekend travelers or specific events. Offer slightly more flexible terms than peak season.
- Regularly analyze your own performance against these Parabita seasonality benchmarks and adjust your pricing and availability strategy accordingly.
Best Areas for Airbnb Investment in Parabita (2025)
Exploring the top neighborhoods for short-term rentals in Parabita? This section highlights key areas, outlining why they are attractive for hosts and guests, along with notable local attractions. Consider these locations based on your target guest profile and investment strategy.
| Neighborhood / Area | Why Host Here? (Target Guests & Appeal) | Key Attractions & Landmarks |
|---|---|---|
| Centro Storico | The historic center of Parabita, featuring narrow streets, traditional architecture, and a vibrant local culture. Ideal for guests who want to explore the history and charm of Apulia. | Castello di Parabita, Chiesa Madre di Parabita, Piazza Vittorio Veneto, Local artisan shops, Traditional restaurants |
| Parco della rimembranza | A tranquil park area that's perfect for families and those looking to relax in nature. Popular for day trips and picnics, making it an attractive spot for visitors. | Walking trails, Natural habitats, Children's play areas |
| Viale dei Bagnanti | Close to the coast, this area offers easy access to nearby beaches and seaside attractions, making it a favorite for beachgoers and summer tourists. | Beaches, Beach clubs, Water sports, Seafood restaurants |
| Locale 'A Piazza | Known for its lively atmosphere, this area features cafes and bars that attract both locals and tourists, perfect for an active nightlife scene. | Nightlife venues, Local markets, Festivals and events |
| Museo di Parabita | A cultural gem showcasing the history of the region, popular among those interested in local heritage and artifacts. | Cultural exhibitions, Art displays, Educational tours |
| Via Roma | A central street featuring shops and eateries, ideal for guests who enjoy convenience and accessibility to local amenities. | Shopping boutiques, Cafes and bistros, Local markets |
| Chiesa di San Giovanni Battista | A historical church with architectural significance, attracting visitors and religious tourism. | Architectural tours, Cultural events, Religious services |
| Siti di Interesse Archeologico | Surrounded by various archaeological sites, great for history enthusiasts and those wanting to explore the ancient heritage of the area. | Archaeological sites, Guided tours, Historical landmarks |
Understanding Airbnb License Requirements & STR Laws in Parabita (2025)
Yes, Parabita, Apulia, Italy enforces high STR regulations. Obtaining a license and ensuring compliance is almost certainly required according to current 2025 STR laws. Always verify the latest short term rental regulations and Airbnb license requirements directly with local government authorities for Parabita to ensure full compliance before hosting.
(Source: AirROI data, 2025, based on 37% licensed listings)
Top Performing Airbnb Properties in Parabita (2025)
Benchmark your potential! Explore examples of top-performing Airbnb properties in Parabitabased on Trailing Twelve Month (TTM) revenue. Analyze their characteristics, revenue, occupancy rate, and ADR to understand what drives success in this market.
Casa a Mezz'aria, traditional home near Gallipoli
Entire Place • 4 bedrooms
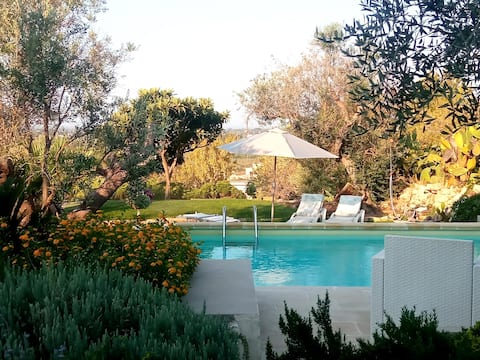
Ulivi al tramonto: country home with private pool
Entire Place • 2 bedrooms

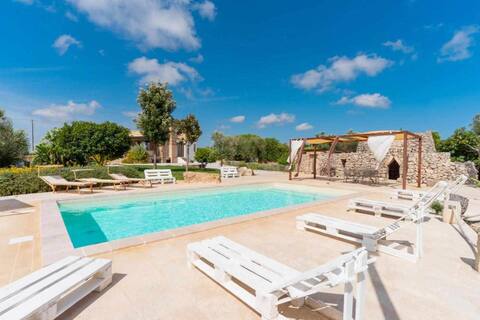
u Gallinaiu By Home Picetti - Villa with Pool
Entire Place • 2 bedrooms
Villa Greta By Vivimy
Entire Place • 3 bedrooms
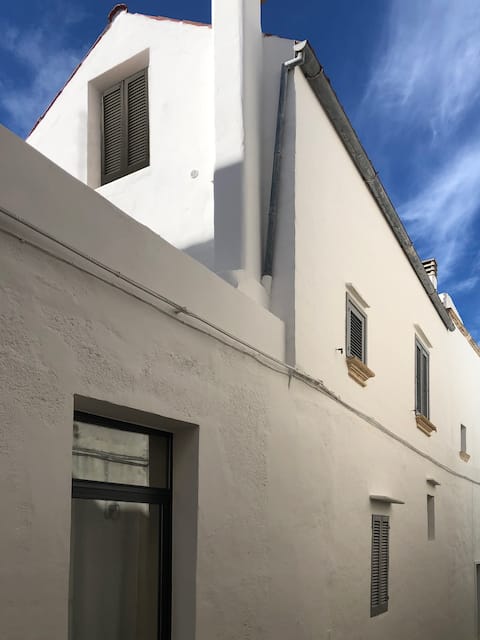
Casa Colonna in Salento
Entire Place • N/A
Masseria Salentina Tornesella - Loft with Pool
Entire Place • 1 bedroom
Note: Performance varies based on location, size, amenities, seasonality, and management quality. Data reflects the past 12 months.
Top Performing Airbnb Hosts in Parabita (2025)
Learn from the best! This table showcases top-performing Airbnb hosts in Parabita based on the number of properties managed and estimated total revenue over the past year. Analyze their scale and performance metrics.
| Host Name | Properties | Grossing Revenue | Stay Reviews | Avg Rating |
|---|---|---|---|---|
| Letizia | 3 | $60,155 | 229 | 4.95/5.0 |
| Livio | 3 | $41,184 | 81 | 3.24/5.0 |
| Alessandro | 3 | $40,291 | 82 | 4.55/5.0 |
| Ersilia | 1 | $35,341 | 101 | 4.93/5.0 |
| Milena | 1 | $34,067 | 46 | 4.93/5.0 |
| Host #97364266 | 4 | $29,135 | 2 | 0.00/5.0 |
| Host #480030221 | 1 | $17,709 | 0 | 0.00/5.0 |
| Host #495653988 | 1 | $17,092 | 0 | 0.00/5.0 |
| Dario | 1 | $15,639 | 5 | 4.80/5.0 |
| Luciano | 1 | $15,438 | 3 | 5.00/5.0 |
Analyzing the strategies of top hosts, such as their property selection, pricing, and guest communication, can offer valuable lessons for optimizing your own Airbnb operations in Parabita.
Dive Deeper: Advanced Parabita STR Market Data (2025)
Ready to unlock more insights? AirROI provides access to advanced metrics and comprehensive Airbnb data for Parabita. Explore detailed analytics beyond this report to refine your investment strategy, optimize pricing, and maximize your vacation rental profits.
Explore Advanced MetricsParabita Short-Term Rental Market Composition (2025): Property & Room Types
Room Type Distribution
Property Type Distribution
Market Composition Insights for Parabita
- The Parabita Airbnb market composition is heavily skewed towards Entire Home/Apt listings, which make up 92.6% of the 81 active rentals. This indicates strong guest preference for privacy and space.
- Looking at the property type distribution in Parabita, House properties are the most common (60.5%), reflecting the local real estate landscape.
- Houses represent a significant 60.5% portion, catering likely to families or larger groups.
- The presence of 7.4% Hotel/Boutique listings indicates integration with traditional hospitality.
- Smaller segments like unique stays, others (combined 2.4%) offer potential for unique stay experiences.
Parabita Airbnb Room Capacity Analysis (2025): Bedroom Distribution
Distribution of Listings by Number of Bedrooms
Room Capacity Insights for Parabita
- The dominant room capacity in Parabita is 1 bedroom listings, making up 45.7% of the market. This suggests a strong demand for properties suitable for couples or solo travelers.
- Together, 1 bedroom and 2 bedrooms properties represent 74.1% of the active Airbnb listings in Parabita, indicating a high concentration in these sizes.
- A significant 20.9% of listings offer 3+ bedrooms, catering to larger groups and families seeking more space in Parabita.
Parabita Vacation Rental Guest Capacity Trends (2025)
Distribution of Listings by Guest Capacity
Guest Capacity Insights for Parabita
- The most common guest capacity trend in Parabita vacation rentals is listings accommodating 4 guests (30.9%). This suggests the primary traveler segment is likely small families or groups.
- Properties designed for 4 guests and 3 guests dominate the Parabita STR market, accounting for 46.9% of listings.
- 23.4% of properties accommodate 6+ guests, serving the market segment for larger families or group travel in Parabita.
- On average, properties in Parabita are equipped to host 4.3 guests.
Parabita Airbnb Booking Patterns (2025): Available vs. Booked Days
Available Days Distribution
Booked Days Distribution
Booking Pattern Insights for Parabita
- The most common availability pattern in Parabita falls within the 271-366 days range, representing 84% of listings. This suggests many properties have significant open periods on their calendars.
- Approximately 97.6% of listings show high availability (181+ days open annually), indicating potential for increased bookings or specific owner usage patterns.
- For booked days, the 1-30 days range is most frequent in Parabita (43.2%), reflecting common guest stay durations or potential owner blocking patterns.
- A notable 2.5% of properties secure long booking periods (181+ days booked per year), highlighting successful long-term rental strategies or significant owner usage.
Parabita Airbnb Minimum Stay Requirements Analysis
Distribution of Listings by Minimum Night Requirement
1 Night
9 listings
12.5% of total
2 Nights
20 listings
27.8% of total
3 Nights
9 listings
12.5% of total
4-6 Nights
12 listings
16.7% of total
7-29 Nights
21 listings
29.2% of total
30+ Nights
1 listings
1.4% of total
Key Insights
- The most prevalent minimum stay requirement in Parabita is 7-29 Nights, adopted by 29.2% of listings. This highlights the market's preference for shorter, flexible bookings.
- Dedicated monthly rentals (30+ nights) represent a small niche (1.4%), possibly an untapped area for hosts.
Recommendations
- Align with the market by considering a 7-29 Nights minimum stay, as 29.2% of Parabita hosts use this setting.
- If feasible, allowing 1-night stays, especially midweek or during low season, could capture last-minute bookings, as only 12.5% currently do.
- Adjust minimum nights based on seasonality – potentially shorter during low season and longer during peak demand periods in Parabita.
Parabita Airbnb Cancellation Policy Trends Analysis (2025)
Flexible
15 listings
34.1% of total
Moderate
14 listings
31.8% of total
Strict
15 listings
34.1% of total
Cancellation Policy Insights for Parabita
- The prevailing Airbnb cancellation policy trend in Parabita is Flexible, used by 34.1% of listings.
- There's a relatively balanced mix between guest-friendly (65.9%) and stricter (34.1%) policies, offering choices for different guest needs.
Recommendations for Hosts
- Consider adopting a Flexible policy to align with the 34.1% market standard in Parabita.
- With 34.1% using Strict terms, this is a viable option in Parabita, particularly for high-value properties or during peak demand periods.
- Regularly review your cancellation policy against competitors and market demand shifts in Parabita.
Parabita STR Booking Lead Time Analysis (2025)
Average Booking Lead Time by Month
Booking Lead Time Insights for Parabita
- The overall average booking lead time for vacation rentals in Parabita is 52 days.
- Guests book furthest in advance for stays during May (average 115 days), likely coinciding with peak travel demand or local events.
- The shortest booking windows occur for stays in February (average 2 days), indicating more last-minute travel plans during this time.
- Seasonally, Spring (91 days avg.) sees the longest lead times, while Winter (24 days avg.) has the shortest, reflecting typical travel planning cycles.
Recommendations for Hosts
- Use the overall average lead time (52 days) as a baseline for your pricing and availability strategy in Parabita.
- For May stays, consider implementing length-of-stay discounts or slightly higher rates for bookings made less than 115 days out to capitalize on advance planning.
- During February, focus on last-minute booking availability and promotions, as guests book with very short notice (2 days avg.).
- Target marketing efforts for the Spring season well in advance (at least 91 days) to capture early planners.
- Monitor your own booking lead times against these Parabita averages to identify opportunities for dynamic pricing adjustments.
Popular & Essential Airbnb Amenities in Parabita (2025)
Amenity Prevalence
Amenity Insights for Parabita
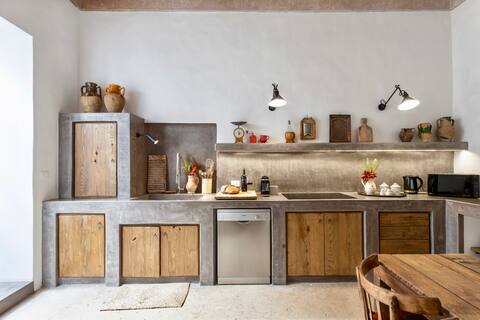
- Essential amenities in Parabita that guests expect include: Kitchen. Lacking these (this) could significantly impact bookings.
- Popular amenities like Essentials, Air conditioning, Hot water are common but not universal. Offering these can provide a competitive edge.
- Warning: Wifi is not universally provided but is considered essential globally. Ensure reliable Wifi is offered.
Recommendations for Hosts
- Ensure your listing includes all essential amenities for Parabita: Kitchen.
- Prioritize adding missing essentials: Kitchen.
- Consider adding popular differentiators like Essentials or Air conditioning to increase appeal.
- Highlight unique or less common amenities you offer (e.g., hot tub, dedicated workspace, EV charger) in your listing description and photos.
- Regularly check competitor amenities in Parabita to stay competitive.
Parabita Airbnb Guest Demographics & Profile Analysis (2025)
Guest Profile Summary for Parabita
- The typical guest profile for Airbnb in Parabita consists of predominantly international visitors (74%), with top international origins including France, typically belonging to the Post-2000s (Gen Z/Alpha) group (50%), primarily speaking English or Italian.
- Domestic travelers account for 25.6% of guests.
- Key international markets include Italy (25.6%) and France (21.3%).
- Top languages spoken are English (37.7%) followed by Italian (15.5%).
- A significant demographic segment is the Post-2000s (Gen Z/Alpha) group, representing 50% of guests.
Recommendations for Hosts
- Focus marketing internationally, particularly towards travelers from France.
- Tailor amenities and listing descriptions to appeal to the dominant Post-2000s (Gen Z/Alpha) demographic (e.g., highlight fast WiFi, smart home features, local guides).
- Highlight unique local experiences or amenities relevant to the primary guest profile.
- Consider seasonal promotions aligned with peak travel times for key origin markets.
Nearby Short-Term Rental Market Comparison
How does the Parabita Airbnb market stack up against its neighbors? Compare key performance metrics like average monthly revenue, ADR, and occupancy rates in surrounding areas to understand the broader regional STR landscape.
| Market | Active Properties | Monthly Revenue | Daily Rate | Avg. Occupancy |
|---|---|---|---|---|
| Kassopaia Municipal Unit | 520 | $2,555 | $278.54 | 55% |
| Afra | 15 | $2,551 | $306.19 | 54% |
| Agios Markos | 14 | $2,526 | $240.28 | 48% |
| San Michele Salentino | 74 | $2,208 | $260.22 | 44% |
| Spartilas | 27 | $2,202 | $317.90 | 50% |
| Perithia | 54 | $2,092 | $267.76 | 43% |
| Kokkini | 11 | $2,038 | $178.70 | 55% |
| Kira Chrisikou | 41 | $2,034 | $443.23 | 42% |
| Polignano a Mare | 624 | $1,978 | $205.82 | 44% |
| Kamara | 14 | $1,890 | $184.93 | 49% |