Oria Airbnb Market Analysis 2025: Short Term Rental Data & Vacation Rental Statistics in Apulia, Italy
Is Airbnb profitable in Oria in 2025? Explore comprehensive Airbnb analytics for Oria, Apulia, Italy to uncover income potential. This 2025 STR market report for Oria, based on AirROI data from April 2024 to March 2025, reveals key trends in the niche market of 51 active listings.
Whether you're considering an Airbnb investment in Oria, optimizing your existing vacation rental, or exploring rental arbitrage opportunities, understanding the Oria Airbnb data is crucial. Navigating the high regulation landscape is key to maximizing your short term rental income potential. Let's dive into the specifics.
Key Oria Airbnb Performance Metrics Overview
Monthly Airbnb Revenue Variations & Income Potential in Oria (2025)
Understanding the monthly revenue variations for Airbnb listings in Oria is key to maximizing your short term rental income potential. Seasonality significantly impacts earnings. Our analysis, based on data from the past 12 months, shows that the peak revenue month for STRs in Oria is typically July, while January often presents the lowest earnings, highlighting opportunities for strategic pricing adjustments during shoulder and low seasons. Explore the typical Airbnb income in Oria across different performance tiers:
- Best-in-class properties (Top 10%) achieve $3,417+ monthly, often utilizing dynamic pricing and superior guest experiences.
- Strong performing properties (Top 25%) earn $1,699 or more, indicating effective management and desirable locations/amenities.
- Typical properties (Median) generate around $701 per month, representing the average market performance.
- Entry-level properties (Bottom 25%) see earnings around $325, often with potential for optimization.
Average Monthly Airbnb Earnings Trend in Oria
Oria Airbnb Occupancy Rate Trends (2025)
Maximize your bookings by understanding the Oria STR occupancy trends. Seasonal demand shifts significantly influence how often properties are booked. Typically, Augustsees the highest demand (peak season occupancy), while January experiences the lowest (low season). Effective strategies, like adjusting minimum stays or offering promotions, can boost occupancy during slower periods. Here's how different property tiers perform in Oria:
- Best-in-class properties (Top 10%) achieve 48%+ occupancy, indicating high desirability and potentially optimized availability.
- Strong performing properties (Top 25%) maintain 35% or higher occupancy, suggesting good market fit and guest satisfaction.
- Typical properties (Median) have an occupancy rate around 24%.
- Entry-level properties (Bottom 25%) average 12% occupancy, potentially facing higher vacancy.
Average Monthly Occupancy Rate Trend in Oria
Average Daily Rate (ADR) Airbnb Trends in Oria (2025)
Effective short term rental pricing strategy in Oria involves understanding monthly ADR fluctuations. The Average Daily Rate (ADR) for Airbnb in Oria typically peaks in August and dips lowest during March. Leveraging Airbnb dynamic pricing tools or strategies based on this seasonality can significantly boost revenue. Here's a look at the typical nightly rates achieved:
- Best-in-class properties (Top 10%) command rates of $392+ per night, often due to premium features or locations.
- Strong performing properties (Top 25%) achieve nightly rates of $157 or more.
- Typical properties (Median) charge around $91 per night.
- Entry-level properties (Bottom 25%) earn around $67 per night.
Average Daily Rate (ADR) Trend by Month in Oria
Get Live Oria Market Intelligence 👇

Explore Real-time Analytics
Airbnb Seasonality Analysis & Trends in Oria (2025)
Peak Season (July, September, August)
- Revenue averages $2,301 per month
- Occupancy rates average 35.4%
- Daily rates average $198
Shoulder Season
- Revenue averages $1,555 per month
- Occupancy maintains around 24.6%
- Daily rates hold near $182
Low Season (January, April, December)
- Revenue drops to average $732 per month
- Occupancy decreases to average 18.1%
- Daily rates adjust to average $180
Seasonality Insights for Oria
- The Airbnb seasonality in Oria shows highly seasonal trends requiring careful strategy. While the sections above show seasonal averages, it's also insightful to look at the extremes:
- During the high season, the absolute peak month showcases Oria's highest earning potential, with monthly revenues capable of climbing to $2,407, occupancy reaching a high of 44.6%, and ADRs peaking at $206.
- Conversely, the slowest single month of the year, typically falling within the low season, marks the market's lowest point. In this month, revenue might dip to $478, occupancy could drop to 13.8%, and ADRs may adjust down to $174.
- Understanding both the seasonal averages and these monthly peaks and troughs in revenue, occupancy, and ADR is crucial for maximizing your Airbnb profit potential in Oria.
Seasonal Strategies for Maximizing Profit
- Peak Season: Maximize revenue through premium pricing and potentially longer minimum stays. Ensure high availability.
- Low Season: Offer competitive pricing, special promotions (e.g., extended stay discounts), and flexible cancellation policies. Target off-season travelers like remote workers or budget-conscious guests.
- Shoulder Seasons: Implement dynamic pricing that balances peak and low rates. Target weekend travelers or specific events. Offer slightly more flexible terms than peak season.
- Regularly analyze your own performance against these Oria seasonality benchmarks and adjust your pricing and availability strategy accordingly.
Best Areas for Airbnb Investment in Oria (2025)
Exploring the top neighborhoods for short-term rentals in Oria? This section highlights key areas, outlining why they are attractive for hosts and guests, along with notable local attractions. Consider these locations based on your target guest profile and investment strategy.
| Neighborhood / Area | Why Host Here? (Target Guests & Appeal) | Key Attractions & Landmarks |
|---|---|---|
| Centro Storico | The historic center of Oria, filled with medieval architecture, narrow streets, and a rich cultural heritage. A great spot for tourists who appreciate history and local traditions. | Castle of Oria, Cathedral of Oria, Palazzo De Marco, Church of San Bartolomeo, Piazza Manfredi |
| Castello di Oria | Home to the impressive Oria Castle, this area attracts visitors interested in medieval history and stunning views. Ideal for those looking to stay near unique historical landmarks. | Oria Castle, Archaeological Park of Oria, Viewpoint of Sant'Elia |
| Viale Vittorio Veneto | A vibrant street lined with shops and cafes, popular among locals and tourists. It offers a bustling atmosphere ideal for dining and socializing. | Shops and Cafes, Local Markets, Parks |
| Sant'Anna | A quieter, residential area that offers a more local feel. Perfect for families or travelers looking for a peaceful stay with access to local amenities. | Shopping Areas, Parks, Local Schools |
| Parco della Rimembranza | A beautiful park area popular for outdoor activities and relaxation. Great for visitors looking to escape city life without straying far from attractions. | Walking Trails, Playgrounds, Picnic Areas |
| Via Roma | One of the main streets offering a mix of shopping and entertainment. Well-connected and lively, it’s perfect for those who want to be in the heart of the city. | Shops, Restaurants, Cafes |
| Local Vineyards | The surrounding countryside hosts several vineyards, ideal for wine lovers. Visitors can enjoy wine tours and tastings, providing a unique experience. | Vineyard Tours, Wine Tasting Events, Scenic Countryside |
| Coastal Areas Nearby | The nearby coastline offers beautiful beaches and seaside leisure activities, perfect for tourists looking for sun and relaxation. | Beaches, Water Sports, Seaside Restaurants |
Understanding Airbnb License Requirements & STR Laws in Oria (2025)
Yes, Oria, Apulia, Italy enforces high STR regulations. Obtaining a license and ensuring compliance is almost certainly required according to current 2025 STR laws. Always verify the latest short term rental regulations and Airbnb license requirements directly with local government authorities for Oria to ensure full compliance before hosting.
(Source: AirROI data, 2025, based on 31% licensed listings)
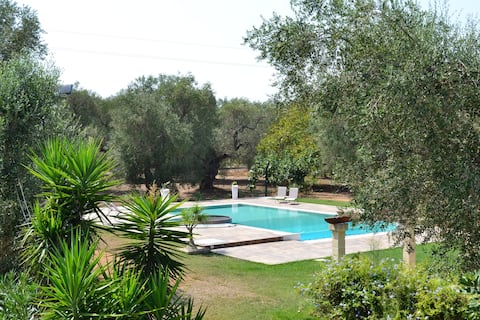
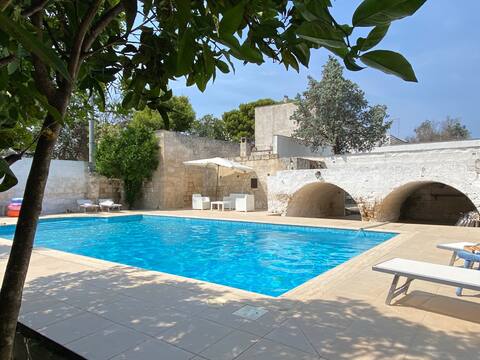
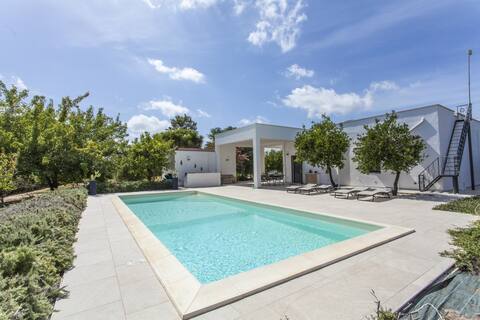
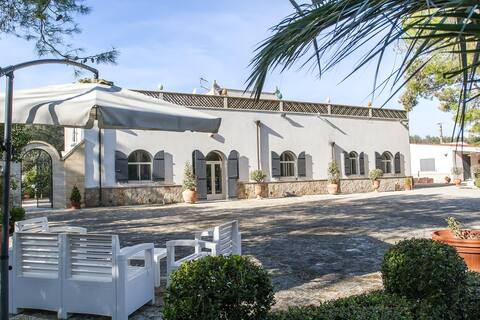
Top Performing Airbnb Properties in Oria (2025)
Benchmark your potential! Explore examples of top-performing Airbnb properties in Oriabased on Trailing Twelve Month (TTM) revenue. Analyze their characteristics, revenue, occupancy rate, and ADR to understand what drives success in this market.

Villa Oria
Entire Place • 7 bedrooms
Borgo Guastaferri Villa & Pool !
Entire Place • 4 bedrooms
Il Cuore - the Heart. 4 bed 2 bath spacious house
Entire Place • 4 bedrooms
Country villa with splendid garden & private pool
Entire Place • 3 bedrooms
![★★★★★ [Historical city] Villa Medici](https://a0.muscache.com/im/pictures/miso/Hosting-45573798/original/2ab9e568-6607-4d63-9814-3dc63851f4c4.jpeg?im_w=480&im_format=avif)
★★★★★ [Historical city] Villa Medici
Entire Place • 5 bedrooms
Villa dell'Amicizia, Italian garden with pool
Entire Place • 4 bedrooms
Note: Performance varies based on location, size, amenities, seasonality, and management quality. Data reflects the past 12 months.
Top Performing Airbnb Hosts in Oria (2025)
Learn from the best! This table showcases top-performing Airbnb hosts in Oria based on the number of properties managed and estimated total revenue over the past year. Analyze their scale and performance metrics.
| Host Name | Properties | Grossing Revenue | Stay Reviews | Avg Rating |
|---|---|---|---|---|
| Host #93984333 | 1 | $74,473 | 0 | 0.00/5.0 |
| Host #42592164 | 3 | $59,650 | 1 | 0.00/5.0 |
| Luigi | 1 | $37,741 | 12 | 4.83/5.0 |
| Piet | 1 | $35,553 | 19 | 4.95/5.0 |
| Casaurea | 2 | $34,444 | 21 | 2.38/5.0 |
| Christine | 1 | $28,237 | 13 | 5.00/5.0 |
| Lotta | 1 | $27,786 | 20 | 4.95/5.0 |
| Leah | 1 | $18,051 | 37 | 4.97/5.0 |
| Linda | 2 | $17,384 | 8 | 5.00/5.0 |
| Host #349117830 | 1 | $13,860 | 0 | 0.00/5.0 |
Analyzing the strategies of top hosts, such as their property selection, pricing, and guest communication, can offer valuable lessons for optimizing your own Airbnb operations in Oria.
Dive Deeper: Advanced Oria STR Market Data (2025)
Ready to unlock more insights? AirROI provides access to advanced metrics and comprehensive Airbnb data for Oria. Explore detailed analytics beyond this report to refine your investment strategy, optimize pricing, and maximize your vacation rental profits.
Explore Advanced MetricsOria Short-Term Rental Market Composition (2025): Property & Room Types
Room Type Distribution
Property Type Distribution
Market Composition Insights for Oria
- The Oria Airbnb market composition is heavily skewed towards Entire Home/Apt listings, which make up 88.2% of the 51 active rentals. This indicates strong guest preference for privacy and space.
- Looking at the property type distribution in Oria, House properties are the most common (66.7%), reflecting the local real estate landscape.
- Houses represent a significant 66.7% portion, catering likely to families or larger groups.
- The presence of 9.8% Hotel/Boutique listings indicates integration with traditional hospitality.
Oria Airbnb Room Capacity Analysis (2025): Bedroom Distribution
Distribution of Listings by Number of Bedrooms
Room Capacity Insights for Oria
- The dominant room capacity in Oria is 2 bedrooms listings, making up 33.3% of the market. This suggests a strong demand for properties suitable for couples or solo travelers.
- Together, 2 bedrooms and 1 bedroom properties represent 62.7% of the active Airbnb listings in Oria, indicating a high concentration in these sizes.
- A significant 33.3% of listings offer 3+ bedrooms, catering to larger groups and families seeking more space in Oria.
Oria Vacation Rental Guest Capacity Trends (2025)
Distribution of Listings by Guest Capacity
Guest Capacity Insights for Oria
- The most common guest capacity trend in Oria vacation rentals is listings accommodating 4 guests (23.5%). This suggests the primary traveler segment is likely small families or groups.
- Properties designed for 4 guests and 8+ guests dominate the Oria STR market, accounting for 45.1% of listings.
- 39.2% of properties accommodate 6+ guests, serving the market segment for larger families or group travel in Oria.
- On average, properties in Oria are equipped to host 4.9 guests.
Oria Airbnb Booking Patterns (2025): Available vs. Booked Days
Available Days Distribution
Booked Days Distribution
Booking Pattern Insights for Oria
- The most common availability pattern in Oria falls within the 271-366 days range, representing 90.2% of listings. This suggests many properties have significant open periods on their calendars.
- Approximately 100.0% of listings show high availability (181+ days open annually), indicating potential for increased bookings or specific owner usage patterns.
- For booked days, the 31-90 days range is most frequent in Oria (51%), reflecting common guest stay durations or potential owner blocking patterns.
Oria Airbnb Minimum Stay Requirements Analysis
Distribution of Listings by Minimum Night Requirement
1 Night
14 listings
31.8% of total
2 Nights
8 listings
18.2% of total
3 Nights
8 listings
18.2% of total
4-6 Nights
5 listings
11.4% of total
7-29 Nights
8 listings
18.2% of total
30+ Nights
1 listings
2.3% of total
Key Insights
- The most prevalent minimum stay requirement in Oria is 1 Night, adopted by 31.8% of listings. This highlights the market's preference for shorter, flexible bookings.
- Dedicated monthly rentals (30+ nights) represent a small niche (2.3%), possibly an untapped area for hosts.
Recommendations
- Align with the market by considering a 1 Night minimum stay, as 31.8% of Oria hosts use this setting.
- Adjust minimum nights based on seasonality – potentially shorter during low season and longer during peak demand periods in Oria.
Oria Airbnb Cancellation Policy Trends Analysis (2025)
Flexible
8 listings
30.8% of total
Moderate
11 listings
42.3% of total
Strict
7 listings
26.9% of total
Cancellation Policy Insights for Oria
- The prevailing Airbnb cancellation policy trend in Oria is Moderate, used by 42.3% of listings.
- The market strongly favors guest-friendly terms, with 73.1% of listings offering Flexible or Moderate policies. This suggests guests in Oria may expect booking flexibility.
Recommendations for Hosts
- Consider adopting a Moderate policy to align with the 42.3% market standard in Oria.
- Regularly review your cancellation policy against competitors and market demand shifts in Oria.
Oria STR Booking Lead Time Analysis (2025)
Average Booking Lead Time by Month
Booking Lead Time Insights for Oria
- The overall average booking lead time for vacation rentals in Oria is 59 days.
- Guests book furthest in advance for stays during September (average 94 days), likely coinciding with peak travel demand or local events.
- The shortest booking windows occur for stays in December (average 25 days), indicating more last-minute travel plans during this time.
- Seasonally, Fall (76 days avg.) sees the longest lead times, while Spring (43 days avg.) has the shortest, reflecting typical travel planning cycles.
Recommendations for Hosts
- Use the overall average lead time (59 days) as a baseline for your pricing and availability strategy in Oria.
- For September stays, consider implementing length-of-stay discounts or slightly higher rates for bookings made less than 94 days out to capitalize on advance planning.
- Target marketing efforts for the Fall season well in advance (at least 76 days) to capture early planners.
- Monitor your own booking lead times against these Oria averages to identify opportunities for dynamic pricing adjustments.
Popular & Essential Airbnb Amenities in Oria (2025)
Amenity Prevalence
Amenity Insights for Oria
- Essential amenities in Oria that guests expect include: Kitchen, Heating, Air conditioning, Essentials. Lacking these (any) could significantly impact bookings.
- Popular amenities like Hot water, Wifi, Washer are common but not universal. Offering these can provide a competitive edge.
- Warning: Wifi is not universally provided but is considered essential globally. Ensure reliable Wifi is offered.
Recommendations for Hosts
- Ensure your listing includes all essential amenities for Oria: Kitchen, Heating, Air conditioning, Essentials.
- Prioritize adding missing essentials: Kitchen, Heating, Air conditioning, Essentials.
- Consider adding popular differentiators like Hot water or Wifi to increase appeal.
- Highlight unique or less common amenities you offer (e.g., hot tub, dedicated workspace, EV charger) in your listing description and photos.
- Regularly check competitor amenities in Oria to stay competitive.
Oria Airbnb Guest Demographics & Profile Analysis (2025)
Guest Profile Summary for Oria
- The typical guest profile for Airbnb in Oria consists of predominantly international visitors (77%), with top international origins including France, typically belonging to the Post-2000s (Gen Z/Alpha) group (50%), primarily speaking English or Italian.
- Domestic travelers account for 23.5% of guests.
- Key international markets include Italy (23.5%) and France (17.6%).
- Top languages spoken are English (38.2%) followed by Italian (15.7%).
- A significant demographic segment is the Post-2000s (Gen Z/Alpha) group, representing 50% of guests.
Recommendations for Hosts
- Focus marketing internationally, particularly towards travelers from France.
- Tailor amenities and listing descriptions to appeal to the dominant Post-2000s (Gen Z/Alpha) demographic (e.g., highlight fast WiFi, smart home features, local guides).
- Highlight unique local experiences or amenities relevant to the primary guest profile.
- Consider seasonal promotions aligned with peak travel times for key origin markets.
Nearby Short-Term Rental Market Comparison
How does the Oria Airbnb market stack up against its neighbors? Compare key performance metrics like average monthly revenue, ADR, and occupancy rates in surrounding areas to understand the broader regional STR landscape.
| Market | Active Properties | Monthly Revenue | Daily Rate | Avg. Occupancy |
|---|---|---|---|---|
| San Michele Salentino | 74 | $2,208 | $260.22 | 44% |
| Polignano a Mare | 624 | $1,978 | $205.82 | 44% |
| Castellana Grotte | 185 | $1,845 | $219.26 | 43% |
| Ostuni | 1,576 | $1,730 | $250.45 | 39% |
| Ceglie Messapica | 380 | $1,660 | $223.98 | 41% |
| Martina Franca | 569 | $1,657 | $217.67 | 39% |
| Monopoli | 1,141 | $1,637 | $195.75 | 43% |
| Carovigno | 514 | $1,628 | $260.62 | 40% |
| Alberobello | 280 | $1,607 | $189.82 | 38% |
| San Vito dei Normanni | 168 | $1,604 | $219.74 | 43% |