Novoli Airbnb Market Analysis 2025: Short Term Rental Data & Vacation Rental Statistics in Apulia, Italy
Is Airbnb profitable in Novoli in 2025? Explore comprehensive Airbnb analytics for Novoli, Apulia, Italy to uncover income potential. This 2025 STR market report for Novoli, based on AirROI data from April 2024 to March 2025, reveals key trends in the niche market of 22 active listings.
Whether you're considering an Airbnb investment in Novoli, optimizing your existing vacation rental, or exploring rental arbitrage opportunities, understanding the Novoli Airbnb data is crucial. Navigating the high regulation landscape is key to maximizing your short term rental income potential. Let's dive into the specifics.
Key Novoli Airbnb Performance Metrics Overview
Monthly Airbnb Revenue Variations & Income Potential in Novoli (2025)
Understanding the monthly revenue variations for Airbnb listings in Novoli is key to maximizing your short term rental income potential. Seasonality significantly impacts earnings. Our analysis, based on data from the past 12 months, shows that the peak revenue month for STRs in Novoli is typically August, while November often presents the lowest earnings, highlighting opportunities for strategic pricing adjustments during shoulder and low seasons. Explore the typical Airbnb income in Novoli across different performance tiers:
- Best-in-class properties (Top 10%) achieve $2,275+ monthly, often utilizing dynamic pricing and superior guest experiences.
- Strong performing properties (Top 25%) earn $1,124 or more, indicating effective management and desirable locations/amenities.
- Typical properties (Median) generate around $462 per month, representing the average market performance.
- Entry-level properties (Bottom 25%) see earnings around $155, often with potential for optimization.
Average Monthly Airbnb Earnings Trend in Novoli
Novoli Airbnb Occupancy Rate Trends (2025)
Maximize your bookings by understanding the Novoli STR occupancy trends. Seasonal demand shifts significantly influence how often properties are booked. Typically, Augustsees the highest demand (peak season occupancy), while April experiences the lowest (low season). Effective strategies, like adjusting minimum stays or offering promotions, can boost occupancy during slower periods. Here's how different property tiers perform in Novoli:
- Best-in-class properties (Top 10%) achieve 42%+ occupancy, indicating high desirability and potentially optimized availability.
- Strong performing properties (Top 25%) maintain 30% or higher occupancy, suggesting good market fit and guest satisfaction.
- Typical properties (Median) have an occupancy rate around 16%.
- Entry-level properties (Bottom 25%) average 7% occupancy, potentially facing higher vacancy.
Average Monthly Occupancy Rate Trend in Novoli
Average Daily Rate (ADR) Airbnb Trends in Novoli (2025)
Effective short term rental pricing strategy in Novoli involves understanding monthly ADR fluctuations. The Average Daily Rate (ADR) for Airbnb in Novoli typically peaks in November and dips lowest during October. Leveraging Airbnb dynamic pricing tools or strategies based on this seasonality can significantly boost revenue. Here's a look at the typical nightly rates achieved:
- Best-in-class properties (Top 10%) command rates of $246+ per night, often due to premium features or locations.
- Strong performing properties (Top 25%) achieve nightly rates of $144 or more.
- Typical properties (Median) charge around $77 per night.
- Entry-level properties (Bottom 25%) earn around $61 per night.
Average Daily Rate (ADR) Trend by Month in Novoli
Get Live Novoli Market Intelligence 👇

Explore Real-time Analytics
Airbnb Seasonality Analysis & Trends in Novoli (2025)
Peak Season (August, June, July)
- Revenue averages $1,765 per month
- Occupancy rates average 34.7%
- Daily rates average $135
Shoulder Season
- Revenue averages $707 per month
- Occupancy maintains around 17.4%
- Daily rates hold near $131
Low Season (February, March, November)
- Revenue drops to average $269 per month
- Occupancy decreases to average 14.6%
- Daily rates adjust to average $144
Seasonality Insights for Novoli
- The Airbnb seasonality in Novoli shows highly seasonal trends requiring careful strategy. While the sections above show seasonal averages, it's also insightful to look at the extremes:
- During the high season, the absolute peak month showcases Novoli's highest earning potential, with monthly revenues capable of climbing to $2,273, occupancy reaching a high of 44.5%, and ADRs peaking at $146.
- Conversely, the slowest single month of the year, typically falling within the low season, marks the market's lowest point. In this month, revenue might dip to $227, occupancy could drop to 8.9%, and ADRs may adjust down to $122.
- Understanding both the seasonal averages and these monthly peaks and troughs in revenue, occupancy, and ADR is crucial for maximizing your Airbnb profit potential in Novoli.
Seasonal Strategies for Maximizing Profit
- Peak Season: Maximize revenue through premium pricing and potentially longer minimum stays. Ensure high availability.
- Low Season: Offer competitive pricing, special promotions (e.g., extended stay discounts), and flexible cancellation policies. Target off-season travelers like remote workers or budget-conscious guests.
- Shoulder Seasons: Implement dynamic pricing that balances peak and low rates. Target weekend travelers or specific events. Offer slightly more flexible terms than peak season.
- Regularly analyze your own performance against these Novoli seasonality benchmarks and adjust your pricing and availability strategy accordingly.
Best Areas for Airbnb Investment in Novoli (2025)
Exploring the top neighborhoods for short-term rentals in Novoli? This section highlights key areas, outlining why they are attractive for hosts and guests, along with notable local attractions. Consider these locations based on your target guest profile and investment strategy.
| Neighborhood / Area | Why Host Here? (Target Guests & Appeal) | Key Attractions & Landmarks |
|---|---|---|
| Centro Storico | Historical center of Novoli, offering charming streets, local shops, and a glimpse into the local culture. A popular choice for those wanting to explore the authentic Italian experience and local cuisine. | Chiesa di Santa Maria della Misericordia, Piazza Vittorio Emanuele II, Museo della Civiltà Contadina, Castello di Novoli, Local trattorias and gelaterias |
| Parco Naturale di Ugento | A scenic natural park close to Novoli, perfect for outdoor enthusiasts and nature lovers. Great for families and those looking to escape into nature while still being near urban amenities. | Nature trails, Wildlife observation, Picnic areas, Bike rentals, Scenic viewpoints |
| Corte dei Marmi | A beautiful area known for its marble architecture and upscale living. Attracts affluent visitors looking for leisure and relaxation, making it ideal for luxury Airbnb listings. | Beaches, Luxury boutiques, Gourmet restaurants, Cultural festivals, Spas |
| Masseria Le Stanzie | A traditional Apulian farmhouse experience, ideal for tourists wanting an immersive rural getaway, wine tasting, and local culinary experiences. | Wine tours, Cooking classes, Olive oil tastings, Tranquil countryside, Relais and agriturismos |
| Piazza della Libertà | A vibrant square that serves as a hub for local events and social gatherings. Perfect for tourists wanting to experience the local lifestyle and culture. | Weekly markets, Cafés and bistros, Cultural events, Historical monuments, Street performers |
| Via Roma | A lively street with shops, cafes, and restaurants. Attractive for tourists who want an urban feel mixed with local charm, providing easy access to other parts of Novoli. | Local shops, Cafés, Restaurants, Street art, Cultural performances |
| Porta Napoli | An iconic entry point into Novoli, rich in historical significance. A great place for photos and exploring nearby local attractions, refreshing for those interested in history. | Historical gate, Adjacent gardens, Local eateries, Walking tours, Nearby historical sites |
| Piazzetta degli Artisti | A quaint square that is a favorite among locals and tourists for its artistic vibe and community events. An ideal spot for Airbnb hosts catering to creative individuals. | Art exhibitions, Local crafts, Community events, Charming cafes, Open-air performances |
Understanding Airbnb License Requirements & STR Laws in Novoli (2025)
Yes, Novoli, Apulia, Italy enforces high STR regulations. Obtaining a license and ensuring compliance is almost certainly required according to current 2025 STR laws. Always verify the latest short term rental regulations and Airbnb license requirements directly with local government authorities for Novoli to ensure full compliance before hosting.
(Source: AirROI data, 2025, based on 45% licensed listings)
Top Performing Airbnb Properties in Novoli (2025)
Benchmark your potential! Explore examples of top-performing Airbnb properties in Novolibased on Trailing Twelve Month (TTM) revenue. Analyze their characteristics, revenue, occupancy rate, and ADR to understand what drives success in this market.
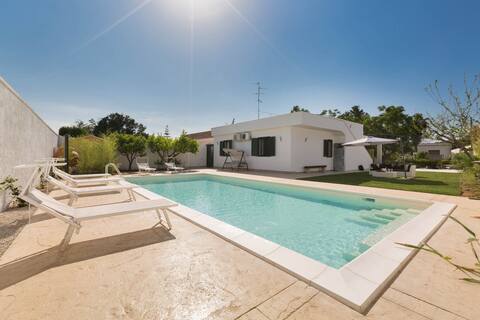
1163 Villa Chiaraluna
Entire Place • 4 bedrooms
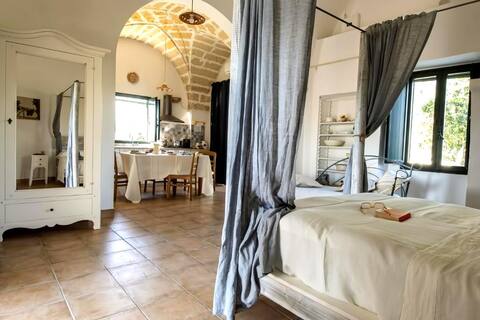
Casa Acanto: Botanical Garden with Pool
Entire Place • 2 bedrooms

LA CASETTA Novoli ( LECCE ) Salento
Entire Place • 2 bedrooms

Appartamento Superior
Entire Place • 2 bedrooms
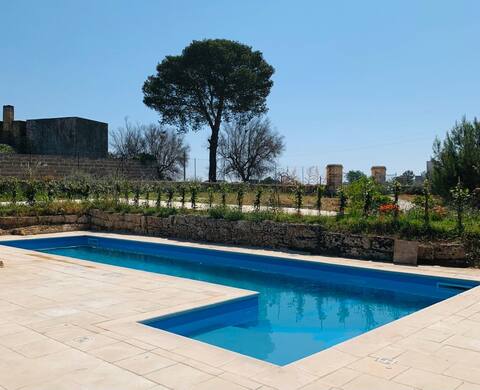
Fata Bianca: botanical garden pool and jacuzzi
Entire Place • 3 bedrooms
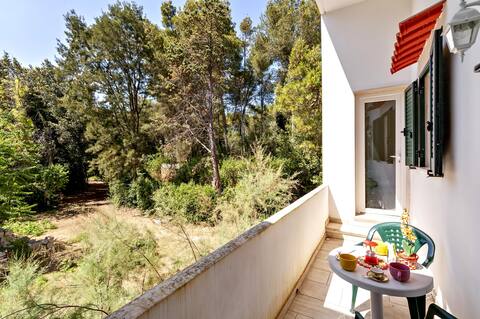
palm dwellings, Puglia
Entire Place • 2 bedrooms
Note: Performance varies based on location, size, amenities, seasonality, and management quality. Data reflects the past 12 months.
Top Performing Airbnb Hosts in Novoli (2025)
Learn from the best! This table showcases top-performing Airbnb hosts in Novoli based on the number of properties managed and estimated total revenue over the past year. Analyze their scale and performance metrics.
| Host Name | Properties | Grossing Revenue | Stay Reviews | Avg Rating |
|---|---|---|---|---|
| Antonio Santo | 3 | $33,540 | 33 | 4.89/5.0 |
| Host #9632167 | 1 | $22,621 | 11 | 5.00/5.0 |
| Anna Luana | 1 | $14,119 | 8 | 5.00/5.0 |
| Margherita | 1 | $10,977 | 8 | 5.00/5.0 |
| Maria | 1 | $6,357 | 132 | 4.79/5.0 |
| Antonio | 1 | $6,042 | 20 | 4.90/5.0 |
| Host #475129978 | 3 | $5,980 | 3 | 0.00/5.0 |
| Mattia | 2 | $5,311 | 6 | 4.33/5.0 |
| Host #457587168 | 1 | $4,938 | 0 | 0.00/5.0 |
| Host #41399898 | 1 | $4,386 | 0 | 0.00/5.0 |
Analyzing the strategies of top hosts, such as their property selection, pricing, and guest communication, can offer valuable lessons for optimizing your own Airbnb operations in Novoli.
Dive Deeper: Advanced Novoli STR Market Data (2025)
Ready to unlock more insights? AirROI provides access to advanced metrics and comprehensive Airbnb data for Novoli. Explore detailed analytics beyond this report to refine your investment strategy, optimize pricing, and maximize your vacation rental profits.
Explore Advanced MetricsNovoli Short-Term Rental Market Composition (2025): Property & Room Types
Room Type Distribution
Property Type Distribution
Market Composition Insights for Novoli
- The Novoli Airbnb market composition is heavily skewed towards Entire Home/Apt listings, which make up 59.1% of the 22 active rentals. This indicates strong guest preference for privacy and space.
- However, a notable 40.9% share for Private Rooms suggests opportunities for budget-conscious travelers or hosts renting out spare rooms.
- Looking at the property type distribution in Novoli, House properties are the most common (54.5%), reflecting the local real estate landscape.
- Houses represent a significant 54.5% portion, catering likely to families or larger groups.
- The presence of 27.3% Hotel/Boutique listings indicates integration with traditional hospitality.
Novoli Airbnb Room Capacity Analysis (2025): Bedroom Distribution
Distribution of Listings by Number of Bedrooms
Room Capacity Insights for Novoli
- The dominant room capacity in Novoli is 2 bedrooms listings, making up 40.9% of the market. This suggests a strong demand for properties suitable for couples or solo travelers.
- Together, 2 bedrooms and 1 bedroom properties represent 63.6% of the active Airbnb listings in Novoli, indicating a high concentration in these sizes.
- A significant 27.2% of listings offer 3+ bedrooms, catering to larger groups and families seeking more space in Novoli.
Novoli Vacation Rental Guest Capacity Trends (2025)
Distribution of Listings by Guest Capacity
Guest Capacity Insights for Novoli
- The most common guest capacity trend in Novoli vacation rentals is listings accommodating 6 guests (22.7%). This suggests the primary traveler segment is likely larger groups.
- Properties designed for 6 guests and 4 guests dominate the Novoli STR market, accounting for 40.9% of listings.
- 45.4% of properties accommodate 6+ guests, serving the market segment for larger families or group travel in Novoli.
- On average, properties in Novoli are equipped to host 4.7 guests.
Novoli Airbnb Booking Patterns (2025): Available vs. Booked Days
Available Days Distribution
Booked Days Distribution
Booking Pattern Insights for Novoli
- The most common availability pattern in Novoli falls within the 271-366 days range, representing 90.9% of listings. This suggests many properties have significant open periods on their calendars.
- Approximately 95.4% of listings show high availability (181+ days open annually), indicating potential for increased bookings or specific owner usage patterns.
- For booked days, the 1-30 days range is most frequent in Novoli (54.5%), reflecting common guest stay durations or potential owner blocking patterns.
- A notable 4.5% of properties secure long booking periods (181+ days booked per year), highlighting successful long-term rental strategies or significant owner usage.
Novoli Airbnb Minimum Stay Requirements Analysis
Distribution of Listings by Minimum Night Requirement
1 Night
4 listings
19% of total
2 Nights
5 listings
23.8% of total
3 Nights
5 listings
23.8% of total
4-6 Nights
1 listings
4.8% of total
7-29 Nights
5 listings
23.8% of total
30+ Nights
1 listings
4.8% of total
Key Insights
- The most prevalent minimum stay requirement in Novoli is 2 Nights, adopted by 23.8% of listings. This highlights the market's preference for shorter, flexible bookings.
Recommendations
- Align with the market by considering a 2 Nights minimum stay, as 23.8% of Novoli hosts use this setting.
- If feasible, allowing 1-night stays, especially midweek or during low season, could capture last-minute bookings, as only 19% currently do.
- Adjust minimum nights based on seasonality – potentially shorter during low season and longer during peak demand periods in Novoli.
Novoli Airbnb Cancellation Policy Trends Analysis (2025)
Flexible
6 listings
46.2% of total
Moderate
5 listings
38.5% of total
Strict
2 listings
15.4% of total
Cancellation Policy Insights for Novoli
- The prevailing Airbnb cancellation policy trend in Novoli is Flexible, used by 46.2% of listings.
- The market strongly favors guest-friendly terms, with 84.7% of listings offering Flexible or Moderate policies. This suggests guests in Novoli may expect booking flexibility.
Recommendations for Hosts
- Consider adopting a Flexible policy to align with the 46.2% market standard in Novoli.
- Regularly review your cancellation policy against competitors and market demand shifts in Novoli.
Novoli STR Booking Lead Time Analysis (2025)
Average Booking Lead Time by Month
Booking Lead Time Insights for Novoli
- The overall average booking lead time for vacation rentals in Novoli is 60 days.
- Guests book furthest in advance for stays during March (average 74 days), likely coinciding with peak travel demand or local events.
- The shortest booking windows occur for stays in February (average 0 days), indicating more last-minute travel plans during this time.
- Seasonally, Summer (70 days avg.) sees the longest lead times, while Winter (44 days avg.) has the shortest, reflecting typical travel planning cycles.
Recommendations for Hosts
- Use the overall average lead time (60 days) as a baseline for your pricing and availability strategy in Novoli.
- For March stays, consider implementing length-of-stay discounts or slightly higher rates for bookings made less than 74 days out to capitalize on advance planning.
- During February, focus on last-minute booking availability and promotions, as guests book with very short notice (0 days avg.).
- Target marketing efforts for the Summer season well in advance (at least 70 days) to capture early planners.
- Monitor your own booking lead times against these Novoli averages to identify opportunities for dynamic pricing adjustments.
Popular & Essential Airbnb Amenities in Novoli (2025)
Amenity Prevalence
Amenity Insights for Novoli
- Essential amenities in Novoli that guests expect include: Wifi, Air conditioning, TV. Lacking these (any) could significantly impact bookings.
- Popular amenities like Essentials, Heating, Washer are common but not universal. Offering these can provide a competitive edge.
Recommendations for Hosts
- Ensure your listing includes all essential amenities for Novoli: Wifi, Air conditioning, TV.
- Prioritize adding missing essentials: Wifi, Air conditioning, TV.
- Consider adding popular differentiators like Essentials or Heating to increase appeal.
- Highlight unique or less common amenities you offer (e.g., hot tub, dedicated workspace, EV charger) in your listing description and photos.
- Regularly check competitor amenities in Novoli to stay competitive.
Novoli Airbnb Guest Demographics & Profile Analysis (2025)
Guest Profile Summary for Novoli
- The typical guest profile for Airbnb in Novoli consists of predominantly international visitors (79%), with top international origins including Italy, typically belonging to the Post-2000s (Gen Z/Alpha) group (50%), primarily speaking English or French.
- Domestic travelers account for 20.8% of guests.
- Key international markets include France (34%) and Italy (20.8%).
- Top languages spoken are English (42.4%) followed by French (20.3%).
- A significant demographic segment is the Post-2000s (Gen Z/Alpha) group, representing 50% of guests.
Recommendations for Hosts
- Focus marketing internationally, particularly towards travelers from Italy.
- Tailor amenities and listing descriptions to appeal to the dominant Post-2000s (Gen Z/Alpha) demographic (e.g., highlight fast WiFi, smart home features, local guides).
- Highlight unique local experiences or amenities relevant to the primary guest profile.
- Consider seasonal promotions aligned with peak travel times for key origin markets.
Nearby Short-Term Rental Market Comparison
How does the Novoli Airbnb market stack up against its neighbors? Compare key performance metrics like average monthly revenue, ADR, and occupancy rates in surrounding areas to understand the broader regional STR landscape.
| Market | Active Properties | Monthly Revenue | Daily Rate | Avg. Occupancy |
|---|---|---|---|---|
| Kassopaia Municipal Unit | 520 | $2,555 | $278.54 | 55% |
| Afra | 15 | $2,551 | $306.19 | 54% |
| Agios Markos | 14 | $2,526 | $240.28 | 48% |
| San Michele Salentino | 74 | $2,208 | $260.22 | 44% |
| Spartilas | 27 | $2,202 | $317.90 | 50% |
| Perithia | 54 | $2,092 | $267.76 | 43% |
| Kokkini | 11 | $2,038 | $178.70 | 55% |
| Kira Chrisikou | 41 | $2,034 | $443.23 | 42% |
| Polignano a Mare | 624 | $1,978 | $205.82 | 44% |
| Kamara | 14 | $1,890 | $184.93 | 49% |