Mottola Airbnb Market Analysis 2025: Short Term Rental Data & Vacation Rental Statistics in Apulia, Italy
Is Airbnb profitable in Mottola in 2025? Explore comprehensive Airbnb analytics for Mottola, Apulia, Italy to uncover income potential. This 2025 STR market report for Mottola, based on AirROI data from April 2024 to March 2025, reveals key trends in the niche market of 27 active listings.
Whether you're considering an Airbnb investment in Mottola, optimizing your existing vacation rental, or exploring rental arbitrage opportunities, understanding the Mottola Airbnb data is crucial. Navigating the high regulation landscape is key to maximizing your short term rental income potential. Let's dive into the specifics.
Key Mottola Airbnb Performance Metrics Overview
Monthly Airbnb Revenue Variations & Income Potential in Mottola (2025)
Understanding the monthly revenue variations for Airbnb listings in Mottola is key to maximizing your short term rental income potential. Seasonality significantly impacts earnings. Our analysis, based on data from the past 12 months, shows that the peak revenue month for STRs in Mottola is typically May, while March often presents the lowest earnings, highlighting opportunities for strategic pricing adjustments during shoulder and low seasons. Explore the typical Airbnb income in Mottola across different performance tiers:
- Best-in-class properties (Top 10%) achieve $1,973+ monthly, often utilizing dynamic pricing and superior guest experiences.
- Strong performing properties (Top 25%) earn $904 or more, indicating effective management and desirable locations/amenities.
- Typical properties (Median) generate around $388 per month, representing the average market performance.
- Entry-level properties (Bottom 25%) see earnings around $191, often with potential for optimization.
Average Monthly Airbnb Earnings Trend in Mottola
Mottola Airbnb Occupancy Rate Trends (2025)
Maximize your bookings by understanding the Mottola STR occupancy trends. Seasonal demand shifts significantly influence how often properties are booked. Typically, Augustsees the highest demand (peak season occupancy), while June experiences the lowest (low season). Effective strategies, like adjusting minimum stays or offering promotions, can boost occupancy during slower periods. Here's how different property tiers perform in Mottola:
- Best-in-class properties (Top 10%) achieve 40%+ occupancy, indicating high desirability and potentially optimized availability.
- Strong performing properties (Top 25%) maintain 27% or higher occupancy, suggesting good market fit and guest satisfaction.
- Typical properties (Median) have an occupancy rate around 11%.
- Entry-level properties (Bottom 25%) average 6% occupancy, potentially facing higher vacancy.
Average Monthly Occupancy Rate Trend in Mottola
Average Daily Rate (ADR) Airbnb Trends in Mottola (2025)
Effective short term rental pricing strategy in Mottola involves understanding monthly ADR fluctuations. The Average Daily Rate (ADR) for Airbnb in Mottola typically peaks in August and dips lowest during December. Leveraging Airbnb dynamic pricing tools or strategies based on this seasonality can significantly boost revenue. Here's a look at the typical nightly rates achieved:
- Best-in-class properties (Top 10%) command rates of $217+ per night, often due to premium features or locations.
- Strong performing properties (Top 25%) achieve nightly rates of $109 or more.
- Typical properties (Median) charge around $80 per night.
- Entry-level properties (Bottom 25%) earn around $61 per night.
Average Daily Rate (ADR) Trend by Month in Mottola
Get Live Mottola Market Intelligence 👇

Explore Real-time Analytics
Airbnb Seasonality Analysis & Trends in Mottola (2025)
Peak Season (May, April, August)
- Revenue averages $1,290 per month
- Occupancy rates average 22.8%
- Daily rates average $124
Shoulder Season
- Revenue averages $625 per month
- Occupancy maintains around 16.4%
- Daily rates hold near $115
Low Season (February, March, November)
- Revenue drops to average $413 per month
- Occupancy decreases to average 17.7%
- Daily rates adjust to average $102
Seasonality Insights for Mottola
- The Airbnb seasonality in Mottola shows highly seasonal trends requiring careful strategy. While the sections above show seasonal averages, it's also insightful to look at the extremes:
- During the high season, the absolute peak month showcases Mottola's highest earning potential, with monthly revenues capable of climbing to $1,487, occupancy reaching a high of 28.7%, and ADRs peaking at $134.
- Conversely, the slowest single month of the year, typically falling within the low season, marks the market's lowest point. In this month, revenue might dip to $405, occupancy could drop to 11.8%, and ADRs may adjust down to $98.
- Understanding both the seasonal averages and these monthly peaks and troughs in revenue, occupancy, and ADR is crucial for maximizing your Airbnb profit potential in Mottola.
Seasonal Strategies for Maximizing Profit
- Peak Season: Maximize revenue through premium pricing and potentially longer minimum stays. Ensure high availability.
- Low Season: Offer competitive pricing, special promotions (e.g., extended stay discounts), and flexible cancellation policies. Target off-season travelers like remote workers or budget-conscious guests.
- Shoulder Seasons: Implement dynamic pricing that balances peak and low rates. Target weekend travelers or specific events. Offer slightly more flexible terms than peak season.
- Regularly analyze your own performance against these Mottola seasonality benchmarks and adjust your pricing and availability strategy accordingly.
Best Areas for Airbnb Investment in Mottola (2025)
Exploring the top neighborhoods for short-term rentals in Mottola? This section highlights key areas, outlining why they are attractive for hosts and guests, along with notable local attractions. Consider these locations based on your target guest profile and investment strategy.
| Neighborhood / Area | Why Host Here? (Target Guests & Appeal) | Key Attractions & Landmarks |
|---|---|---|
| Historic Center | Charming medieval town center featuring traditional Apulian architecture, local markets, and historical sites. Ideal for tourists looking to explore local culture and history. | Castle of Mottola, Church of St. Nicholas, Mottola Historical Museum, Piazza Vittorio Emanuele II |
| Countryside Retreats | Beautiful rural areas surrounding Mottola, known for olive groves and vineyards, offering a peaceful escape for those seeking relaxation and nature. | Olive groves, Local wineries, Scenic walking trails, Agriturismo experiences |
| Coastal Proximity | Nearby coastal areas provide access to beautiful beaches of Apulia, attracting visitors seeking sun and sea. Ideal for summer vacation rentals. | Marina di Ginosa Beach, Castellaneta Marina, Torre Colimena, Charming coastal villages |
| Cultural Festivals | Mottola hosts various cultural events and festivals throughout the year, attracting visitors for unique experiences and local cuisine. | Festival of St. Nicholas, Local food festivals, Artisan markets, Music events |
| Gastronomic Delights | Famous for its local cuisine, Mottola attracts food lovers looking to indulge in traditional Apulian dishes and products. | Local trattorias, Cheese and wine tastings, Cooking classes, Food tours |
| Cycling Routes | The region offers scenic cycling routes through beautiful landscapes, appealing to adventure seekers and active tourists. | Cycling trails, Nature parks, Biking events, Wildlife observation |
| Religious Tourism | Mottola is known for its churches and religious heritage, drawing visitors interested in spirituality and pilgrimage. | Sanctuary of St. Nicholas, Church of San Francesco, Cultural heritage sites, Historical chapels |
| Wine and Olive Oil Tours | Apulia is famous for its wine and olive oil production. Visitors often seek tours to taste and learn about local products. | Winery tours, Olive oil tastings, Vineyard visits, Gastronomic fairs |
Understanding Airbnb License Requirements & STR Laws in Mottola (2025)
Yes, Mottola, Apulia, Italy enforces high STR regulations. Obtaining a license and ensuring compliance is almost certainly required according to current 2025 STR laws. Always verify the latest short term rental regulations and Airbnb license requirements directly with local government authorities for Mottola to ensure full compliance before hosting.
(Source: AirROI data, 2025, based on 37% licensed listings)
Top Performing Airbnb Properties in Mottola (2025)
Benchmark your potential! Explore examples of top-performing Airbnb properties in Mottolabased on Trailing Twelve Month (TTM) revenue. Analyze their characteristics, revenue, occupancy rate, and ADR to understand what drives success in this market.
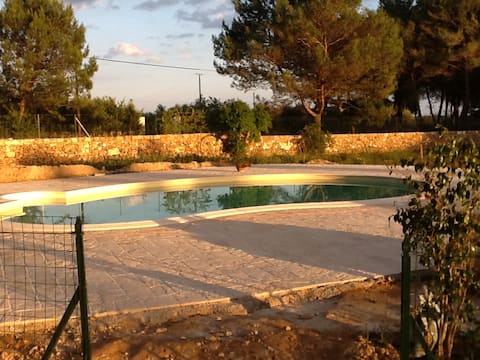
Villa with swimmingpool (whole house)
Entire Place • 9 bedrooms
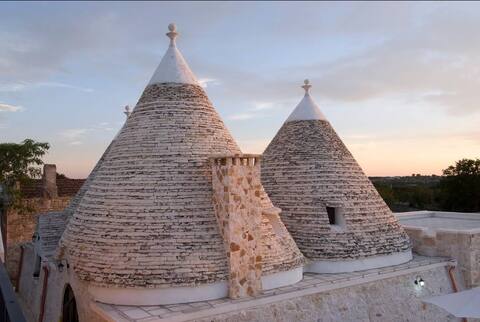
Trulli allegretti - Casa vacanze Trulli Pumi
Entire Place • 1 bedroom
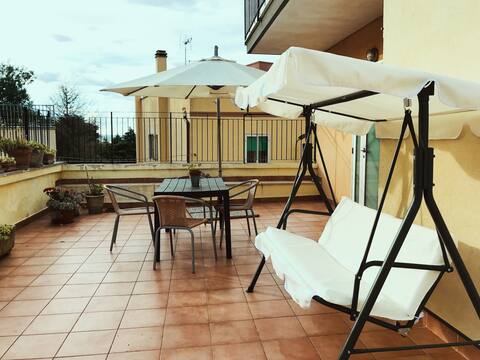
Refuge in Mottola
Entire Place • 2 bedrooms

Sunshine home
Entire Place • 1 bedroom
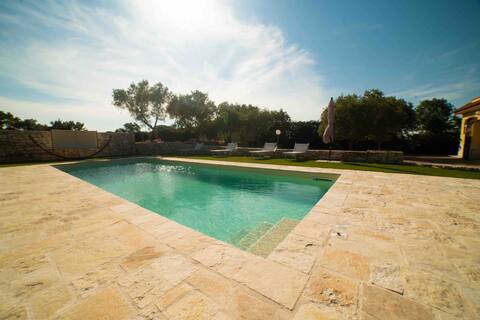
Villa Patrizia-Luxury Villa
Entire Place • 4 bedrooms
Centrally located apartment
Entire Place • 2 bedrooms
Note: Performance varies based on location, size, amenities, seasonality, and management quality. Data reflects the past 12 months.
Top Performing Airbnb Hosts in Mottola (2025)
Learn from the best! This table showcases top-performing Airbnb hosts in Mottola based on the number of properties managed and estimated total revenue over the past year. Analyze their scale and performance metrics.
| Host Name | Properties | Grossing Revenue | Stay Reviews | Avg Rating |
|---|---|---|---|---|
| Cristina | 1 | $26,289 | 4 | 4.75/5.0 |
| Host #252819689 | 1 | $18,434 | 0 | 0.00/5.0 |
| Marta | 1 | $7,647 | 27 | 4.74/5.0 |
| Host #9632167 | 5 | $7,447 | 0 | 0.00/5.0 |
| Claudia | 1 | $6,902 | 3 | 5.00/5.0 |
| Francesco | 2 | $6,696 | 13 | 2.50/5.0 |
| Patrizio | 2 | $3,892 | 15 | 4.33/5.0 |
| Domenico | 1 | $3,633 | 3 | 5.00/5.0 |
| Francesco Paolo | 1 | $3,601 | 29 | 4.76/5.0 |
| Jessica | 1 | $3,587 | 3 | 5.00/5.0 |
Analyzing the strategies of top hosts, such as their property selection, pricing, and guest communication, can offer valuable lessons for optimizing your own Airbnb operations in Mottola.
Dive Deeper: Advanced Mottola STR Market Data (2025)
Ready to unlock more insights? AirROI provides access to advanced metrics and comprehensive Airbnb data for Mottola. Explore detailed analytics beyond this report to refine your investment strategy, optimize pricing, and maximize your vacation rental profits.
Explore Advanced MetricsMottola Short-Term Rental Market Composition (2025): Property & Room Types
Room Type Distribution
Property Type Distribution
Market Composition Insights for Mottola
- The Mottola Airbnb market composition is heavily skewed towards Entire Home/Apt listings, which make up 63% of the 27 active rentals. This indicates strong guest preference for privacy and space.
- However, a notable 37% share for Private Rooms suggests opportunities for budget-conscious travelers or hosts renting out spare rooms.
- Looking at the property type distribution in Mottola, House properties are the most common (29.6%), reflecting the local real estate landscape.
- Houses represent a significant 29.6% portion, catering likely to families or larger groups.
- The presence of 11.1% Hotel/Boutique listings indicates integration with traditional hospitality.
- Smaller segments like unique stays (combined 3.7%) offer potential for unique stay experiences.
Mottola Airbnb Room Capacity Analysis (2025): Bedroom Distribution
Distribution of Listings by Number of Bedrooms
Room Capacity Insights for Mottola
- The dominant room capacity in Mottola is 1 bedroom listings, making up 55.6% of the market. This suggests a strong demand for properties suitable for couples or solo travelers.
- Together, 1 bedroom and 2 bedrooms properties represent 77.8% of the active Airbnb listings in Mottola, indicating a high concentration in these sizes.
- With over half the market (55.6%) consisting of studios or 1-bedroom units, Mottola is particularly well-suited for individuals or couples.
Mottola Vacation Rental Guest Capacity Trends (2025)
Distribution of Listings by Guest Capacity
Guest Capacity Insights for Mottola
- The most common guest capacity trend in Mottola vacation rentals is listings accommodating 2 guests (25.9%). This suggests the primary traveler segment is likely couples or solo travelers.
- Properties designed for 2 guests and 4 guests dominate the Mottola STR market, accounting for 51.8% of listings.
- 11.1% of properties accommodate 6+ guests, serving the market segment for larger families or group travel in Mottola.
- On average, properties in Mottola are equipped to host 3.3 guests.
Mottola Airbnb Booking Patterns (2025): Available vs. Booked Days
Available Days Distribution
Booked Days Distribution
Booking Pattern Insights for Mottola
- The most common availability pattern in Mottola falls within the 271-366 days range, representing 96.3% of listings. This suggests many properties have significant open periods on their calendars.
- Approximately 100.0% of listings show high availability (181+ days open annually), indicating potential for increased bookings or specific owner usage patterns.
- For booked days, the 1-30 days range is most frequent in Mottola (63%), reflecting common guest stay durations or potential owner blocking patterns.
Mottola Airbnb Minimum Stay Requirements Analysis
Distribution of Listings by Minimum Night Requirement
1 Night
6 listings
23.1% of total
2 Nights
3 listings
11.5% of total
3 Nights
7 listings
26.9% of total
4-6 Nights
1 listings
3.8% of total
7-29 Nights
8 listings
30.8% of total
30+ Nights
1 listings
3.8% of total
Key Insights
- The most prevalent minimum stay requirement in Mottola is 7-29 Nights, adopted by 30.8% of listings. This highlights the market's preference for shorter, flexible bookings.
Recommendations
- Align with the market by considering a 7-29 Nights minimum stay, as 30.8% of Mottola hosts use this setting.
- If feasible, allowing 1-night stays, especially midweek or during low season, could capture last-minute bookings, as only 23.1% currently do.
- Adjust minimum nights based on seasonality – potentially shorter during low season and longer during peak demand periods in Mottola.
Mottola Airbnb Cancellation Policy Trends Analysis (2025)
Flexible
8 listings
57.1% of total
Moderate
3 listings
21.4% of total
Strict
3 listings
21.4% of total
Cancellation Policy Insights for Mottola
- The prevailing Airbnb cancellation policy trend in Mottola is Flexible, used by 57.1% of listings.
- The market strongly favors guest-friendly terms, with 78.5% of listings offering Flexible or Moderate policies. This suggests guests in Mottola may expect booking flexibility.
Recommendations for Hosts
- Consider adopting a Flexible policy to align with the 57.1% market standard in Mottola.
- Given the high prevalence of Flexible policies (57.1%), offering this can enhance booking appeal, especially during shoulder seasons.
- Regularly review your cancellation policy against competitors and market demand shifts in Mottola.
Mottola STR Booking Lead Time Analysis (2025)
Average Booking Lead Time by Month
Booking Lead Time Insights for Mottola
- The overall average booking lead time for vacation rentals in Mottola is 34 days.
- Guests book furthest in advance for stays during October (average 135 days), likely coinciding with peak travel demand or local events.
- The shortest booking windows occur for stays in November (average 2 days), indicating more last-minute travel plans during this time.
- Seasonally, Fall (65 days avg.) sees the longest lead times, while Winter (14 days avg.) has the shortest, reflecting typical travel planning cycles.
Recommendations for Hosts
- Use the overall average lead time (34 days) as a baseline for your pricing and availability strategy in Mottola.
- For October stays, consider implementing length-of-stay discounts or slightly higher rates for bookings made less than 135 days out to capitalize on advance planning.
- During November, focus on last-minute booking availability and promotions, as guests book with very short notice (2 days avg.).
- Target marketing efforts for the Fall season well in advance (at least 65 days) to capture early planners.
- Monitor your own booking lead times against these Mottola averages to identify opportunities for dynamic pricing adjustments.
Popular & Essential Airbnb Amenities in Mottola (2025)
Amenity Prevalence
Amenity Insights for Mottola
- Popular amenities like TV, Kitchen, Heating are common but not universal. Offering these can provide a competitive edge.
- Warning: Wifi is not universally provided but is considered essential globally. Ensure reliable Wifi is offered.
Recommendations for Hosts
- Consider adding popular differentiators like TV or Kitchen to increase appeal.
- Highlight unique or less common amenities you offer (e.g., hot tub, dedicated workspace, EV charger) in your listing description and photos.
- Regularly check competitor amenities in Mottola to stay competitive.
Mottola Airbnb Guest Demographics & Profile Analysis (2025)
Guest Profile Summary for Mottola
- The typical guest profile for Airbnb in Mottola consists of a mix of domestic (37%) and international guests, with top international origins including France, typically belonging to the Post-2000s (Gen Z/Alpha) group (50%), primarily speaking French or English.
- Domestic travelers account for 36.8% of guests.
- Key international markets include Italy (36.8%) and France (21.1%).
- Top languages spoken are French (28.1%) followed by English (28.1%).
- A significant demographic segment is the Post-2000s (Gen Z/Alpha) group, representing 50% of guests.
Recommendations for Hosts
- Focus marketing internationally, particularly towards travelers from France.
- Offer listing details and communication support in French.
- Tailor amenities and listing descriptions to appeal to the dominant Post-2000s (Gen Z/Alpha) demographic (e.g., highlight fast WiFi, smart home features, local guides).
- Highlight unique local experiences or amenities relevant to the primary guest profile.
- Consider seasonal promotions aligned with peak travel times for key origin markets.
Nearby Short-Term Rental Market Comparison
How does the Mottola Airbnb market stack up against its neighbors? Compare key performance metrics like average monthly revenue, ADR, and occupancy rates in surrounding areas to understand the broader regional STR landscape.
| Market | Active Properties | Monthly Revenue | Daily Rate | Avg. Occupancy |
|---|---|---|---|---|
| San Michele Salentino | 74 | $2,208 | $260.22 | 44% |
| Polignano a Mare | 624 | $1,978 | $205.82 | 44% |
| Castellana Grotte | 185 | $1,845 | $219.26 | 43% |
| Ostuni | 1,576 | $1,730 | $250.45 | 39% |
| Ceglie Messapica | 380 | $1,660 | $223.98 | 41% |
| Martina Franca | 569 | $1,657 | $217.67 | 39% |
| Monopoli | 1,141 | $1,637 | $195.75 | 43% |
| Carovigno | 514 | $1,628 | $260.62 | 40% |
| Alberobello | 280 | $1,607 | $189.82 | 38% |
| San Vito dei Normanni | 168 | $1,604 | $219.74 | 43% |