Conversano Airbnb Market Analysis 2025: Short Term Rental Data & Vacation Rental Statistics in Apulia, Italy
Is Airbnb profitable in Conversano in 2025? Explore comprehensive Airbnb analytics for Conversano, Apulia, Italy to uncover income potential. This 2025 STR market report for Conversano, based on AirROI data from April 2024 to March 2025, reveals key trends in the niche market of 152 active listings.
Whether you're considering an Airbnb investment in Conversano, optimizing your existing vacation rental, or exploring rental arbitrage opportunities, understanding the Conversano Airbnb data is crucial. Navigating the high regulation landscape is key to maximizing your short term rental income potential. Let's dive into the specifics.
Key Conversano Airbnb Performance Metrics Overview
Monthly Airbnb Revenue Variations & Income Potential in Conversano (2025)
Understanding the monthly revenue variations for Airbnb listings in Conversano is key to maximizing your short term rental income potential. Seasonality significantly impacts earnings. Our analysis, based on data from the past 12 months, shows that the peak revenue month for STRs in Conversano is typically August, while February often presents the lowest earnings, highlighting opportunities for strategic pricing adjustments during shoulder and low seasons. Explore the typical Airbnb income in Conversano across different performance tiers:
- Best-in-class properties (Top 10%) achieve $3,567+ monthly, often utilizing dynamic pricing and superior guest experiences.
- Strong performing properties (Top 25%) earn $1,952 or more, indicating effective management and desirable locations/amenities.
- Typical properties (Median) generate around $976 per month, representing the average market performance.
- Entry-level properties (Bottom 25%) see earnings around $448, often with potential for optimization.
Average Monthly Airbnb Earnings Trend in Conversano
Conversano Airbnb Occupancy Rate Trends (2025)
Maximize your bookings by understanding the Conversano STR occupancy trends. Seasonal demand shifts significantly influence how often properties are booked. Typically, Augustsees the highest demand (peak season occupancy), while February experiences the lowest (low season). Effective strategies, like adjusting minimum stays or offering promotions, can boost occupancy during slower periods. Here's how different property tiers perform in Conversano:
- Best-in-class properties (Top 10%) achieve 66%+ occupancy, indicating high desirability and potentially optimized availability.
- Strong performing properties (Top 25%) maintain 50% or higher occupancy, suggesting good market fit and guest satisfaction.
- Typical properties (Median) have an occupancy rate around 28%.
- Entry-level properties (Bottom 25%) average 13% occupancy, potentially facing higher vacancy.
Average Monthly Occupancy Rate Trend in Conversano
Average Daily Rate (ADR) Airbnb Trends in Conversano (2025)
Effective short term rental pricing strategy in Conversano involves understanding monthly ADR fluctuations. The Average Daily Rate (ADR) for Airbnb in Conversano typically peaks in August and dips lowest during November. Leveraging Airbnb dynamic pricing tools or strategies based on this seasonality can significantly boost revenue. Here's a look at the typical nightly rates achieved:
- Best-in-class properties (Top 10%) command rates of $245+ per night, often due to premium features or locations.
- Strong performing properties (Top 25%) achieve nightly rates of $154 or more.
- Typical properties (Median) charge around $98 per night.
- Entry-level properties (Bottom 25%) earn around $74 per night.
Average Daily Rate (ADR) Trend by Month in Conversano
Get Live Conversano Market Intelligence 👇

Explore Real-time Analytics
Airbnb Seasonality Analysis & Trends in Conversano (2025)
Peak Season (August, July, May)
- Revenue averages $2,743 per month
- Occupancy rates average 45.6%
- Daily rates average $161
Shoulder Season
- Revenue averages $1,645 per month
- Occupancy maintains around 32.9%
- Daily rates hold near $148
Low Season (January, February, March)
- Revenue drops to average $612 per month
- Occupancy decreases to average 20.4%
- Daily rates adjust to average $144
Seasonality Insights for Conversano
- The Airbnb seasonality in Conversano shows highly seasonal trends requiring careful strategy. While the sections above show seasonal averages, it's also insightful to look at the extremes:
- During the high season, the absolute peak month showcases Conversano's highest earning potential, with monthly revenues capable of climbing to $3,114, occupancy reaching a high of 51.5%, and ADRs peaking at $169.
- Conversely, the slowest single month of the year, typically falling within the low season, marks the market's lowest point. In this month, revenue might dip to $449, occupancy could drop to 18.1%, and ADRs may adjust down to $137.
- Understanding both the seasonal averages and these monthly peaks and troughs in revenue, occupancy, and ADR is crucial for maximizing your Airbnb profit potential in Conversano.
Seasonal Strategies for Maximizing Profit
- Peak Season: Maximize revenue through premium pricing and potentially longer minimum stays. Ensure high availability.
- Low Season: Offer competitive pricing, special promotions (e.g., extended stay discounts), and flexible cancellation policies. Target off-season travelers like remote workers or budget-conscious guests.
- Shoulder Seasons: Implement dynamic pricing that balances peak and low rates. Target weekend travelers or specific events. Offer slightly more flexible terms than peak season.
- Regularly analyze your own performance against these Conversano seasonality benchmarks and adjust your pricing and availability strategy accordingly.
Best Areas for Airbnb Investment in Conversano (2025)
Exploring the top neighborhoods for short-term rentals in Conversano? This section highlights key areas, outlining why they are attractive for hosts and guests, along with notable local attractions. Consider these locations based on your target guest profile and investment strategy.
| Neighborhood / Area | Why Host Here? (Target Guests & Appeal) | Key Attractions & Landmarks |
|---|---|---|
| Centro Storico | The historic center of Conversano, rich in medieval architecture and charming streets. It attracts tourists interested in history, culture, and local cuisine. | Conversano Castle, Cathedral of Conversano, Piazza Castello, Monastero di San Benedetto, Museo Archeologico, Palazzo dei Benedettini |
| Torre a Mare | Beautiful coastal area known for its stunning beaches and scenic views. Popular among families and beachgoers looking for relaxation and leisure activities. | Torre a Mare beaches, Lido San Francesco, Walking paths along the coast, Local seafood restaurants, Seaside promenade |
| Polignano a Mare | Nearby town famous for its breathtaking cliffs and sea views. Attracts tourists from all over for its picturesque scenery and beautiful beaches. | Piazza Vittorio Emanuele II, Lama Monachile beach, Grotta Palazzese, Old Town, Domenico Modugno statue |
| Gravina di Puglia | A bit further but known for its stunning ravines and historical significance. Offers a unique experience for those interested in exploration and nature. | Gravina di Puglia Cathedral, Rock churches, Roman Bridge, Archaeological Park, Natural trails |
| Gioia del Colle | Famous for its castles and rich history, offers an alternative for guests looking for cultural experiences away from tourist crowds. | Castello Normanno-Svevo, Fasanese Museum, Local vineyards, Historical center, Viniculture events |
| Alberobello | Famous for its Trulli houses, a UNESCO World Heritage Site. An iconic location that attracts many visitors looking to experience unique architecture. | Trulli houses, Trullo Sovrano, Alberobello's parks, Local artisan shops, Cultural events |
| Monopoli | Charming coastal town with beautiful beaches and a lively old town. Popular for its favorable mix of relaxing beach life and cultural exploration. | Monopoli beaches, Historic center, Castello Carlo V, Seafood markets, Local festivals |
| Selva di Fasano | Known for its natural parks and proximity to various attractions. Ideal for those who want to enjoy nature and tranquility while still being close to key sites. | Theme parks, Nature reserves, Walking trails, Viewpoints, Local wildlife |
Understanding Airbnb License Requirements & STR Laws in Conversano (2025)
Yes, Conversano, Apulia, Italy enforces high STR regulations. Obtaining a license and ensuring compliance is almost certainly required according to current 2025 STR laws. Always verify the latest short term rental regulations and Airbnb license requirements directly with local government authorities for Conversano to ensure full compliance before hosting.
(Source: AirROI data, 2025, based on 67% licensed listings)
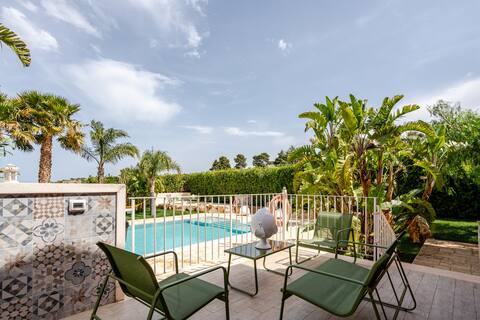
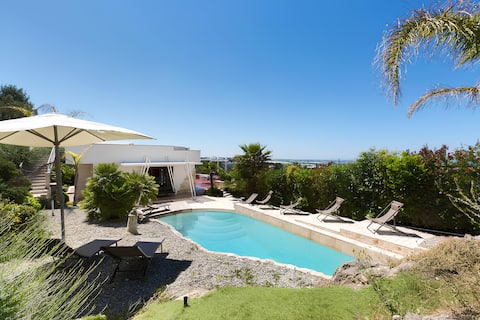
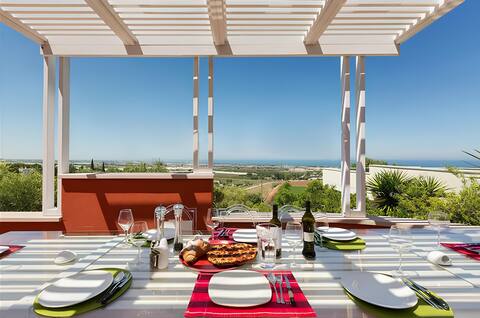
Top Performing Airbnb Properties in Conversano (2025)
Benchmark your potential! Explore examples of top-performing Airbnb properties in Conversanobased on Trailing Twelve Month (TTM) revenue. Analyze their characteristics, revenue, occupancy rate, and ADR to understand what drives success in this market.
Massaroom: Stunning Villa with Sea View
Entire Place • 5 bedrooms
Private pool and panoramic sea view
Entire Place • 4 bedrooms

Masseria Tarsia Incuria 8+4, Emma Villas
Entire Place • 4 bedrooms
Pool and panoramic sea view - RedBeat
Entire Place • 2 bedrooms
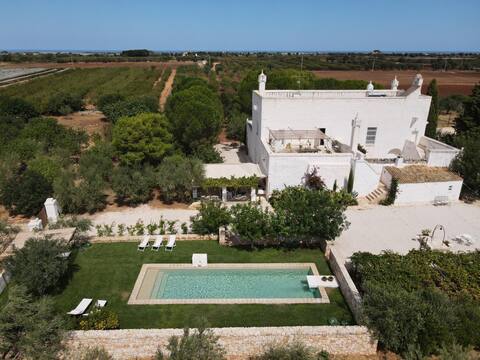
Masseria Le Cerase - Stunning Masseria with Pool
Entire Place • 5 bedrooms

Masseria Montefieno- Stunning Masseria with Poolol
Entire Place • 4 bedrooms
Note: Performance varies based on location, size, amenities, seasonality, and management quality. Data reflects the past 12 months.
Top Performing Airbnb Hosts in Conversano (2025)
Learn from the best! This table showcases top-performing Airbnb hosts in Conversano based on the number of properties managed and estimated total revenue over the past year. Analyze their scale and performance metrics.
| Host Name | Properties | Grossing Revenue | Stay Reviews | Avg Rating |
|---|---|---|---|---|
| Donato | 11 | $370,038 | 384 | 4.90/5.0 |
| Roberto | 4 | $296,938 | 43 | 4.90/5.0 |
| Gianvito | 1 | $121,433 | 88 | 4.82/5.0 |
| Emma | 1 | $93,699 | 5 | 5.00/5.0 |
| Carlo | 7 | $76,069 | 84 | 4.88/5.0 |
| Francesco | 3 | $71,212 | 45 | 4.94/5.0 |
| Wonderful Italy Puglia | 5 | $67,134 | 26 | 4.45/5.0 |
| WePuglia Srl | 3 | $62,675 | 80 | 4.96/5.0 |
| Teresa | 3 | $46,690 | 119 | 4.91/5.0 |
| Giuseppe | 1 | $44,548 | 16 | 4.94/5.0 |
Analyzing the strategies of top hosts, such as their property selection, pricing, and guest communication, can offer valuable lessons for optimizing your own Airbnb operations in Conversano.
Dive Deeper: Advanced Conversano STR Market Data (2025)
Ready to unlock more insights? AirROI provides access to advanced metrics and comprehensive Airbnb data for Conversano. Explore detailed analytics beyond this report to refine your investment strategy, optimize pricing, and maximize your vacation rental profits.
Explore Advanced MetricsConversano Short-Term Rental Market Composition (2025): Property & Room Types
Room Type Distribution
Property Type Distribution
Market Composition Insights for Conversano
- The Conversano Airbnb market composition is heavily skewed towards Entire Home/Apt listings, which make up 71.7% of the 152 active rentals. This indicates strong guest preference for privacy and space.
- Looking at the property type distribution in Conversano, House properties are the most common (42.8%), reflecting the local real estate landscape.
- Houses represent a significant 42.8% portion, catering likely to families or larger groups.
- The presence of 15.1% Hotel/Boutique listings indicates integration with traditional hospitality.
- Smaller segments like outdoor/unique, unique stays, others (combined 7.3%) offer potential for unique stay experiences.
Conversano Airbnb Room Capacity Analysis (2025): Bedroom Distribution
Distribution of Listings by Number of Bedrooms
Room Capacity Insights for Conversano
- The dominant room capacity in Conversano is 1 bedroom listings, making up 57.9% of the market. This suggests a strong demand for properties suitable for couples or solo travelers.
- Together, 1 bedroom and 2 bedrooms properties represent 81.6% of the active Airbnb listings in Conversano, indicating a high concentration in these sizes.
- With over half the market (57.9%) consisting of studios or 1-bedroom units, Conversano is particularly well-suited for individuals or couples.
- Listings with 3+ bedrooms (9.9%) represent a smaller niche, potentially indicating an underserved market for larger group accommodations in Conversano.
Conversano Vacation Rental Guest Capacity Trends (2025)
Distribution of Listings by Guest Capacity
Guest Capacity Insights for Conversano
- The most common guest capacity trend in Conversano vacation rentals is listings accommodating 2 guests (34.2%). This suggests the primary traveler segment is likely couples or solo travelers.
- Properties designed for 2 guests and 4 guests dominate the Conversano STR market, accounting for 62.5% of listings.
- 17.8% of properties accommodate 6+ guests, serving the market segment for larger families or group travel in Conversano.
- On average, properties in Conversano are equipped to host 3.5 guests.
Conversano Airbnb Booking Patterns (2025): Available vs. Booked Days
Available Days Distribution
Booked Days Distribution
Booking Pattern Insights for Conversano
- The most common availability pattern in Conversano falls within the 271-366 days range, representing 59.2% of listings. This suggests many properties have significant open periods on their calendars.
- Approximately 93.4% of listings show high availability (181+ days open annually), indicating potential for increased bookings or specific owner usage patterns.
- For booked days, the 91-180 days range is most frequent in Conversano (35.5%), reflecting common guest stay durations or potential owner blocking patterns.
- A notable 7.2% of properties secure long booking periods (181+ days booked per year), highlighting successful long-term rental strategies or significant owner usage.
Conversano Airbnb Minimum Stay Requirements Analysis
Distribution of Listings by Minimum Night Requirement
1 Night
44 listings
31.4% of total
2 Nights
26 listings
18.6% of total
3 Nights
26 listings
18.6% of total
4-6 Nights
15 listings
10.7% of total
7-29 Nights
15 listings
10.7% of total
30+ Nights
14 listings
10% of total
Key Insights
- The most prevalent minimum stay requirement in Conversano is 1 Night, adopted by 31.4% of listings. This highlights the market's preference for shorter, flexible bookings.
Recommendations
- Align with the market by considering a 1 Night minimum stay, as 31.4% of Conversano hosts use this setting.
- Explore offering discounts for stays of 30+ nights to attract the 10% of the market seeking extended stays.
- Adjust minimum nights based on seasonality – potentially shorter during low season and longer during peak demand periods in Conversano.
Conversano Airbnb Cancellation Policy Trends Analysis (2025)
Super Strict 60 Days
12 listings
10.3% of total
Super Strict 30 Days
1 listings
0.9% of total
Flexible
27 listings
23.3% of total
Moderate
48 listings
41.4% of total
Strict
28 listings
24.1% of total
Cancellation Policy Insights for Conversano
- The prevailing Airbnb cancellation policy trend in Conversano is Moderate, used by 41.4% of listings.
- There's a relatively balanced mix between guest-friendly (64.7%) and stricter (24.1%) policies, offering choices for different guest needs.
Recommendations for Hosts
- Consider adopting a Moderate policy to align with the 41.4% market standard in Conversano.
- Regularly review your cancellation policy against competitors and market demand shifts in Conversano.
Conversano STR Booking Lead Time Analysis (2025)
Average Booking Lead Time by Month
Booking Lead Time Insights for Conversano
- The overall average booking lead time for vacation rentals in Conversano is 46 days.
- Guests book furthest in advance for stays during April (average 66 days), likely coinciding with peak travel demand or local events.
- The shortest booking windows occur for stays in February (average 23 days), indicating more last-minute travel plans during this time.
- Seasonally, Spring (59 days avg.) sees the longest lead times, while Winter (29 days avg.) has the shortest, reflecting typical travel planning cycles.
Recommendations for Hosts
- Use the overall average lead time (46 days) as a baseline for your pricing and availability strategy in Conversano.
- For April stays, consider implementing length-of-stay discounts or slightly higher rates for bookings made less than 66 days out to capitalize on advance planning.
- Target marketing efforts for the Spring season well in advance (at least 59 days) to capture early planners.
- Monitor your own booking lead times against these Conversano averages to identify opportunities for dynamic pricing adjustments.
Popular & Essential Airbnb Amenities in Conversano (2025)
Amenity Prevalence
Amenity Insights for Conversano
- Essential amenities in Conversano that guests expect include: Essentials, Wifi. Lacking these (any) could significantly impact bookings.
- Popular amenities like Air conditioning, Hot water, Heating are common but not universal. Offering these can provide a competitive edge.
Recommendations for Hosts
- Ensure your listing includes all essential amenities for Conversano: Essentials, Wifi.
- Prioritize adding missing essentials: Essentials, Wifi.
- Consider adding popular differentiators like Air conditioning or Hot water to increase appeal.
- Highlight unique or less common amenities you offer (e.g., hot tub, dedicated workspace, EV charger) in your listing description and photos.
- Regularly check competitor amenities in Conversano to stay competitive.
Conversano Airbnb Guest Demographics & Profile Analysis (2025)
Guest Profile Summary for Conversano
- The typical guest profile for Airbnb in Conversano consists of predominantly international visitors (79%), with top international origins including France, typically belonging to the Post-2000s (Gen Z/Alpha) group (50%), primarily speaking English or French.
- Domestic travelers account for 21.1% of guests.
- Key international markets include Italy (21.1%) and France (17.5%).
- Top languages spoken are English (38%) followed by French (15.1%).
- A significant demographic segment is the Post-2000s (Gen Z/Alpha) group, representing 50% of guests.
Recommendations for Hosts
- Focus marketing internationally, particularly towards travelers from France.
- Tailor amenities and listing descriptions to appeal to the dominant Post-2000s (Gen Z/Alpha) demographic (e.g., highlight fast WiFi, smart home features, local guides).
- Highlight unique local experiences or amenities relevant to the primary guest profile.
- Consider seasonal promotions aligned with peak travel times for key origin markets.
Nearby Short-Term Rental Market Comparison
How does the Conversano Airbnb market stack up against its neighbors? Compare key performance metrics like average monthly revenue, ADR, and occupancy rates in surrounding areas to understand the broader regional STR landscape.
| Market | Active Properties | Monthly Revenue | Daily Rate | Avg. Occupancy |
|---|---|---|---|---|
| San Michele Salentino | 74 | $2,208 | $260.22 | 44% |
| Polignano a Mare | 624 | $1,978 | $205.82 | 44% |
| Castellana Grotte | 185 | $1,845 | $219.26 | 43% |
| Ostuni | 1,576 | $1,730 | $250.45 | 39% |
| Ceglie Messapica | 380 | $1,660 | $223.98 | 41% |
| Martina Franca | 569 | $1,657 | $217.67 | 39% |
| Monopoli | 1,141 | $1,637 | $195.75 | 43% |
| Carovigno | 514 | $1,628 | $260.62 | 40% |
| Alberobello | 280 | $1,607 | $189.82 | 38% |
| San Vito dei Normanni | 168 | $1,604 | $219.74 | 43% |