Castellaneta Airbnb Market Analysis 2025: Short Term Rental Data & Vacation Rental Statistics in Apulia, Italy
Is Airbnb profitable in Castellaneta in 2025? Explore comprehensive Airbnb analytics for Castellaneta, Apulia, Italy to uncover income potential. This 2025 STR market report for Castellaneta, based on AirROI data from April 2024 to March 2025, reveals key trends in the niche market of 59 active listings.
Whether you're considering an Airbnb investment in Castellaneta, optimizing your existing vacation rental, or exploring rental arbitrage opportunities, understanding the Castellaneta Airbnb data is crucial. Navigating the high regulation landscape is key to maximizing your short term rental income potential. Let's dive into the specifics.
Key Castellaneta Airbnb Performance Metrics Overview
Monthly Airbnb Revenue Variations & Income Potential in Castellaneta (2025)
Understanding the monthly revenue variations for Airbnb listings in Castellaneta is key to maximizing your short term rental income potential. Seasonality significantly impacts earnings. Our analysis, based on data from the past 12 months, shows that the peak revenue month for STRs in Castellaneta is typically August, while February often presents the lowest earnings, highlighting opportunities for strategic pricing adjustments during shoulder and low seasons. Explore the typical Airbnb income in Castellaneta across different performance tiers:
- Best-in-class properties (Top 10%) achieve $2,763+ monthly, often utilizing dynamic pricing and superior guest experiences.
- Strong performing properties (Top 25%) earn $1,542 or more, indicating effective management and desirable locations/amenities.
- Typical properties (Median) generate around $691 per month, representing the average market performance.
- Entry-level properties (Bottom 25%) see earnings around $364, often with potential for optimization.
Average Monthly Airbnb Earnings Trend in Castellaneta
Castellaneta Airbnb Occupancy Rate Trends (2025)
Maximize your bookings by understanding the Castellaneta STR occupancy trends. Seasonal demand shifts significantly influence how often properties are booked. Typically, Augustsees the highest demand (peak season occupancy), while January experiences the lowest (low season). Effective strategies, like adjusting minimum stays or offering promotions, can boost occupancy during slower periods. Here's how different property tiers perform in Castellaneta:
- Best-in-class properties (Top 10%) achieve 59%+ occupancy, indicating high desirability and potentially optimized availability.
- Strong performing properties (Top 25%) maintain 34% or higher occupancy, suggesting good market fit and guest satisfaction.
- Typical properties (Median) have an occupancy rate around 19%.
- Entry-level properties (Bottom 25%) average 10% occupancy, potentially facing higher vacancy.
Average Monthly Occupancy Rate Trend in Castellaneta
Average Daily Rate (ADR) Airbnb Trends in Castellaneta (2025)
Effective short term rental pricing strategy in Castellaneta involves understanding monthly ADR fluctuations. The Average Daily Rate (ADR) for Airbnb in Castellaneta typically peaks in August and dips lowest during March. Leveraging Airbnb dynamic pricing tools or strategies based on this seasonality can significantly boost revenue. Here's a look at the typical nightly rates achieved:
- Best-in-class properties (Top 10%) command rates of $218+ per night, often due to premium features or locations.
- Strong performing properties (Top 25%) achieve nightly rates of $145 or more.
- Typical properties (Median) charge around $95 per night.
- Entry-level properties (Bottom 25%) earn around $70 per night.
Average Daily Rate (ADR) Trend by Month in Castellaneta
Get Live Castellaneta Market Intelligence 👇

Explore Real-time Analytics
Airbnb Seasonality Analysis & Trends in Castellaneta (2025)
Peak Season (August, September, July)
- Revenue averages $1,819 per month
- Occupancy rates average 37.7%
- Daily rates average $130
Shoulder Season
- Revenue averages $1,107 per month
- Occupancy maintains around 24.8%
- Daily rates hold near $120
Low Season (January, February, March)
- Revenue drops to average $502 per month
- Occupancy decreases to average 15.7%
- Daily rates adjust to average $107
Seasonality Insights for Castellaneta
- The Airbnb seasonality in Castellaneta shows highly seasonal trends requiring careful strategy. While the sections above show seasonal averages, it's also insightful to look at the extremes:
- During the high season, the absolute peak month showcases Castellaneta's highest earning potential, with monthly revenues capable of climbing to $2,331, occupancy reaching a high of 46.3%, and ADRs peaking at $132.
- Conversely, the slowest single month of the year, typically falling within the low season, marks the market's lowest point. In this month, revenue might dip to $357, occupancy could drop to 13.4%, and ADRs may adjust down to $106.
- Understanding both the seasonal averages and these monthly peaks and troughs in revenue, occupancy, and ADR is crucial for maximizing your Airbnb profit potential in Castellaneta.
Seasonal Strategies for Maximizing Profit
- Peak Season: Maximize revenue through premium pricing and potentially longer minimum stays. Ensure high availability.
- Low Season: Offer competitive pricing, special promotions (e.g., extended stay discounts), and flexible cancellation policies. Target off-season travelers like remote workers or budget-conscious guests.
- Shoulder Seasons: Implement dynamic pricing that balances peak and low rates. Target weekend travelers or specific events. Offer slightly more flexible terms than peak season.
- Regularly analyze your own performance against these Castellaneta seasonality benchmarks and adjust your pricing and availability strategy accordingly.
Best Areas for Airbnb Investment in Castellaneta (2025)
Exploring the top neighborhoods for short-term rentals in Castellaneta? This section highlights key areas, outlining why they are attractive for hosts and guests, along with notable local attractions. Consider these locations based on your target guest profile and investment strategy.
| Neighborhood / Area | Why Host Here? (Target Guests & Appeal) | Key Attractions & Landmarks |
|---|---|---|
| Castellaneta Marina | Beautiful coastal area known for its sandy beaches and clear waters. Popular for family vacations and summer getaways, making it an excellent spot for short-term rentals. | Casa Montalto, Torre di Marsala, Parco Naturale Regionale Terra delle Gravine, Spiaggia di Castellaneta Marina, Scogliera di Castellaneta |
| Centro Storico | The historical center of Castellaneta, rich in culture and architecture. Visitors are attracted to its charming streets and historical sites, perfect for guests looking to explore the local heritage. | Chiesa di San Domenico, Castello di Castellaneta, Museo della Civiltà Contadina, Piazza Giovanni XXIII, Palazzo Marchesale |
| Tarantina | The surrounding area filled with vineyards and olive groves. Ideal for those looking to experience rural Italy and interested in agritourism, making it appealing for keen travelers. | Taranto's Old Town, The National Archaeological Museum of Taranto, Castello Aragonese, The Sea of Taranto, Basilica di San Cataldo |
| Matera | A short drive from Castellaneta, known for its ancient cave dwellings and dramatic landscapes. Attracts tourists interested in history and UNESCO heritage, providing a unique stay for visitors. | Sassi di Matera, Matera Cathedral, Rock Churches of Matera, Casa Grotta di Vico Solitario, Palombaro Lungo |
| Gravina di Puglia | Charming town known for its historical sites and natural beauty. Perfect for travelers wanting to explore the Puglia region's culture and traditions. | Gravina Cathedral, Ponte Acquedotto, Parco Naturale Regionale delle Gravine, Crypt of the Holy Spirit, Palazzo Marchesale |
| Polignano a Mare | Famous coastal town known for its stunning cliffs and crystal-clear sea. A highly sought-after destination, making it great for Airbnb investments. | Cala Lama Monachile, Old Town, Statue of Domenico Modugno, Grotta Azzurra, Ponte dei Azzurri |
| Alberobello | Known for its unique trulli houses, a UNESCO World Heritage Site. Draws tourists from all over the world, making it a profitable area for short-term rentals. | Trullo Sovrano, Church of Saint Anthony, Trulli Zone, Museo del Territorio, Aia Piccola |
| Locorotondo | Charming hilltop town known for its circular layout and beautiful views. Attracts visitors interested in wine tours and local traditions, ideal for tourist accommodations. | Church of Saint George, Viewpoints, Old Town, Vigna and wineries, Local festivals |
Understanding Airbnb License Requirements & STR Laws in Castellaneta (2025)
Yes, Castellaneta, Apulia, Italy enforces high STR regulations. Obtaining a license and ensuring compliance is almost certainly required according to current 2025 STR laws. Always verify the latest short term rental regulations and Airbnb license requirements directly with local government authorities for Castellaneta to ensure full compliance before hosting.
(Source: AirROI data, 2025, based on 46% licensed listings)
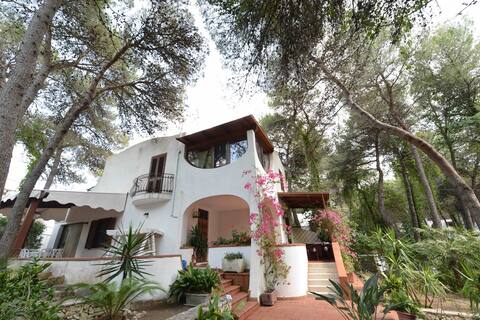
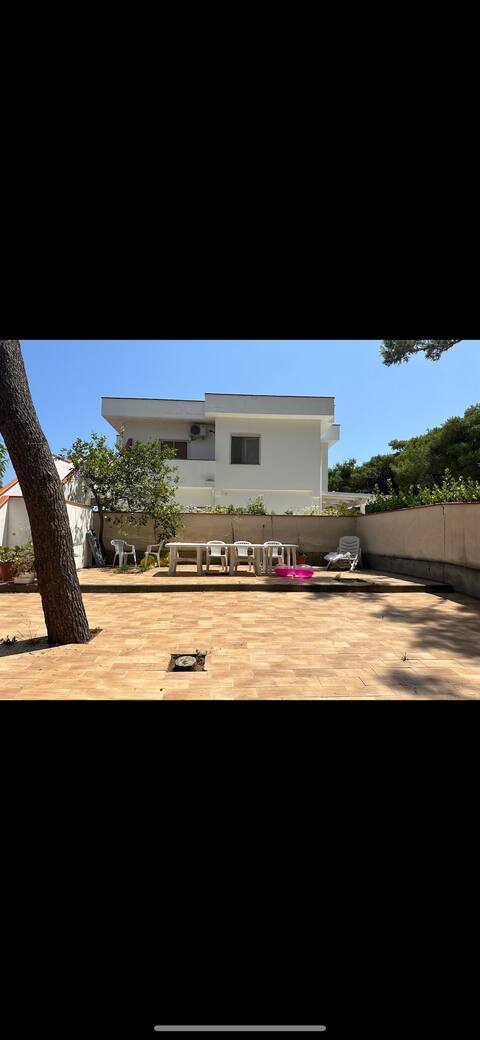
Top Performing Airbnb Properties in Castellaneta (2025)
Benchmark your potential! Explore examples of top-performing Airbnb properties in Castellanetabased on Trailing Twelve Month (TTM) revenue. Analyze their characteristics, revenue, occupancy rate, and ADR to understand what drives success in this market.

Villa Mediterranea - For families-Bandiera Blu 2024
Entire Place • 5 bedrooms
Villa Elisabetta - For families -Bandiera Blu 2024
Entire Place • 5 bedrooms

Villa Oliva, A Homemade feeling
Entire Place • 3 bedrooms
Ville Brigitte
Entire Place • 3 bedrooms

CasaMia B&B comfortable house
Entire Place • 1 bedroom

Villa Bruno, your home by the sea
Entire Place • 3 bedrooms
Note: Performance varies based on location, size, amenities, seasonality, and management quality. Data reflects the past 12 months.
Top Performing Airbnb Hosts in Castellaneta (2025)
Learn from the best! This table showcases top-performing Airbnb hosts in Castellaneta based on the number of properties managed and estimated total revenue over the past year. Analyze their scale and performance metrics.
| Host Name | Properties | Grossing Revenue | Stay Reviews | Avg Rating |
|---|---|---|---|---|
| Carmine | 2 | $83,946 | 60 | 4.78/5.0 |
| Host #20690140 | 1 | $22,208 | 0 | 0.00/5.0 |
| Host #38213542 | 1 | $21,633 | 0 | 0.00/5.0 |
| Veronica | 1 | $20,365 | 7 | 5.00/5.0 |
| Gabriele | 1 | $19,870 | 10 | 4.70/5.0 |
| Nicola | 1 | $19,759 | 29 | 5.00/5.0 |
| Luca | 1 | $16,217 | 40 | 5.00/5.0 |
| Host #16611461 | 1 | $15,530 | 9 | 4.56/5.0 |
| Ortenzia | 1 | $12,776 | 17 | 4.94/5.0 |
| Maria | 1 | $12,117 | 3 | 4.33/5.0 |
Analyzing the strategies of top hosts, such as their property selection, pricing, and guest communication, can offer valuable lessons for optimizing your own Airbnb operations in Castellaneta.
Dive Deeper: Advanced Castellaneta STR Market Data (2025)
Ready to unlock more insights? AirROI provides access to advanced metrics and comprehensive Airbnb data for Castellaneta. Explore detailed analytics beyond this report to refine your investment strategy, optimize pricing, and maximize your vacation rental profits.
Explore Advanced MetricsCastellaneta Short-Term Rental Market Composition (2025): Property & Room Types
Room Type Distribution
Property Type Distribution
Market Composition Insights for Castellaneta
- The Castellaneta Airbnb market composition is heavily skewed towards Entire Home/Apt listings, which make up 91.5% of the 59 active rentals. This indicates strong guest preference for privacy and space.
- Looking at the property type distribution in Castellaneta, House properties are the most common (57.6%), reflecting the local real estate landscape.
- Houses represent a significant 57.6% portion, catering likely to families or larger groups.
- Smaller segments like hotel/boutique, others (combined 5.1%) offer potential for unique stay experiences.
Castellaneta Airbnb Room Capacity Analysis (2025): Bedroom Distribution
Distribution of Listings by Number of Bedrooms
Room Capacity Insights for Castellaneta
- The dominant room capacity in Castellaneta is 2 bedrooms listings, making up 33.9% of the market. This suggests a strong demand for properties suitable for couples or solo travelers.
- Together, 2 bedrooms and 1 bedroom properties represent 67.8% of the active Airbnb listings in Castellaneta, indicating a high concentration in these sizes.
- A significant 27.1% of listings offer 3+ bedrooms, catering to larger groups and families seeking more space in Castellaneta.
Castellaneta Vacation Rental Guest Capacity Trends (2025)
Distribution of Listings by Guest Capacity
Guest Capacity Insights for Castellaneta
- The most common guest capacity trend in Castellaneta vacation rentals is listings accommodating 4 guests (35.6%). This suggests the primary traveler segment is likely small families or groups.
- Properties designed for 4 guests and 6 guests dominate the Castellaneta STR market, accounting for 57.6% of listings.
- 37.3% of properties accommodate 6+ guests, serving the market segment for larger families or group travel in Castellaneta.
- On average, properties in Castellaneta are equipped to host 4.7 guests.
Castellaneta Airbnb Booking Patterns (2025): Available vs. Booked Days
Available Days Distribution
Booked Days Distribution
Booking Pattern Insights for Castellaneta
- The most common availability pattern in Castellaneta falls within the 271-366 days range, representing 79.7% of listings. This suggests many properties have significant open periods on their calendars.
- Approximately 93.3% of listings show high availability (181+ days open annually), indicating potential for increased bookings or specific owner usage patterns.
- For booked days, the 31-90 days range is most frequent in Castellaneta (40.7%), reflecting common guest stay durations or potential owner blocking patterns.
- A notable 6.8% of properties secure long booking periods (181+ days booked per year), highlighting successful long-term rental strategies or significant owner usage.
Castellaneta Airbnb Minimum Stay Requirements Analysis
Distribution of Listings by Minimum Night Requirement
1 Night
9 listings
16.4% of total
2 Nights
9 listings
16.4% of total
3 Nights
9 listings
16.4% of total
4-6 Nights
9 listings
16.4% of total
7-29 Nights
18 listings
32.7% of total
30+ Nights
1 listings
1.8% of total
Key Insights
- The most prevalent minimum stay requirement in Castellaneta is 7-29 Nights, adopted by 32.7% of listings. This highlights the market's preference for shorter, flexible bookings.
- Dedicated monthly rentals (30+ nights) represent a small niche (1.8%), possibly an untapped area for hosts.
Recommendations
- Align with the market by considering a 7-29 Nights minimum stay, as 32.7% of Castellaneta hosts use this setting.
- If feasible, allowing 1-night stays, especially midweek or during low season, could capture last-minute bookings, as only 16.4% currently do.
- Adjust minimum nights based on seasonality – potentially shorter during low season and longer during peak demand periods in Castellaneta.
Castellaneta Airbnb Cancellation Policy Trends Analysis (2025)
Super Strict 60 Days
1 listings
2.4% of total
Flexible
10 listings
24.4% of total
Moderate
15 listings
36.6% of total
Strict
15 listings
36.6% of total
Cancellation Policy Insights for Castellaneta
- The prevailing Airbnb cancellation policy trend in Castellaneta is Moderate, used by 36.6% of listings.
- There's a relatively balanced mix between guest-friendly (61.0%) and stricter (36.6%) policies, offering choices for different guest needs.
Recommendations for Hosts
- Consider adopting a Moderate policy to align with the 36.6% market standard in Castellaneta.
- With 36.6% using Strict terms, this is a viable option in Castellaneta, particularly for high-value properties or during peak demand periods.
- Regularly review your cancellation policy against competitors and market demand shifts in Castellaneta.
Castellaneta STR Booking Lead Time Analysis (2025)
Average Booking Lead Time by Month
Booking Lead Time Insights for Castellaneta
- The overall average booking lead time for vacation rentals in Castellaneta is 59 days.
- Guests book furthest in advance for stays during February (average 99 days), likely coinciding with peak travel demand or local events.
- The shortest booking windows occur for stays in December (average 15 days), indicating more last-minute travel plans during this time.
- Seasonally, Spring (70 days avg.) sees the longest lead times, while Winter (50 days avg.) has the shortest, reflecting typical travel planning cycles.
Recommendations for Hosts
- Use the overall average lead time (59 days) as a baseline for your pricing and availability strategy in Castellaneta.
- For February stays, consider implementing length-of-stay discounts or slightly higher rates for bookings made less than 99 days out to capitalize on advance planning.
- Target marketing efforts for the Spring season well in advance (at least 70 days) to capture early planners.
- Monitor your own booking lead times against these Castellaneta averages to identify opportunities for dynamic pricing adjustments.
Popular & Essential Airbnb Amenities in Castellaneta (2025)
Amenity Prevalence
Amenity Insights for Castellaneta
- Essential amenities in Castellaneta that guests expect include: Kitchen. Lacking these (this) could significantly impact bookings.
- Popular amenities like TV, Hot water, Essentials are common but not universal. Offering these can provide a competitive edge.
- Warning: Wifi is not universally provided but is considered essential globally. Ensure reliable Wifi is offered.
Recommendations for Hosts
- Ensure your listing includes all essential amenities for Castellaneta: Kitchen.
- Prioritize adding missing essentials: Kitchen.
- Consider adding popular differentiators like TV or Hot water to increase appeal.
- Highlight unique or less common amenities you offer (e.g., hot tub, dedicated workspace, EV charger) in your listing description and photos.
- Regularly check competitor amenities in Castellaneta to stay competitive.
Castellaneta Airbnb Guest Demographics & Profile Analysis (2025)
Guest Profile Summary for Castellaneta
- The typical guest profile for Airbnb in Castellaneta consists of a mix of domestic (39%) and international guests, with top international origins including France, typically belonging to the Post-2000s (Gen Z/Alpha) group (50%), primarily speaking English or Italian.
- Domestic travelers account for 38.9% of guests.
- Key international markets include Italy (38.9%) and France (15.8%).
- Top languages spoken are English (38.3%) followed by Italian (20%).
- A significant demographic segment is the Post-2000s (Gen Z/Alpha) group, representing 50% of guests.
Recommendations for Hosts
- Focus marketing internationally, particularly towards travelers from France.
- Tailor amenities and listing descriptions to appeal to the dominant Post-2000s (Gen Z/Alpha) demographic (e.g., highlight fast WiFi, smart home features, local guides).
- Highlight unique local experiences or amenities relevant to the primary guest profile.
- Consider seasonal promotions aligned with peak travel times for key origin markets.
Nearby Short-Term Rental Market Comparison
How does the Castellaneta Airbnb market stack up against its neighbors? Compare key performance metrics like average monthly revenue, ADR, and occupancy rates in surrounding areas to understand the broader regional STR landscape.
| Market | Active Properties | Monthly Revenue | Daily Rate | Avg. Occupancy |
|---|---|---|---|---|
| San Michele Salentino | 74 | $2,208 | $260.22 | 44% |
| Polignano a Mare | 624 | $1,978 | $205.82 | 44% |
| Castellana Grotte | 185 | $1,845 | $219.26 | 43% |
| Torchiara | 21 | $1,737 | $280.56 | 26% |
| Ostuni | 1,576 | $1,730 | $250.45 | 39% |
| Ceglie Messapica | 380 | $1,660 | $223.98 | 41% |
| Martina Franca | 569 | $1,657 | $217.67 | 39% |
| Monopoli | 1,141 | $1,637 | $195.75 | 43% |
| Carovigno | 514 | $1,628 | $260.62 | 40% |
| Alberobello | 280 | $1,607 | $189.82 | 38% |