Barletta Airbnb Market Analysis 2025: Short Term Rental Data & Vacation Rental Statistics in Apulia, Italy
Is Airbnb profitable in Barletta in 2025? Explore comprehensive Airbnb analytics for Barletta, Apulia, Italy to uncover income potential. This 2025 STR market report for Barletta, based on AirROI data from April 2024 to March 2025, reveals key trends in the niche market of 123 active listings.
Whether you're considering an Airbnb investment in Barletta, optimizing your existing vacation rental, or exploring rental arbitrage opportunities, understanding the Barletta Airbnb data is crucial. Navigating the high regulation landscape is key to maximizing your short term rental income potential. Let's dive into the specifics.
Key Barletta Airbnb Performance Metrics Overview
Monthly Airbnb Revenue Variations & Income Potential in Barletta (2025)
Understanding the monthly revenue variations for Airbnb listings in Barletta is key to maximizing your short term rental income potential. Seasonality significantly impacts earnings. Our analysis, based on data from the past 12 months, shows that the peak revenue month for STRs in Barletta is typically August, while January often presents the lowest earnings, highlighting opportunities for strategic pricing adjustments during shoulder and low seasons. Explore the typical Airbnb income in Barletta across different performance tiers:
- Best-in-class properties (Top 10%) achieve $1,702+ monthly, often utilizing dynamic pricing and superior guest experiences.
- Strong performing properties (Top 25%) earn $998 or more, indicating effective management and desirable locations/amenities.
- Typical properties (Median) generate around $549 per month, representing the average market performance.
- Entry-level properties (Bottom 25%) see earnings around $264, often with potential for optimization.
Average Monthly Airbnb Earnings Trend in Barletta
Barletta Airbnb Occupancy Rate Trends (2025)
Maximize your bookings by understanding the Barletta STR occupancy trends. Seasonal demand shifts significantly influence how often properties are booked. Typically, Augustsees the highest demand (peak season occupancy), while January experiences the lowest (low season). Effective strategies, like adjusting minimum stays or offering promotions, can boost occupancy during slower periods. Here's how different property tiers perform in Barletta:
- Best-in-class properties (Top 10%) achieve 54%+ occupancy, indicating high desirability and potentially optimized availability.
- Strong performing properties (Top 25%) maintain 36% or higher occupancy, suggesting good market fit and guest satisfaction.
- Typical properties (Median) have an occupancy rate around 21%.
- Entry-level properties (Bottom 25%) average 10% occupancy, potentially facing higher vacancy.
Average Monthly Occupancy Rate Trend in Barletta
Average Daily Rate (ADR) Airbnb Trends in Barletta (2025)
Effective short term rental pricing strategy in Barletta involves understanding monthly ADR fluctuations. The Average Daily Rate (ADR) for Airbnb in Barletta typically peaks in August and dips lowest during February. Leveraging Airbnb dynamic pricing tools or strategies based on this seasonality can significantly boost revenue. Here's a look at the typical nightly rates achieved:
- Best-in-class properties (Top 10%) command rates of $142+ per night, often due to premium features or locations.
- Strong performing properties (Top 25%) achieve nightly rates of $105 or more.
- Typical properties (Median) charge around $79 per night.
- Entry-level properties (Bottom 25%) earn around $59 per night.
Average Daily Rate (ADR) Trend by Month in Barletta
Get Live Barletta Market Intelligence 👇

Explore Real-time Analytics
Airbnb Seasonality Analysis & Trends in Barletta (2025)
Peak Season (August, May, July)
- Revenue averages $1,096 per month
- Occupancy rates average 35.2%
- Daily rates average $99
Shoulder Season
- Revenue averages $717 per month
- Occupancy maintains around 24.4%
- Daily rates hold near $91
Low Season (January, February, March)
- Revenue drops to average $401 per month
- Occupancy decreases to average 17.9%
- Daily rates adjust to average $80
Seasonality Insights for Barletta
- The Airbnb seasonality in Barletta shows highly seasonal trends requiring careful strategy. While the sections above show seasonal averages, it's also insightful to look at the extremes:
- During the high season, the absolute peak month showcases Barletta's highest earning potential, with monthly revenues capable of climbing to $1,263, occupancy reaching a high of 44.3%, and ADRs peaking at $103.
- Conversely, the slowest single month of the year, typically falling within the low season, marks the market's lowest point. In this month, revenue might dip to $360, occupancy could drop to 15.7%, and ADRs may adjust down to $80.
- Understanding both the seasonal averages and these monthly peaks and troughs in revenue, occupancy, and ADR is crucial for maximizing your Airbnb profit potential in Barletta.
Seasonal Strategies for Maximizing Profit
- Peak Season: Maximize revenue through premium pricing and potentially longer minimum stays. Ensure high availability.
- Low Season: Offer competitive pricing, special promotions (e.g., extended stay discounts), and flexible cancellation policies. Target off-season travelers like remote workers or budget-conscious guests.
- Shoulder Seasons: Implement dynamic pricing that balances peak and low rates. Target weekend travelers or specific events. Offer slightly more flexible terms than peak season.
- Regularly analyze your own performance against these Barletta seasonality benchmarks and adjust your pricing and availability strategy accordingly.
Best Areas for Airbnb Investment in Barletta (2025)
Exploring the top neighborhoods for short-term rentals in Barletta? This section highlights key areas, outlining why they are attractive for hosts and guests, along with notable local attractions. Consider these locations based on your target guest profile and investment strategy.
| Neighborhood / Area | Why Host Here? (Target Guests & Appeal) | Key Attractions & Landmarks |
|---|---|---|
| Centro Storico | The historic center of Barletta, rich in culture and history. It's a vibrant area with narrow streets, historic buildings, and local shops, making it attractive to tourists wanting to experience local life. | Castello di Barletta, Basilica di Santa Maria Maggiore, Piazza Duomo, Palazzo Della Marra, Batteria di Punta Aderci |
| Spiaggia di Barletta | Popular beach area that attracts visitors during the summer months. High demand for beachfront accommodations and access to water activities. | Lido Pascia, Spiaggia di Ponente, Chalet del Mare, Beach clubs, Sunset views |
| Via Roma | A bustling street lined with shops, cafes, and restaurants. Ideal for visitors looking to enjoy dining and shopping in a lively atmosphere. | Shopping boutiques, Local restaurants, Cafes, Gelato shops, Street performances |
| Parco Archeologico di Canne della Battaglia | An archaeological site that offers a glimpse into the ancient history of the area. Attracts history enthusiasts and tourists alike. | Archaeological museum, Guided tours, Historical reenactments |
| Castello Svevo | An iconic fortress that attracts tourists interested in history and architecture. Provides a unique backdrop for accommodations near historical landmarks. | Castle tours, Cultural events, Scenic views of Barletta |
| Cittadella degli Artisti | A cultural hub for artists and creative professionals. Attracts those looking for a more artsy and authentic local experience. | Art galleries, Workshops, Cultural events, Theater performances |
| Lido di Barletta | Another beach area known for its lively summer atmosphere. Great for families and younger crowds looking for beach holidays. | Water sports, Sunbathing, Restaurants and bars |
| Via Corso Vittorio Emanuele | One of the main thoroughfares filled with commerce, culture, and local life. A great location for travelers who want access to the heart of Barletta. | Local markets, Street fairs, Historic buildings |
Understanding Airbnb License Requirements & STR Laws in Barletta (2025)
Yes, Barletta, Apulia, Italy enforces high STR regulations. Obtaining a license and ensuring compliance is almost certainly required according to current 2025 STR laws. Always verify the latest short term rental regulations and Airbnb license requirements directly with local government authorities for Barletta to ensure full compliance before hosting.
(Source: AirROI data, 2025, based on 43% licensed listings)
Top Performing Airbnb Properties in Barletta (2025)
Benchmark your potential! Explore examples of top-performing Airbnb properties in Barlettabased on Trailing Twelve Month (TTM) revenue. Analyze their characteristics, revenue, occupancy rate, and ADR to understand what drives success in this market.

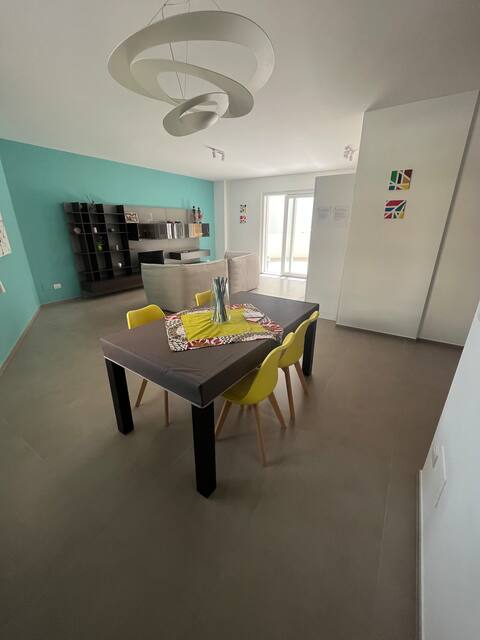
Penthouse - Il Panorama
Entire Place • 1 bedroom
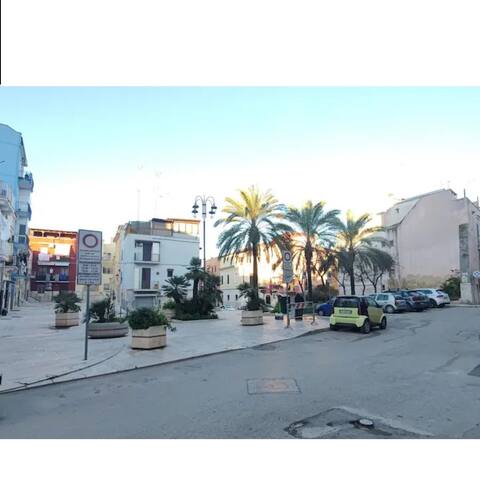
Guest House San Miguel near the sea and downtown
Entire Place • 2 bedrooms
intero appartamento a Barletta BT Puglia
Entire Place • 3 bedrooms

Maison Brancaleone Casa Vacanze
Entire Place • 2 bedrooms

Apt in Downtown! Breakfast Included - Palazzo Storico
Entire Place • 1 bedroom
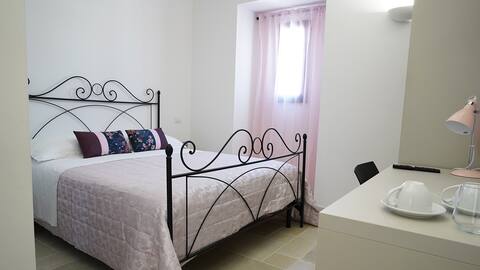
Duomo Guest House/Economy Double Room
Private Room • 1 bedroom
Note: Performance varies based on location, size, amenities, seasonality, and management quality. Data reflects the past 12 months.
Top Performing Airbnb Hosts in Barletta (2025)
Learn from the best! This table showcases top-performing Airbnb hosts in Barletta based on the number of properties managed and estimated total revenue over the past year. Analyze their scale and performance metrics.
| Host Name | Properties | Grossing Revenue | Stay Reviews | Avg Rating |
|---|---|---|---|---|
| Giulio | 5 | $44,410 | 19 | 2.96/5.0 |
| Antonio Mario | 6 | $37,587 | 35 | 3.07/5.0 |
| Riccardo | 4 | $31,277 | 10 | 1.25/5.0 |
| Francesco | 4 | $26,121 | 18 | 1.25/5.0 |
| Grazia | 1 | $24,033 | 45 | 4.93/5.0 |
| Welcome To Italy | 5 | $22,065 | 6 | 0.87/5.0 |
| Antonio | 3 | $20,139 | 223 | 4.86/5.0 |
| Riccardo | 2 | $19,742 | 15 | 4.86/5.0 |
| Katia | 1 | $16,721 | 28 | 4.96/5.0 |
| Carmela | 2 | $15,108 | 18 | 4.96/5.0 |
Analyzing the strategies of top hosts, such as their property selection, pricing, and guest communication, can offer valuable lessons for optimizing your own Airbnb operations in Barletta.
Dive Deeper: Advanced Barletta STR Market Data (2025)
Ready to unlock more insights? AirROI provides access to advanced metrics and comprehensive Airbnb data for Barletta. Explore detailed analytics beyond this report to refine your investment strategy, optimize pricing, and maximize your vacation rental profits.
Explore Advanced MetricsBarletta Short-Term Rental Market Composition (2025): Property & Room Types
Room Type Distribution
Property Type Distribution
Market Composition Insights for Barletta
- The Barletta Airbnb market composition is heavily skewed towards Entire Home/Apt listings, which make up 74% of the 123 active rentals. This indicates strong guest preference for privacy and space.
- Looking at the property type distribution in Barletta, Apartment/Condo properties are the most common (60.2%), reflecting the local real estate landscape.
- Houses represent a significant 26% portion, catering likely to families or larger groups.
- The presence of 13.8% Hotel/Boutique listings indicates integration with traditional hospitality.
Barletta Airbnb Room Capacity Analysis (2025): Bedroom Distribution
Distribution of Listings by Number of Bedrooms
Room Capacity Insights for Barletta
- The dominant room capacity in Barletta is 1 bedroom listings, making up 65.9% of the market. This suggests a strong demand for properties suitable for couples or solo travelers.
- Together, 1 bedroom and 2 bedrooms properties represent 85.4% of the active Airbnb listings in Barletta, indicating a high concentration in these sizes.
- With over half the market (65.9%) consisting of studios or 1-bedroom units, Barletta is particularly well-suited for individuals or couples.
- Listings with 3+ bedrooms (7.3%) represent a smaller niche, potentially indicating an underserved market for larger group accommodations in Barletta.
Barletta Vacation Rental Guest Capacity Trends (2025)
Distribution of Listings by Guest Capacity
Guest Capacity Insights for Barletta
- The most common guest capacity trend in Barletta vacation rentals is listings accommodating 4 guests (32.5%). This suggests the primary traveler segment is likely small families or groups.
- Properties designed for 4 guests and 2 guests dominate the Barletta STR market, accounting for 55.3% of listings.
- On average, properties in Barletta are equipped to host 3.4 guests.
Barletta Airbnb Booking Patterns (2025): Available vs. Booked Days
Available Days Distribution
Booked Days Distribution
Booking Pattern Insights for Barletta
- The most common availability pattern in Barletta falls within the 271-366 days range, representing 81.3% of listings. This suggests many properties have significant open periods on their calendars.
- Approximately 99.2% of listings show high availability (181+ days open annually), indicating potential for increased bookings or specific owner usage patterns.
- For booked days, the 31-90 days range is most frequent in Barletta (39.8%), reflecting common guest stay durations or potential owner blocking patterns.
- A notable 1.6% of properties secure long booking periods (181+ days booked per year), highlighting successful long-term rental strategies or significant owner usage.
Barletta Airbnb Minimum Stay Requirements Analysis
Distribution of Listings by Minimum Night Requirement
1 Night
57 listings
50.4% of total
2 Nights
24 listings
21.2% of total
3 Nights
9 listings
8% of total
4-6 Nights
4 listings
3.5% of total
7-29 Nights
14 listings
12.4% of total
30+ Nights
5 listings
4.4% of total
Key Insights
- The most prevalent minimum stay requirement in Barletta is 1 Night, adopted by 50.4% of listings. This highlights the market's preference for shorter, flexible bookings.
- A strong majority (71.6%) of the Barletta Airbnb data shows acceptance of very short stays (1-2 nights), indicating a dynamic, high-turnover market.
Recommendations
- Align with the market by considering a 1 Night minimum stay, as 50.4% of Barletta hosts use this setting.
- Adjust minimum nights based on seasonality – potentially shorter during low season and longer during peak demand periods in Barletta.
Barletta Airbnb Cancellation Policy Trends Analysis (2025)
Super Strict 30 Days
1 listings
1.5% of total
Flexible
21 listings
31.3% of total
Moderate
34 listings
50.7% of total
Strict
11 listings
16.4% of total
Cancellation Policy Insights for Barletta
- The prevailing Airbnb cancellation policy trend in Barletta is Moderate, used by 50.7% of listings.
- The market strongly favors guest-friendly terms, with 82.0% of listings offering Flexible or Moderate policies. This suggests guests in Barletta may expect booking flexibility.
Recommendations for Hosts
- Consider adopting a Moderate policy to align with the 50.7% market standard in Barletta.
- Regularly review your cancellation policy against competitors and market demand shifts in Barletta.
Barletta STR Booking Lead Time Analysis (2025)
Average Booking Lead Time by Month
Booking Lead Time Insights for Barletta
- The overall average booking lead time for vacation rentals in Barletta is 31 days.
- Guests book furthest in advance for stays during October (average 48 days), likely coinciding with peak travel demand or local events.
- The shortest booking windows occur for stays in December (average 24 days), indicating more last-minute travel plans during this time.
- Seasonally, Summer (40 days avg.) sees the longest lead times, while Winter (27 days avg.) has the shortest, reflecting typical travel planning cycles.
Recommendations for Hosts
- Use the overall average lead time (31 days) as a baseline for your pricing and availability strategy in Barletta.
- For October stays, consider implementing length-of-stay discounts or slightly higher rates for bookings made less than 48 days out to capitalize on advance planning.
- Target marketing efforts for the Summer season well in advance (at least 40 days) to capture early planners.
- Monitor your own booking lead times against these Barletta averages to identify opportunities for dynamic pricing adjustments.
Popular & Essential Airbnb Amenities in Barletta (2025)
Amenity Prevalence
Amenity Insights for Barletta
- Essential amenities in Barletta that guests expect include: TV, Heating. Lacking these (any) could significantly impact bookings.
- Popular amenities like Hot water, Essentials, Air conditioning are common but not universal. Offering these can provide a competitive edge.
- Warning: Wifi is not universally provided but is considered essential globally. Ensure reliable Wifi is offered.
Recommendations for Hosts
- Ensure your listing includes all essential amenities for Barletta: TV, Heating.
- Prioritize adding missing essentials: TV, Heating.
- Consider adding popular differentiators like Hot water or Essentials to increase appeal.
- Highlight unique or less common amenities you offer (e.g., hot tub, dedicated workspace, EV charger) in your listing description and photos.
- Regularly check competitor amenities in Barletta to stay competitive.
Barletta Airbnb Guest Demographics & Profile Analysis (2025)
Guest Profile Summary for Barletta
- The typical guest profile for Airbnb in Barletta consists of a mix of domestic (38%) and international guests, with top international origins including France, typically belonging to the Post-2000s (Gen Z/Alpha) group (50%), primarily speaking English or Italian.
- Domestic travelers account for 38.3% of guests.
- Key international markets include Italy (38.3%) and France (12.1%).
- Top languages spoken are English (35.4%) followed by Italian (19.6%).
- A significant demographic segment is the Post-2000s (Gen Z/Alpha) group, representing 50% of guests.
Recommendations for Hosts
- Focus marketing internationally, particularly towards travelers from France.
- Tailor amenities and listing descriptions to appeal to the dominant Post-2000s (Gen Z/Alpha) demographic (e.g., highlight fast WiFi, smart home features, local guides).
- Highlight unique local experiences or amenities relevant to the primary guest profile.
- Consider seasonal promotions aligned with peak travel times for key origin markets.
Nearby Short-Term Rental Market Comparison
How does the Barletta Airbnb market stack up against its neighbors? Compare key performance metrics like average monthly revenue, ADR, and occupancy rates in surrounding areas to understand the broader regional STR landscape.
| Market | Active Properties | Monthly Revenue | Daily Rate | Avg. Occupancy |
|---|---|---|---|---|
| Majkovi | 18 | $2,765 | $316.09 | 48% |
| San Michele Salentino | 74 | $2,208 | $260.22 | 44% |
| Donja Banda | 23 | $1,990 | $328.82 | 39% |
| Polignano a Mare | 624 | $1,978 | $205.82 | 44% |
| Castellana Grotte | 185 | $1,845 | $219.26 | 43% |
| Torchiara | 21 | $1,737 | $280.56 | 26% |
| Ostuni | 1,576 | $1,730 | $250.45 | 39% |
| Ceglie Messapica | 380 | $1,660 | $223.98 | 41% |
| Martina Franca | 569 | $1,657 | $217.67 | 39% |
| Monopoli | 1,141 | $1,637 | $195.75 | 43% |