Altamura Airbnb Market Analysis 2025: Short Term Rental Data & Vacation Rental Statistics in Apulia, Italy
Is Airbnb profitable in Altamura in 2025? Explore comprehensive Airbnb analytics for Altamura, Apulia, Italy to uncover income potential. This 2025 STR market report for Altamura, based on AirROI data from April 2024 to March 2025, reveals key trends in the niche market of 90 active listings.
Whether you're considering an Airbnb investment in Altamura, optimizing your existing vacation rental, or exploring rental arbitrage opportunities, understanding the Altamura Airbnb data is crucial. Navigating the high regulation landscape is key to maximizing your short term rental income potential. Let's dive into the specifics.
Key Altamura Airbnb Performance Metrics Overview
Monthly Airbnb Revenue Variations & Income Potential in Altamura (2025)
Understanding the monthly revenue variations for Airbnb listings in Altamura is key to maximizing your short term rental income potential. Seasonality significantly impacts earnings. Our analysis, based on data from the past 12 months, shows that the peak revenue month for STRs in Altamura is typically May, while January often presents the lowest earnings, highlighting opportunities for strategic pricing adjustments during shoulder and low seasons. Explore the typical Airbnb income in Altamura across different performance tiers:
- Best-in-class properties (Top 10%) achieve $1,377+ monthly, often utilizing dynamic pricing and superior guest experiences.
- Strong performing properties (Top 25%) earn $887 or more, indicating effective management and desirable locations/amenities.
- Typical properties (Median) generate around $449 per month, representing the average market performance.
- Entry-level properties (Bottom 25%) see earnings around $235, often with potential for optimization.
Average Monthly Airbnb Earnings Trend in Altamura
Altamura Airbnb Occupancy Rate Trends (2025)
Maximize your bookings by understanding the Altamura STR occupancy trends. Seasonal demand shifts significantly influence how often properties are booked. Typically, Augustsees the highest demand (peak season occupancy), while November experiences the lowest (low season). Effective strategies, like adjusting minimum stays or offering promotions, can boost occupancy during slower periods. Here's how different property tiers perform in Altamura:
- Best-in-class properties (Top 10%) achieve 53%+ occupancy, indicating high desirability and potentially optimized availability.
- Strong performing properties (Top 25%) maintain 38% or higher occupancy, suggesting good market fit and guest satisfaction.
- Typical properties (Median) have an occupancy rate around 21%.
- Entry-level properties (Bottom 25%) average 10% occupancy, potentially facing higher vacancy.
Average Monthly Occupancy Rate Trend in Altamura
Average Daily Rate (ADR) Airbnb Trends in Altamura (2025)
Effective short term rental pricing strategy in Altamura involves understanding monthly ADR fluctuations. The Average Daily Rate (ADR) for Airbnb in Altamura typically peaks in August and dips lowest during February. Leveraging Airbnb dynamic pricing tools or strategies based on this seasonality can significantly boost revenue. Here's a look at the typical nightly rates achieved:
- Best-in-class properties (Top 10%) command rates of $157+ per night, often due to premium features or locations.
- Strong performing properties (Top 25%) achieve nightly rates of $92 or more.
- Typical properties (Median) charge around $73 per night.
- Entry-level properties (Bottom 25%) earn around $57 per night.
Average Daily Rate (ADR) Trend by Month in Altamura
Get Live Altamura Market Intelligence 👇

Explore Real-time Analytics
Airbnb Seasonality Analysis & Trends in Altamura (2025)
Peak Season (May, June, July)
- Revenue averages $889 per month
- Occupancy rates average 30.3%
- Daily rates average $91
Shoulder Season
- Revenue averages $631 per month
- Occupancy maintains around 26.1%
- Daily rates hold near $92
Low Season (January, February, November)
- Revenue drops to average $401 per month
- Occupancy decreases to average 20.0%
- Daily rates adjust to average $91
Seasonality Insights for Altamura
- The Airbnb seasonality in Altamura shows highly seasonal trends requiring careful strategy. While the sections above show seasonal averages, it's also insightful to look at the extremes:
- During the high season, the absolute peak month showcases Altamura's highest earning potential, with monthly revenues capable of climbing to $1,036, occupancy reaching a high of 33.0%, and ADRs peaking at $96.
- Conversely, the slowest single month of the year, typically falling within the low season, marks the market's lowest point. In this month, revenue might dip to $371, occupancy could drop to 19.6%, and ADRs may adjust down to $90.
- Understanding both the seasonal averages and these monthly peaks and troughs in revenue, occupancy, and ADR is crucial for maximizing your Airbnb profit potential in Altamura.
Seasonal Strategies for Maximizing Profit
- Peak Season: Maximize revenue through premium pricing and potentially longer minimum stays. Ensure high availability.
- Low Season: Offer competitive pricing, special promotions (e.g., extended stay discounts), and flexible cancellation policies. Target off-season travelers like remote workers or budget-conscious guests.
- Shoulder Seasons: Implement dynamic pricing that balances peak and low rates. Target weekend travelers or specific events. Offer slightly more flexible terms than peak season.
- Regularly analyze your own performance against these Altamura seasonality benchmarks and adjust your pricing and availability strategy accordingly.
Best Areas for Airbnb Investment in Altamura (2025)
Exploring the top neighborhoods for short-term rentals in Altamura? This section highlights key areas, outlining why they are attractive for hosts and guests, along with notable local attractions. Consider these locations based on your target guest profile and investment strategy.
| Neighborhood / Area | Why Host Here? (Target Guests & Appeal) | Key Attractions & Landmarks |
|---|---|---|
| Centro Storico | The historic center of Altamura, known for its stunning cathedral and ancient architecture. Ideal for tourists wanting to explore cultural landmarks and enjoy local cuisine. | Cattedrale di Altamura, Museo Archeologico, Piazza Garibaldi, Chiesa di San Domenico, Palazzo Calderoni |
| Parco Nazionale dell'Alta Murgia | This area offers natural beauty and outdoor activities, appealing to nature lovers and hikers. A great spot for guests seeking a peaceful retreat in nature. | Hiking trails, Biodiversity, Unique landscapes, Local wildlife, Scenic vistas |
| Area del pane di Altamura | Famous for its traditional Altamura bread, this area attracts food lovers and culinary tourists interested in authentic local experiences. | Local bakeries, Bread workshops, Gastronomy tours, Local markets, Culinary festivals |
| Villaggio La Fenice | A popular resort area for families and tourists looking for leisure and relaxation, with proximity to beaches and recreational activities. | Swimming pools, Sport facilities, Beach access, Family-friendly amenities, Restaurants and bars |
| Contrada Bozze | A tranquil area on the outskirts of Altamura, ideal for countryside retreats and wine tourism, appealing to those looking for a serene getaway. | Vineyards, Wine tours, Organic farms, Countryside views, Local festivals |
| Via Bari | A bustling street known for shopping and dining, making it a vibrant location for guests who want to experience the local urban life. | Shops and boutiques, Restaurants and cafes, Local artisans, Public transport access, Cultural events |
| Cimitero Monumentale | A historical cemetery featuring elaborate tombs and sculptures, attracting visitors interested in history and art. | Historic monuments, Stunning sculptures, Artistic tomb designs, Quiet reflection areas, Local flora |
| Piazza Vittorio Emanuele | A beautiful square that serves as a gathering spot for locals and tourists alike, brimming with cafes and social life. | Cafes and gelaterias, Street performances, Market days, Community events, Festivals |
Understanding Airbnb License Requirements & STR Laws in Altamura (2025)
Yes, Altamura, Apulia, Italy enforces high STR regulations. Obtaining a license and ensuring compliance is almost certainly required according to current 2025 STR laws. Always verify the latest short term rental regulations and Airbnb license requirements directly with local government authorities for Altamura to ensure full compliance before hosting.
(Source: AirROI data, 2025, based on 39% licensed listings)
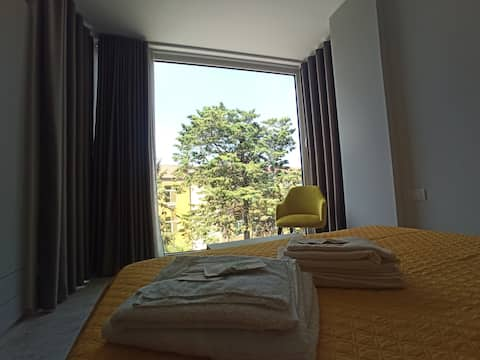
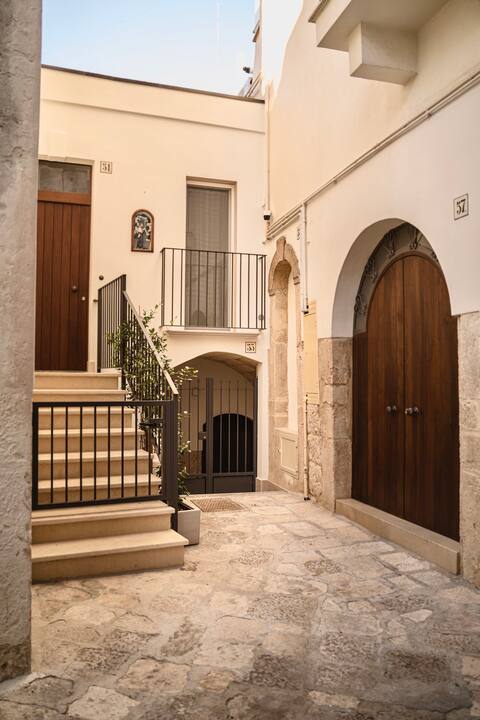
Top Performing Airbnb Properties in Altamura (2025)
Benchmark your potential! Explore examples of top-performing Airbnb properties in Altamurabased on Trailing Twelve Month (TTM) revenue. Analyze their characteristics, revenue, occupancy rate, and ADR to understand what drives success in this market.

Tower Sò Petite Maison - independent accommodation
Entire Place • 2 bedrooms
cute independent apartment sleeps 2-5 beds
Entire Place • 3 bedrooms

B&B terrace sul Teatro
Entire Place • 1 bedroom

Apartment in the historic center
Entire Place • 1 bedroom

B&B Dimora Santa Chiara
Private Room • N/A
DIMORI Guest House - Centro Storico Altamura
Entire Place • 2 bedrooms
Note: Performance varies based on location, size, amenities, seasonality, and management quality. Data reflects the past 12 months.
Top Performing Airbnb Hosts in Altamura (2025)
Learn from the best! This table showcases top-performing Airbnb hosts in Altamura based on the number of properties managed and estimated total revenue over the past year. Analyze their scale and performance metrics.
| Host Name | Properties | Grossing Revenue | Stay Reviews | Avg Rating |
|---|---|---|---|---|
| Host #467947677 | 14 | $27,095 | 9 | 0.71/5.0 |
| Claudio | 1 | $21,440 | 44 | 5.00/5.0 |
| Antonio | 1 | $21,328 | 4 | 4.75/5.0 |
| Host #429638802 | 4 | $17,005 | 0 | 0.00/5.0 |
| Antonio | 4 | $15,221 | 284 | 4.80/5.0 |
| Beppe | 1 | $14,480 | 141 | 4.89/5.0 |
| Petronela Amalia | 1 | $13,593 | 11 | 5.00/5.0 |
| Michelangelo | 1 | $12,780 | 15 | 5.00/5.0 |
| Carmela | 3 | $12,519 | 37 | 4.94/5.0 |
| Marta | 1 | $11,845 | 102 | 4.93/5.0 |
Analyzing the strategies of top hosts, such as their property selection, pricing, and guest communication, can offer valuable lessons for optimizing your own Airbnb operations in Altamura.
Dive Deeper: Advanced Altamura STR Market Data (2025)
Ready to unlock more insights? AirROI provides access to advanced metrics and comprehensive Airbnb data for Altamura. Explore detailed analytics beyond this report to refine your investment strategy, optimize pricing, and maximize your vacation rental profits.
Explore Advanced MetricsAltamura Short-Term Rental Market Composition (2025): Property & Room Types
Room Type Distribution
Property Type Distribution
Market Composition Insights for Altamura
- The Altamura Airbnb market composition is heavily skewed towards Entire Home/Apt listings, which make up 57.8% of the 90 active rentals. This indicates strong guest preference for privacy and space.
- However, a notable 40% share for Private Rooms suggests opportunities for budget-conscious travelers or hosts renting out spare rooms.
- Looking at the property type distribution in Altamura, House properties are the most common (35.6%), reflecting the local real estate landscape.
- Houses represent a significant 35.6% portion, catering likely to families or larger groups.
- The presence of 26.7% Hotel/Boutique listings indicates integration with traditional hospitality.
- Smaller segments like unique stays, outdoor/unique, others (combined 7.7%) offer potential for unique stay experiences.
Altamura Airbnb Room Capacity Analysis (2025): Bedroom Distribution
Distribution of Listings by Number of Bedrooms
Room Capacity Insights for Altamura
- The dominant room capacity in Altamura is 1 bedroom listings, making up 61.1% of the market. This suggests a strong demand for properties suitable for couples or solo travelers.
- Together, 1 bedroom and 2 bedrooms properties represent 76.7% of the active Airbnb listings in Altamura, indicating a high concentration in these sizes.
- With over half the market (61.1%) consisting of studios or 1-bedroom units, Altamura is particularly well-suited for individuals or couples.
- Listings with 3+ bedrooms (8.9%) represent a smaller niche, potentially indicating an underserved market for larger group accommodations in Altamura.
Altamura Vacation Rental Guest Capacity Trends (2025)
Distribution of Listings by Guest Capacity
Guest Capacity Insights for Altamura
- The most common guest capacity trend in Altamura vacation rentals is listings accommodating 4 guests (30%). This suggests the primary traveler segment is likely small families or groups.
- Properties designed for 4 guests and 2 guests dominate the Altamura STR market, accounting for 58.9% of listings.
- 12.2% of properties accommodate 6+ guests, serving the market segment for larger families or group travel in Altamura.
- On average, properties in Altamura are equipped to host 3.1 guests.
Altamura Airbnb Booking Patterns (2025): Available vs. Booked Days
Available Days Distribution
Booked Days Distribution
Booking Pattern Insights for Altamura
- The most common availability pattern in Altamura falls within the 271-366 days range, representing 80% of listings. This suggests many properties have significant open periods on their calendars.
- Approximately 95.6% of listings show high availability (181+ days open annually), indicating potential for increased bookings or specific owner usage patterns.
- For booked days, the 1-30 days range is most frequent in Altamura (40%), reflecting common guest stay durations or potential owner blocking patterns.
- A notable 4.4% of properties secure long booking periods (181+ days booked per year), highlighting successful long-term rental strategies or significant owner usage.
Altamura Airbnb Minimum Stay Requirements Analysis
Distribution of Listings by Minimum Night Requirement
1 Night
56 listings
74.7% of total
2 Nights
7 listings
9.3% of total
3 Nights
1 listings
1.3% of total
7-29 Nights
7 listings
9.3% of total
30+ Nights
4 listings
5.3% of total
Key Insights
- The most prevalent minimum stay requirement in Altamura is 1 Night, adopted by 74.7% of listings. This highlights the market's preference for shorter, flexible bookings.
- A strong majority (84.0%) of the Altamura Airbnb data shows acceptance of very short stays (1-2 nights), indicating a dynamic, high-turnover market.
Recommendations
- Align with the market by considering a 1 Night minimum stay, as 74.7% of Altamura hosts use this setting.
- Explore offering discounts for stays of 30+ nights to attract the 5.3% of the market seeking extended stays.
- Adjust minimum nights based on seasonality – potentially shorter during low season and longer during peak demand periods in Altamura.
Altamura Airbnb Cancellation Policy Trends Analysis (2025)
Flexible
30 listings
60% of total
Moderate
19 listings
38% of total
Strict
1 listings
2% of total
Cancellation Policy Insights for Altamura
- The prevailing Airbnb cancellation policy trend in Altamura is Flexible, used by 60% of listings.
- The market strongly favors guest-friendly terms, with 98.0% of listings offering Flexible or Moderate policies. This suggests guests in Altamura may expect booking flexibility.
- Strict cancellation policies are quite rare (2%), potentially making listings with this policy less competitive unless justified by high demand or property type.
Recommendations for Hosts
- Consider adopting a Flexible policy to align with the 60% market standard in Altamura.
- Given the high prevalence of Flexible policies (60%), offering this can enhance booking appeal, especially during shoulder seasons.
- Using a Strict policy might deter some guests, as only 2% of listings use it. Evaluate if potential revenue protection outweighs possible lower booking rates.
- Regularly review your cancellation policy against competitors and market demand shifts in Altamura.
Altamura STR Booking Lead Time Analysis (2025)
Average Booking Lead Time by Month
Booking Lead Time Insights for Altamura
- The overall average booking lead time for vacation rentals in Altamura is 35 days.
- Guests book furthest in advance for stays during May (average 60 days), likely coinciding with peak travel demand or local events.
- The shortest booking windows occur for stays in November (average 18 days), indicating more last-minute travel plans during this time.
- Seasonally, Spring (46 days avg.) sees the longest lead times, while Winter (31 days avg.) has the shortest, reflecting typical travel planning cycles.
Recommendations for Hosts
- Use the overall average lead time (35 days) as a baseline for your pricing and availability strategy in Altamura.
- For May stays, consider implementing length-of-stay discounts or slightly higher rates for bookings made less than 60 days out to capitalize on advance planning.
- Target marketing efforts for the Spring season well in advance (at least 46 days) to capture early planners.
- Monitor your own booking lead times against these Altamura averages to identify opportunities for dynamic pricing adjustments.
Popular & Essential Airbnb Amenities in Altamura (2025)
Amenity Prevalence
Amenity Insights for Altamura
- Essential amenities in Altamura that guests expect include: Heating, Wifi, TV. Lacking these (any) could significantly impact bookings.
- Popular amenities like Essentials, Hot water, Air conditioning are common but not universal. Offering these can provide a competitive edge.
Recommendations for Hosts
- Ensure your listing includes all essential amenities for Altamura: Heating, Wifi, TV.
- Prioritize adding missing essentials: Heating, Wifi, TV.
- Consider adding popular differentiators like Essentials or Hot water to increase appeal.
- Highlight unique or less common amenities you offer (e.g., hot tub, dedicated workspace, EV charger) in your listing description and photos.
- Regularly check competitor amenities in Altamura to stay competitive.
Altamura Airbnb Guest Demographics & Profile Analysis (2025)
Guest Profile Summary for Altamura
- The typical guest profile for Airbnb in Altamura consists of a mix of domestic (43%) and international guests, with top international origins including France, typically belonging to the Post-2000s (Gen Z/Alpha) group (50%), primarily speaking English or Italian.
- Domestic travelers account for 42.8% of guests.
- Key international markets include Italy (42.8%) and France (19.6%).
- Top languages spoken are English (34.9%) followed by Italian (21.2%).
- A significant demographic segment is the Post-2000s (Gen Z/Alpha) group, representing 50% of guests.
Recommendations for Hosts
- Balance marketing efforts between domestic and international channels based on the guest mix.
- Tailor amenities and listing descriptions to appeal to the dominant Post-2000s (Gen Z/Alpha) demographic (e.g., highlight fast WiFi, smart home features, local guides).
- Highlight unique local experiences or amenities relevant to the primary guest profile.
- Consider seasonal promotions aligned with peak travel times for key origin markets.
Nearby Short-Term Rental Market Comparison
How does the Altamura Airbnb market stack up against its neighbors? Compare key performance metrics like average monthly revenue, ADR, and occupancy rates in surrounding areas to understand the broader regional STR landscape.
| Market | Active Properties | Monthly Revenue | Daily Rate | Avg. Occupancy |
|---|---|---|---|---|
| San Michele Salentino | 74 | $2,208 | $260.22 | 44% |
| Polignano a Mare | 624 | $1,978 | $205.82 | 44% |
| Castellana Grotte | 185 | $1,845 | $219.26 | 43% |
| Torchiara | 21 | $1,737 | $280.56 | 26% |
| Ostuni | 1,576 | $1,730 | $250.45 | 39% |
| Ceglie Messapica | 380 | $1,660 | $223.98 | 41% |
| Martina Franca | 569 | $1,657 | $217.67 | 39% |
| Monopoli | 1,141 | $1,637 | $195.75 | 43% |
| Carovigno | 514 | $1,628 | $260.62 | 40% |
| Alberobello | 280 | $1,607 | $189.82 | 38% |