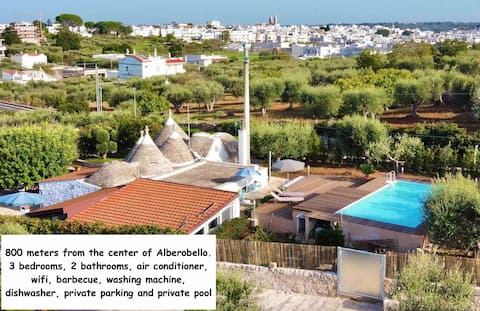
Alberobello Airbnb Market Analysis 2025: Short Term Rental Data & Vacation Rental Statistics in Apulia, Italy
Is Airbnb profitable in Alberobello in 2025? Explore comprehensive Airbnb analytics for Alberobello, Apulia, Italy to uncover income potential. This 2025 STR market report for Alberobello, based on AirROI data from April 2024 to March 2025, reveals key trends in the market of 280 active listings.
Whether you're considering an Airbnb investment in Alberobello, optimizing your existing vacation rental, or exploring rental arbitrage opportunities, understanding the Alberobello Airbnb data is crucial. Navigating the high regulation landscape is key to maximizing your short term rental income potential. Let's dive into the specifics.
Key Alberobello Airbnb Performance Metrics Overview
Monthly Airbnb Revenue Variations & Income Potential in Alberobello (2025)
Understanding the monthly revenue variations for Airbnb listings in Alberobello is key to maximizing your short term rental income potential. Seasonality significantly impacts earnings. Our analysis, based on data from the past 12 months, shows that the peak revenue month for STRs in Alberobello is typically August, while February often presents the lowest earnings, highlighting opportunities for strategic pricing adjustments during shoulder and low seasons. Explore the typical Airbnb income in Alberobello across different performance tiers:
- Best-in-class properties (Top 10%) achieve $5,015+ monthly, often utilizing dynamic pricing and superior guest experiences.
- Strong performing properties (Top 25%) earn $2,910 or more, indicating effective management and desirable locations/amenities.
- Typical properties (Median) generate around $1,458 per month, representing the average market performance.
- Entry-level properties (Bottom 25%) see earnings around $740, often with potential for optimization.
Average Monthly Airbnb Earnings Trend in Alberobello
Alberobello Airbnb Occupancy Rate Trends (2025)
Maximize your bookings by understanding the Alberobello STR occupancy trends. Seasonal demand shifts significantly influence how often properties are booked. Typically, Augustsees the highest demand (peak season occupancy), while February experiences the lowest (low season). Effective strategies, like adjusting minimum stays or offering promotions, can boost occupancy during slower periods. Here's how different property tiers perform in Alberobello:
- Best-in-class properties (Top 10%) achieve 74%+ occupancy, indicating high desirability and potentially optimized availability.
- Strong performing properties (Top 25%) maintain 57% or higher occupancy, suggesting good market fit and guest satisfaction.
- Typical properties (Median) have an occupancy rate around 30%.
- Entry-level properties (Bottom 25%) average 14% occupancy, potentially facing higher vacancy.
Average Monthly Occupancy Rate Trend in Alberobello
Average Daily Rate (ADR) Airbnb Trends in Alberobello (2025)
Effective short term rental pricing strategy in Alberobello involves understanding monthly ADR fluctuations. The Average Daily Rate (ADR) for Airbnb in Alberobello typically peaks in August and dips lowest during March. Leveraging Airbnb dynamic pricing tools or strategies based on this seasonality can significantly boost revenue. Here's a look at the typical nightly rates achieved:
- Best-in-class properties (Top 10%) command rates of $312+ per night, often due to premium features or locations.
- Strong performing properties (Top 25%) achieve nightly rates of $217 or more.
- Typical properties (Median) charge around $149 per night.
- Entry-level properties (Bottom 25%) earn around $105 per night.
Average Daily Rate (ADR) Trend by Month in Alberobello
Get Live Alberobello Market Intelligence 👇

Explore Real-time Analytics
Airbnb Seasonality Analysis & Trends in Alberobello (2025)
Peak Season (August, July, June)
- Revenue averages $3,193 per month
- Occupancy rates average 46.8%
- Daily rates average $203
Shoulder Season
- Revenue averages $2,230 per month
- Occupancy maintains around 37.4%
- Daily rates hold near $185
Low Season (January, February, March)
- Revenue drops to average $1,129 per month
- Occupancy decreases to average 24.0%
- Daily rates adjust to average $166
Seasonality Insights for Alberobello
- The Airbnb seasonality in Alberobello shows highly seasonal trends requiring careful strategy. While the sections above show seasonal averages, it's also insightful to look at the extremes:
- During the high season, the absolute peak month showcases Alberobello's highest earning potential, with monthly revenues capable of climbing to $3,607, occupancy reaching a high of 51.8%, and ADRs peaking at $210.
- Conversely, the slowest single month of the year, typically falling within the low season, marks the market's lowest point. In this month, revenue might dip to $939, occupancy could drop to 22.8%, and ADRs may adjust down to $164.
- Understanding both the seasonal averages and these monthly peaks and troughs in revenue, occupancy, and ADR is crucial for maximizing your Airbnb profit potential in Alberobello.
Seasonal Strategies for Maximizing Profit
- Peak Season: Maximize revenue through premium pricing and potentially longer minimum stays. Ensure high availability.
- Low Season: Offer competitive pricing, special promotions (e.g., extended stay discounts), and flexible cancellation policies. Target off-season travelers like remote workers or budget-conscious guests.
- Shoulder Seasons: Implement dynamic pricing that balances peak and low rates. Target weekend travelers or specific events. Offer slightly more flexible terms than peak season.
- Regularly analyze your own performance against these Alberobello seasonality benchmarks and adjust your pricing and availability strategy accordingly.
Best Areas for Airbnb Investment in Alberobello (2025)
Exploring the top neighborhoods for short-term rentals in Alberobello? This section highlights key areas, outlining why they are attractive for hosts and guests, along with notable local attractions. Consider these locations based on your target guest profile and investment strategy.
| Neighborhood / Area | Why Host Here? (Target Guests & Appeal) | Key Attractions & Landmarks |
|---|---|---|
| Trulli District | Famous for its unique trulli architecture, this area attracts tourists eager to experience the charm of traditional Apulian houses. It offers a picturesque setting and is often featured in travel guides. | Trullo Sovrano, Trulli of Alberobello, Museum of the Territory, Piazza del Popolo, Church of Saint Anthony |
| Historic Center | The heart of Alberobello, characterized by narrow streets and stunning stone buildings. It is a vibrant area that attracts visitors who want to immerse themselves in local culture and history. | Casa D'Amore, Church of Saint Nicholas, Alberobello's viewpoint, Local artisan shops, Restaurants serving traditional Apulian cuisine |
| Rione Monti | One of the two main districts of Alberobello, Rione Monti is known for its thick concentration of trulli. It's perfect for visitors who want to explore the iconic architecture up close and enjoy local souvenir shopping. | Rione Monti Trulli, Trulli with symbols, Local crafts shops, Basilica of Saint Martin, Enoteca |
| Park of the Trulli | A scenic area just outside the main tourist routes where visitors can enjoy nature and see trulli homes in pastoral settings. This area attracts those looking for peace and beautiful landscapes. | Nature trails, Trulli in the countryside, Wildlife watching, Picnic areas, Scenic views |
| Alberobello's Wine Route | For wine lovers, the areas around Alberobello offer access to local vineyards and wineries. This attracts culinary tourists and those interested in enhancing their stay with wine tasting experiences. | Vineyards, Wine tasting tours, Local wine shops, Cooking classes, Gastronomic festivals |
| Local Festivals Area | During the summer, various festivals take place that celebrate local culture, food, and music. An Airbnb here can be popular, especially during festival seasons. | Festa del Trullo, Local food fair, Music festivals, Craft fairs, Cultural exhibitions |
| Foodie District | This area is known for its traditional Apulian cuisine, attracting food enthusiasts eager to try local dishes. Ideal for Airbnb guests who want culinary experiences. | Osterias, Local markets, Cooking classes, Street food experiences, Food festivals |
| Cultural Education Center | This area attracts visitors interested in learning about the cultural heritage of Apulia, offering workshops and educational experiences. It's perfect for families and those wanting a deeper connection to the locale. | Cultural workshops, Cooking workshops, Art classes, Historical exhibitions, Local artisan demonstrations |
Understanding Airbnb License Requirements & STR Laws in Alberobello (2025)
Yes, Alberobello, Apulia, Italy enforces high STR regulations. Obtaining a license and ensuring compliance is almost certainly required according to current 2025 STR laws. Always verify the latest short term rental regulations and Airbnb license requirements directly with local government authorities for Alberobello to ensure full compliance before hosting.
(Source: AirROI data, 2025, based on 73% licensed listings)
Top Performing Airbnb Properties in Alberobello (2025)
Benchmark your potential! Explore examples of top-performing Airbnb properties in Alberobellobased on Trailing Twelve Month (TTM) revenue. Analyze their characteristics, revenue, occupancy rate, and ADR to understand what drives success in this market.
Trullo Barsenta with swimming pool for exclusive use
Entire Place • 3 bedrooms

Trullo Noci pool exclusive use
Entire Place • 3 bedrooms

Trullo Perla Greta - Villa & Private Heated Pool
Entire Place • 3 bedrooms
Petra Suite (Trulli Zone)
Entire Place • 1 bedroom
Trullo with swimming Pool in Puglia - Alberobello
Entire Place • 3 bedrooms
Trullo Stella: Luxury Trullo
Entire Place • 3 bedrooms
Note: Performance varies based on location, size, amenities, seasonality, and management quality. Data reflects the past 12 months.
Top Performing Airbnb Hosts in Alberobello (2025)
Learn from the best! This table showcases top-performing Airbnb hosts in Alberobello based on the number of properties managed and estimated total revenue over the past year. Analyze their scale and performance metrics.
| Host Name | Properties | Grossing Revenue | Stay Reviews | Avg Rating |
|---|---|---|---|---|
| Antonio | 10 | $543,631 | 591 | 4.37/5.0 |
| Trullivacanza At G Mail Do T C | 9 | $468,334 | 346 | 4.71/5.0 |
| Angelo | 5 | $167,465 | 385 | 4.94/5.0 |
| Andrea | 5 | $146,009 | 288 | 4.86/5.0 |
| Antonio | 9 | $134,651 | 24 | 3.28/5.0 |
| Francesco | 5 | $119,614 | 108 | 3.95/5.0 |
| Host #6372003 | 7 | $114,387 | 3 | 0.71/5.0 |
| Stella | 6 | $91,826 | 332 | 4.60/5.0 |
| Silvana | 1 | $88,497 | 42 | 4.98/5.0 |
| Acquafonda | 2 | $86,251 | 71 | 4.93/5.0 |
Analyzing the strategies of top hosts, such as their property selection, pricing, and guest communication, can offer valuable lessons for optimizing your own Airbnb operations in Alberobello.
Dive Deeper: Advanced Alberobello STR Market Data (2025)
Ready to unlock more insights? AirROI provides access to advanced metrics and comprehensive Airbnb data for Alberobello. Explore detailed analytics beyond this report to refine your investment strategy, optimize pricing, and maximize your vacation rental profits.
Explore Advanced MetricsAlberobello Short-Term Rental Market Composition (2025): Property & Room Types
Room Type Distribution
Property Type Distribution
Market Composition Insights for Alberobello
- The Alberobello Airbnb market composition is heavily skewed towards Entire Home/Apt listings, which make up 84.3% of the 280 active rentals. This indicates strong guest preference for privacy and space.
- Looking at the property type distribution in Alberobello, Unique Stays properties are the most common (49.6%), reflecting the local real estate landscape.
- Houses represent a significant 25% portion, catering likely to families or larger groups.
- The presence of 5.7% Hotel/Boutique listings indicates integration with traditional hospitality.
- Smaller segments like others, outdoor/unique (combined 5.7%) offer potential for unique stay experiences.
Alberobello Airbnb Room Capacity Analysis (2025): Bedroom Distribution
Distribution of Listings by Number of Bedrooms
Room Capacity Insights for Alberobello
- The dominant room capacity in Alberobello is 1 bedroom listings, making up 46.4% of the market. This suggests a strong demand for properties suitable for couples or solo travelers.
- Together, 1 bedroom and 2 bedrooms properties represent 80.7% of the active Airbnb listings in Alberobello, indicating a high concentration in these sizes.
Alberobello Vacation Rental Guest Capacity Trends (2025)
Distribution of Listings by Guest Capacity
Guest Capacity Insights for Alberobello
- The most common guest capacity trend in Alberobello vacation rentals is listings accommodating 4 guests (31.4%). This suggests the primary traveler segment is likely small families or groups.
- Properties designed for 4 guests and 2 guests dominate the Alberobello STR market, accounting for 58.5% of listings.
- 17.8% of properties accommodate 6+ guests, serving the market segment for larger families or group travel in Alberobello.
- On average, properties in Alberobello are equipped to host 3.8 guests.
Alberobello Airbnb Booking Patterns (2025): Available vs. Booked Days
Available Days Distribution
Booked Days Distribution
Booking Pattern Insights for Alberobello
- The most common availability pattern in Alberobello falls within the 271-366 days range, representing 54.3% of listings. This suggests many properties have significant open periods on their calendars.
- Approximately 80.4% of listings show high availability (181+ days open annually), indicating potential for increased bookings or specific owner usage patterns.
- For booked days, the 31-90 days range is most frequent in Alberobello (31.1%), reflecting common guest stay durations or potential owner blocking patterns.
- A notable 20.0% of properties secure long booking periods (181+ days booked per year), highlighting successful long-term rental strategies or significant owner usage.
Alberobello Airbnb Minimum Stay Requirements Analysis
Distribution of Listings by Minimum Night Requirement
1 Night
130 listings
47.6% of total
2 Nights
62 listings
22.7% of total
3 Nights
23 listings
8.4% of total
4-6 Nights
9 listings
3.3% of total
7-29 Nights
14 listings
5.1% of total
30+ Nights
35 listings
12.8% of total
Key Insights
- The most prevalent minimum stay requirement in Alberobello is 1 Night, adopted by 47.6% of listings. This highlights the market's preference for shorter, flexible bookings.
- A strong majority (70.3%) of the Alberobello Airbnb data shows acceptance of very short stays (1-2 nights), indicating a dynamic, high-turnover market.
- A significant segment (12.8%) caters to monthly stays (30+ nights) in Alberobello, pointing to opportunities in the extended-stay market.
Recommendations
- Align with the market by considering a 1 Night minimum stay, as 47.6% of Alberobello hosts use this setting.
- Explore offering discounts for stays of 30+ nights to attract the 12.8% of the market seeking extended stays.
- Adjust minimum nights based on seasonality – potentially shorter during low season and longer during peak demand periods in Alberobello.
Alberobello Airbnb Cancellation Policy Trends Analysis (2025)
Super Strict 30 Days
4 listings
1.7% of total
Flexible
72 listings
30.4% of total
Moderate
106 listings
44.7% of total
Strict
55 listings
23.2% of total
Cancellation Policy Insights for Alberobello
- The prevailing Airbnb cancellation policy trend in Alberobello is Moderate, used by 44.7% of listings.
- The market strongly favors guest-friendly terms, with 75.1% of listings offering Flexible or Moderate policies. This suggests guests in Alberobello may expect booking flexibility.
Recommendations for Hosts
- Consider adopting a Moderate policy to align with the 44.7% market standard in Alberobello.
- Regularly review your cancellation policy against competitors and market demand shifts in Alberobello.
Alberobello STR Booking Lead Time Analysis (2025)
Average Booking Lead Time by Month
Booking Lead Time Insights for Alberobello
- The overall average booking lead time for vacation rentals in Alberobello is 62 days.
- Guests book furthest in advance for stays during May (average 97 days), likely coinciding with peak travel demand or local events.
- The shortest booking windows occur for stays in December (average 37 days), indicating more last-minute travel plans during this time.
- Seasonally, Summer (78 days avg.) sees the longest lead times, while Winter (43 days avg.) has the shortest, reflecting typical travel planning cycles.
Recommendations for Hosts
- Use the overall average lead time (62 days) as a baseline for your pricing and availability strategy in Alberobello.
- For May stays, consider implementing length-of-stay discounts or slightly higher rates for bookings made less than 97 days out to capitalize on advance planning.
- Target marketing efforts for the Summer season well in advance (at least 78 days) to capture early planners.
- Monitor your own booking lead times against these Alberobello averages to identify opportunities for dynamic pricing adjustments.
Popular & Essential Airbnb Amenities in Alberobello (2025)
Amenity Prevalence
Amenity Insights for Alberobello
- Popular amenities like Heating, Hair dryer, Wifi are common but not universal. Offering these can provide a competitive edge.
- Warning: Wifi is not universally provided but is considered essential globally. Ensure reliable Wifi is offered.
Recommendations for Hosts
- Consider adding popular differentiators like Heating or Hair dryer to increase appeal.
- Highlight unique or less common amenities you offer (e.g., hot tub, dedicated workspace, EV charger) in your listing description and photos.
- Regularly check competitor amenities in Alberobello to stay competitive.
Alberobello Airbnb Guest Demographics & Profile Analysis (2025)
Guest Profile Summary for Alberobello
- The typical guest profile for Airbnb in Alberobello consists of predominantly international visitors (90%), with top international origins including France, typically belonging to the Post-2000s (Gen Z/Alpha) group (50%), primarily speaking English or French.
- Domestic travelers account for 10.1% of guests.
- Key international markets include United States (16.6%) and France (16.1%).
- Top languages spoken are English (43.2%) followed by French (14.1%).
- A significant demographic segment is the Post-2000s (Gen Z/Alpha) group, representing 50% of guests.
Recommendations for Hosts
- Focus marketing internationally, particularly towards travelers from France.
- Tailor amenities and listing descriptions to appeal to the dominant Post-2000s (Gen Z/Alpha) demographic (e.g., highlight fast WiFi, smart home features, local guides).
- Highlight unique local experiences or amenities relevant to the primary guest profile.
- Consider seasonal promotions aligned with peak travel times for key origin markets.
Nearby Short-Term Rental Market Comparison
How does the Alberobello Airbnb market stack up against its neighbors? Compare key performance metrics like average monthly revenue, ADR, and occupancy rates in surrounding areas to understand the broader regional STR landscape.
| Market | Active Properties | Monthly Revenue | Daily Rate | Avg. Occupancy |
|---|---|---|---|---|
| San Michele Salentino | 74 | $2,208 | $260.22 | 44% |
| Polignano a Mare | 624 | $1,978 | $205.82 | 44% |
| Castellana Grotte | 185 | $1,845 | $219.26 | 43% |
| Ostuni | 1,576 | $1,730 | $250.45 | 39% |
| Ceglie Messapica | 380 | $1,660 | $223.98 | 41% |
| Martina Franca | 569 | $1,657 | $217.67 | 39% |
| Monopoli | 1,141 | $1,637 | $195.75 | 43% |
| Carovigno | 514 | $1,628 | $260.62 | 40% |
| San Vito dei Normanni | 168 | $1,604 | $219.74 | 43% |
| San Pietro in Lama | 11 | $1,601 | $158.18 | 41% |