Sarre Airbnb Market Analysis 2025: Short Term Rental Data & Vacation Rental Statistics in Aosta Valley, Italy
Is Airbnb profitable in Sarre in 2025? Explore comprehensive Airbnb analytics for Sarre, Aosta Valley, Italy to uncover income potential. This 2025 STR market report for Sarre, based on AirROI data from April 2024 to March 2025, reveals key trends in the niche market of 72 active listings.
Whether you're considering an Airbnb investment in Sarre, optimizing your existing vacation rental, or exploring rental arbitrage opportunities, understanding the Sarre Airbnb data is crucial. Navigating the high regulation landscape is key to maximizing your short term rental income potential. Let's dive into the specifics.
Key Sarre Airbnb Performance Metrics Overview
Monthly Airbnb Revenue Variations & Income Potential in Sarre (2025)
Understanding the monthly revenue variations for Airbnb listings in Sarre is key to maximizing your short term rental income potential. Seasonality significantly impacts earnings. Our analysis, based on data from the past 12 months, shows that the peak revenue month for STRs in Sarre is typically August, while November often presents the lowest earnings, highlighting opportunities for strategic pricing adjustments during shoulder and low seasons. Explore the typical Airbnb income in Sarre across different performance tiers:
- Best-in-class properties (Top 10%) achieve $3,049+ monthly, often utilizing dynamic pricing and superior guest experiences.
- Strong performing properties (Top 25%) earn $1,862 or more, indicating effective management and desirable locations/amenities.
- Typical properties (Median) generate around $1,127 per month, representing the average market performance.
- Entry-level properties (Bottom 25%) see earnings around $587, often with potential for optimization.
Average Monthly Airbnb Earnings Trend in Sarre
Sarre Airbnb Occupancy Rate Trends (2025)
Maximize your bookings by understanding the Sarre STR occupancy trends. Seasonal demand shifts significantly influence how often properties are booked. Typically, Augustsees the highest demand (peak season occupancy), while November experiences the lowest (low season). Effective strategies, like adjusting minimum stays or offering promotions, can boost occupancy during slower periods. Here's how different property tiers perform in Sarre:
- Best-in-class properties (Top 10%) achieve 71%+ occupancy, indicating high desirability and potentially optimized availability.
- Strong performing properties (Top 25%) maintain 53% or higher occupancy, suggesting good market fit and guest satisfaction.
- Typical properties (Median) have an occupancy rate around 32%.
- Entry-level properties (Bottom 25%) average 16% occupancy, potentially facing higher vacancy.
Average Monthly Occupancy Rate Trend in Sarre
Average Daily Rate (ADR) Airbnb Trends in Sarre (2025)
Effective short term rental pricing strategy in Sarre involves understanding monthly ADR fluctuations. The Average Daily Rate (ADR) for Airbnb in Sarre typically peaks in December and dips lowest during November. Leveraging Airbnb dynamic pricing tools or strategies based on this seasonality can significantly boost revenue. Here's a look at the typical nightly rates achieved:
- Best-in-class properties (Top 10%) command rates of $214+ per night, often due to premium features or locations.
- Strong performing properties (Top 25%) achieve nightly rates of $139 or more.
- Typical properties (Median) charge around $101 per night.
- Entry-level properties (Bottom 25%) earn around $79 per night.
Average Daily Rate (ADR) Trend by Month in Sarre
Get Live Sarre Market Intelligence 👇

Explore Real-time Analytics
Airbnb Seasonality Analysis & Trends in Sarre (2025)
Peak Season (August, July, June)
- Revenue averages $2,159 per month
- Occupancy rates average 50.2%
- Daily rates average $131
Shoulder Season
- Revenue averages $1,440 per month
- Occupancy maintains around 33.2%
- Daily rates hold near $130
Low Season (March, October, November)
- Revenue drops to average $968 per month
- Occupancy decreases to average 27.4%
- Daily rates adjust to average $123
Seasonality Insights for Sarre
- The Airbnb seasonality in Sarre shows highly seasonal trends requiring careful strategy. While the sections above show seasonal averages, it's also insightful to look at the extremes:
- During the high season, the absolute peak month showcases Sarre's highest earning potential, with monthly revenues capable of climbing to $2,578, occupancy reaching a high of 64.9%, and ADRs peaking at $139.
- Conversely, the slowest single month of the year, typically falling within the low season, marks the market's lowest point. In this month, revenue might dip to $792, occupancy could drop to 21.8%, and ADRs may adjust down to $119.
- Understanding both the seasonal averages and these monthly peaks and troughs in revenue, occupancy, and ADR is crucial for maximizing your Airbnb profit potential in Sarre.
Seasonal Strategies for Maximizing Profit
- Peak Season: Maximize revenue through premium pricing and potentially longer minimum stays. Ensure high availability.
- Low Season: Offer competitive pricing, special promotions (e.g., extended stay discounts), and flexible cancellation policies. Target off-season travelers like remote workers or budget-conscious guests.
- Shoulder Seasons: Implement dynamic pricing that balances peak and low rates. Target weekend travelers or specific events. Offer slightly more flexible terms than peak season.
- Regularly analyze your own performance against these Sarre seasonality benchmarks and adjust your pricing and availability strategy accordingly.
Best Areas for Airbnb Investment in Sarre (2025)
Exploring the top neighborhoods for short-term rentals in Sarre? This section highlights key areas, outlining why they are attractive for hosts and guests, along with notable local attractions. Consider these locations based on your target guest profile and investment strategy.
| Neighborhood / Area | Why Host Here? (Target Guests & Appeal) | Key Attractions & Landmarks |
|---|---|---|
| Courmayeur | Famous alpine resort known for its stunning views of Mont Blanc and excellent skiing opportunities. Attracts both winter sports enthusiasts and summer hikers looking to explore the natural beauty of the Aosta Valley. | Mont Blanc, Plan Checrouit Ski Area, Skyway Monte Bianco, Courmayeur town center, Thermes de Pré-Saint-Didier, Hiking trails |
| Aosta | The capital of the Aosta Valley, rich in history and culture, with Roman ruins and medieval architecture. Ideal for cultural tourists and those exploring the region's heritage. | Aosta Roman Theatre, Aosta Cathedral, Arch of Augustus, Sant'Orso Church, Castello di Fenis, Parco Nazionale Gran Paradiso |
| La Thuile | A ski resort that offers both winter and summer activities, popular for families and outdoor enthusiasts. Provides access to vast skiing areas and beautiful hiking routes. | La Thuile Ski Resort, Valle d'Aosta, Outdoor sports activities, Mont Blanc Natural Resort, Hiking trails, Restaurants and shops |
| Champoluc | Part of the Monterosa Ski area, this village is known for its beautiful landscapes and outdoor activities, appealing to nature lovers and winter sports fans. | Monterosa Ski, Colle Bettaforca, Champoluc village, Hiking routes, Cultural events, Local gastronomy |
| Gressoney-la-Trinité | Charming alpine village known for its luxurious chalets and skiing opportunities. A perfect base for both relaxation and adventure in the mountains. | Gressoney Ski Resort, Castel Savoia, Nature trails, Cultural heritage, Culinary experiences, Mountain views |
| Bard | A small village known for the impressive Forte di Bard. Attractive for history enthusiasts and visitors looking for scenic views and cultural experiences. | Forte di Bard, Bard Archaeological Museum, Scenic viewpoints, Local festivals, Historical architecture, Walking trails |
| Cogne | Famous for its natural park and beautiful landscapes, Cogne is a vibrant destination for those interested in hiking and nature activities. | Gran Paradiso National Park, Cogne village, Nature activities, Wildlife spotting, Local cheese tasting, Scenic hikes |
| Rhemes Notre Dame | A picturesque village that offers tranquility and access to stunning nature, ideal for those looking for a peaceful retreat in the mountains. | Nature walks, Local flora and fauna, Beautiful landscapes, Cultural traditions, Mountain biking, Skiing in winter |
Understanding Airbnb License Requirements & STR Laws in Sarre (2025)
Yes, Sarre, Aosta Valley, Italy enforces high STR regulations. Obtaining a license and ensuring compliance is almost certainly required according to current 2025 STR laws. Always verify the latest short term rental regulations and Airbnb license requirements directly with local government authorities for Sarre to ensure full compliance before hosting.
(Source: AirROI data, 2025, based on 75% licensed listings)
Top Performing Airbnb Properties in Sarre (2025)
Benchmark your potential! Explore examples of top-performing Airbnb properties in Sarrebased on Trailing Twelve Month (TTM) revenue. Analyze their characteristics, revenue, occupancy rate, and ADR to understand what drives success in this market.
La Maison Du Renard
Entire Place • 2 bedrooms
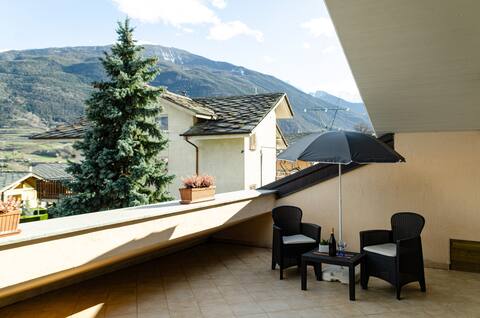
Sarre Skyline Apartment - Relax in Valle d'Aosta
Entire Place • 1 bedroom
Apartment Maison Grenade - Sarre
Entire Place • 1 bedroom
Villa Adry - Mon Reve -SKI for You
Entire Place • 2 bedrooms

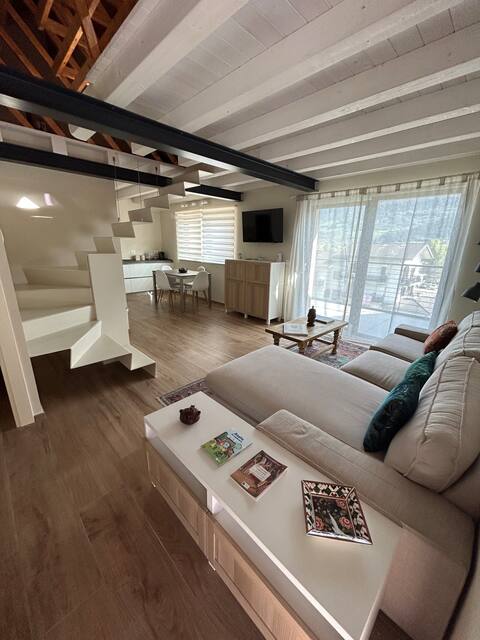
La Meta - Full apt, ideal for skiing and relaxation
Entire Place • 2 bedrooms

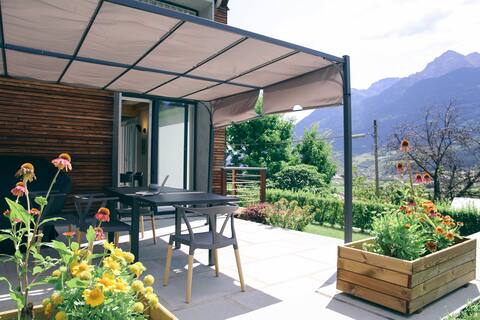
Apartment with balcony & view (Casa Alpina-Sarre)
Entire Place • 2 bedrooms
Note: Performance varies based on location, size, amenities, seasonality, and management quality. Data reflects the past 12 months.
Top Performing Airbnb Hosts in Sarre (2025)
Learn from the best! This table showcases top-performing Airbnb hosts in Sarre based on the number of properties managed and estimated total revenue over the past year. Analyze their scale and performance metrics.
| Host Name | Properties | Grossing Revenue | Stay Reviews | Avg Rating |
|---|---|---|---|---|
| Alessandra - Interhome Group | 7 | $120,932 | 199 | 4.81/5.0 |
| Host #33481118 | 1 | $103,289 | 12 | 5.00/5.0 |
| VdaLux | 2 | $59,366 | 18 | 4.50/5.0 |
| Tania | 2 | $51,389 | 100 | 4.93/5.0 |
| Alessandra | 4 | $43,986 | 391 | 4.96/5.0 |
| Jessica | 2 | $39,007 | 72 | 4.88/5.0 |
| Daniele | 1 | $36,178 | 21 | 4.95/5.0 |
| Paolo | 1 | $34,404 | 7 | 4.86/5.0 |
| Licia | 1 | $29,643 | 51 | 4.90/5.0 |
| Umberto | 2 | $28,700 | 103 | 4.82/5.0 |
Analyzing the strategies of top hosts, such as their property selection, pricing, and guest communication, can offer valuable lessons for optimizing your own Airbnb operations in Sarre.
Dive Deeper: Advanced Sarre STR Market Data (2025)
Ready to unlock more insights? AirROI provides access to advanced metrics and comprehensive Airbnb data for Sarre. Explore detailed analytics beyond this report to refine your investment strategy, optimize pricing, and maximize your vacation rental profits.
Explore Advanced MetricsSarre Short-Term Rental Market Composition (2025): Property & Room Types
Room Type Distribution
Property Type Distribution
Market Composition Insights for Sarre
- The Sarre Airbnb market composition is heavily skewed towards Entire Home/Apt listings, which make up 94.4% of the 72 active rentals. This indicates strong guest preference for privacy and space.
- Looking at the property type distribution in Sarre, Apartment/Condo properties are the most common (70.8%), reflecting the local real estate landscape.
- Houses represent a significant 22.2% portion, catering likely to families or larger groups.
- Smaller segments like hotel/boutique (combined 1.4%) offer potential for unique stay experiences.
Sarre Airbnb Room Capacity Analysis (2025): Bedroom Distribution
Distribution of Listings by Number of Bedrooms
Room Capacity Insights for Sarre
- The dominant room capacity in Sarre is 1 bedroom listings, making up 43.1% of the market. This suggests a strong demand for properties suitable for couples or solo travelers.
- Together, 1 bedroom and 2 bedrooms properties represent 84.8% of the active Airbnb listings in Sarre, indicating a high concentration in these sizes.
- Listings with 3+ bedrooms (7.0%) represent a smaller niche, potentially indicating an underserved market for larger group accommodations in Sarre.
Sarre Vacation Rental Guest Capacity Trends (2025)
Distribution of Listings by Guest Capacity
Guest Capacity Insights for Sarre
- The most common guest capacity trend in Sarre vacation rentals is listings accommodating 4 guests (43.1%). This suggests the primary traveler segment is likely small families or groups.
- Properties designed for 4 guests and 2 guests dominate the Sarre STR market, accounting for 58.4% of listings.
- 16.7% of properties accommodate 6+ guests, serving the market segment for larger families or group travel in Sarre.
- On average, properties in Sarre are equipped to host 4.0 guests.
Sarre Airbnb Booking Patterns (2025): Available vs. Booked Days
Available Days Distribution
Booked Days Distribution
Booking Pattern Insights for Sarre
- The most common availability pattern in Sarre falls within the 271-366 days range, representing 48.6% of listings. This suggests many properties have significant open periods on their calendars.
- Approximately 84.7% of listings show high availability (181+ days open annually), indicating potential for increased bookings or specific owner usage patterns.
- For booked days, the 91-180 days range is most frequent in Sarre (37.5%), reflecting common guest stay durations or potential owner blocking patterns.
- A notable 15.3% of properties secure long booking periods (181+ days booked per year), highlighting successful long-term rental strategies or significant owner usage.
Sarre Airbnb Minimum Stay Requirements Analysis
Distribution of Listings by Minimum Night Requirement
1 Night
14 listings
21.9% of total
2 Nights
20 listings
31.3% of total
3 Nights
4 listings
6.3% of total
4-6 Nights
5 listings
7.8% of total
7-29 Nights
2 listings
3.1% of total
30+ Nights
19 listings
29.7% of total
Key Insights
- The most prevalent minimum stay requirement in Sarre is 2 Nights, adopted by 31.3% of listings. This highlights the market's preference for shorter, flexible bookings.
- A significant segment (29.7%) caters to monthly stays (30+ nights) in Sarre, pointing to opportunities in the extended-stay market.
Recommendations
- Align with the market by considering a 2 Nights minimum stay, as 31.3% of Sarre hosts use this setting.
- If feasible, allowing 1-night stays, especially midweek or during low season, could capture last-minute bookings, as only 21.9% currently do.
- Explore offering discounts for stays of 30+ nights to attract the 29.7% of the market seeking extended stays.
- Adjust minimum nights based on seasonality – potentially shorter during low season and longer during peak demand periods in Sarre.
Sarre Airbnb Cancellation Policy Trends Analysis (2025)
Super Strict 30 Days
11 listings
17.5% of total
Flexible
17 listings
27% of total
Moderate
26 listings
41.3% of total
Strict
9 listings
14.3% of total
Cancellation Policy Insights for Sarre
- The prevailing Airbnb cancellation policy trend in Sarre is Moderate, used by 41.3% of listings.
- There's a relatively balanced mix between guest-friendly (68.3%) and stricter (14.3%) policies, offering choices for different guest needs.
Recommendations for Hosts
- Consider adopting a Moderate policy to align with the 41.3% market standard in Sarre.
- Using a Strict policy might deter some guests, as only 14.3% of listings use it. Evaluate if potential revenue protection outweighs possible lower booking rates.
- Regularly review your cancellation policy against competitors and market demand shifts in Sarre.
Sarre STR Booking Lead Time Analysis (2025)
Average Booking Lead Time by Month
Booking Lead Time Insights for Sarre
- The overall average booking lead time for vacation rentals in Sarre is 53 days.
- Guests book furthest in advance for stays during August (average 81 days), likely coinciding with peak travel demand or local events.
- The shortest booking windows occur for stays in November (average 18 days), indicating more last-minute travel plans during this time.
- Seasonally, Summer (79 days avg.) sees the longest lead times, while Spring (36 days avg.) has the shortest, reflecting typical travel planning cycles.
Recommendations for Hosts
- Use the overall average lead time (53 days) as a baseline for your pricing and availability strategy in Sarre.
- For August stays, consider implementing length-of-stay discounts or slightly higher rates for bookings made less than 81 days out to capitalize on advance planning.
- Target marketing efforts for the Summer season well in advance (at least 79 days) to capture early planners.
- Monitor your own booking lead times against these Sarre averages to identify opportunities for dynamic pricing adjustments.
Popular & Essential Airbnb Amenities in Sarre (2025)
Amenity Prevalence
Amenity Insights for Sarre
- Essential amenities in Sarre that guests expect include: Hot water. Lacking these (this) could significantly impact bookings.
- Popular amenities like Kitchen, Heating, Dishes and silverware are common but not universal. Offering these can provide a competitive edge.
Recommendations for Hosts
- Ensure your listing includes all essential amenities for Sarre: Hot water.
- Prioritize adding missing essentials: Hot water.
- Consider adding popular differentiators like Kitchen or Heating to increase appeal.
- Highlight unique or less common amenities you offer (e.g., hot tub, dedicated workspace, EV charger) in your listing description and photos.
- Regularly check competitor amenities in Sarre to stay competitive.
Sarre Airbnb Guest Demographics & Profile Analysis (2025)
Guest Profile Summary for Sarre
- The typical guest profile for Airbnb in Sarre consists of a mix of domestic (38%) and international guests, with top international origins including France, typically belonging to the Post-2000s (Gen Z/Alpha) group (50%), primarily speaking English or French.
- Domestic travelers account for 38.0% of guests.
- Key international markets include Italy (38%) and France (24.5%).
- Top languages spoken are English (36.3%) followed by French (21.2%).
- A significant demographic segment is the Post-2000s (Gen Z/Alpha) group, representing 50% of guests.
Recommendations for Hosts
- Focus marketing internationally, particularly towards travelers from France.
- Tailor amenities and listing descriptions to appeal to the dominant Post-2000s (Gen Z/Alpha) demographic (e.g., highlight fast WiFi, smart home features, local guides).
- Highlight unique local experiences or amenities relevant to the primary guest profile.
- Consider seasonal promotions aligned with peak travel times for key origin markets.
Nearby Short-Term Rental Market Comparison
How does the Sarre Airbnb market stack up against its neighbors? Compare key performance metrics like average monthly revenue, ADR, and occupancy rates in surrounding areas to understand the broader regional STR landscape.
| Market | Active Properties | Monthly Revenue | Daily Rate | Avg. Occupancy |
|---|---|---|---|---|
| Lauterbrunnen | 525 | $7,079 | $546.45 | 54% |
| La Rivière-Enverse | 17 | $5,972 | $624.02 | 41% |
| Les Clefs | 30 | $5,741 | $323.11 | 44% |
| Matten bei Interlaken | 52 | $5,674 | $316.63 | 63% |
| Iseltwald | 14 | $5,491 | $331.95 | 58% |
| Habkern | 13 | $5,382 | $344.74 | 50% |
| Interlaken | 288 | $4,987 | $310.52 | 56% |
| Grindelwald | 489 | $4,921 | $345.40 | 57% |
| Zermatt | 734 | $4,604 | $463.00 | 46% |
| Oberhofen am Thunersee | 24 | $4,572 | $265.94 | 55% |