Nus Airbnb Market Analysis 2025: Short Term Rental Data & Vacation Rental Statistics in Aosta Valley, Italy
Is Airbnb profitable in Nus in 2025? Explore comprehensive Airbnb analytics for Nus, Aosta Valley, Italy to uncover income potential. This 2025 STR market report for Nus, based on AirROI data from April 2024 to March 2025, reveals key trends in the niche market of 37 active listings.
Whether you're considering an Airbnb investment in Nus, optimizing your existing vacation rental, or exploring rental arbitrage opportunities, understanding the Nus Airbnb data is crucial. Navigating the high regulation landscape is key to maximizing your short term rental income potential. Let's dive into the specifics.
Key Nus Airbnb Performance Metrics Overview
Monthly Airbnb Revenue Variations & Income Potential in Nus (2025)
Understanding the monthly revenue variations for Airbnb listings in Nus is key to maximizing your short term rental income potential. Seasonality significantly impacts earnings. Our analysis, based on data from the past 12 months, shows that the peak revenue month for STRs in Nus is typically August, while November often presents the lowest earnings, highlighting opportunities for strategic pricing adjustments during shoulder and low seasons. Explore the typical Airbnb income in Nus across different performance tiers:
- Best-in-class properties (Top 10%) achieve $2,448+ monthly, often utilizing dynamic pricing and superior guest experiences.
- Strong performing properties (Top 25%) earn $1,781 or more, indicating effective management and desirable locations/amenities.
- Typical properties (Median) generate around $1,217 per month, representing the average market performance.
- Entry-level properties (Bottom 25%) see earnings around $653, often with potential for optimization.
Average Monthly Airbnb Earnings Trend in Nus
Nus Airbnb Occupancy Rate Trends (2025)
Maximize your bookings by understanding the Nus STR occupancy trends. Seasonal demand shifts significantly influence how often properties are booked. Typically, Augustsees the highest demand (peak season occupancy), while November experiences the lowest (low season). Effective strategies, like adjusting minimum stays or offering promotions, can boost occupancy during slower periods. Here's how different property tiers perform in Nus:
- Best-in-class properties (Top 10%) achieve 79%+ occupancy, indicating high desirability and potentially optimized availability.
- Strong performing properties (Top 25%) maintain 65% or higher occupancy, suggesting good market fit and guest satisfaction.
- Typical properties (Median) have an occupancy rate around 44%.
- Entry-level properties (Bottom 25%) average 23% occupancy, potentially facing higher vacancy.
Average Monthly Occupancy Rate Trend in Nus
Average Daily Rate (ADR) Airbnb Trends in Nus (2025)
Effective short term rental pricing strategy in Nus involves understanding monthly ADR fluctuations. The Average Daily Rate (ADR) for Airbnb in Nus typically peaks in December and dips lowest during February. Leveraging Airbnb dynamic pricing tools or strategies based on this seasonality can significantly boost revenue. Here's a look at the typical nightly rates achieved:
- Best-in-class properties (Top 10%) command rates of $167+ per night, often due to premium features or locations.
- Strong performing properties (Top 25%) achieve nightly rates of $111 or more.
- Typical properties (Median) charge around $86 per night.
- Entry-level properties (Bottom 25%) earn around $69 per night.
Average Daily Rate (ADR) Trend by Month in Nus
Get Live Nus Market Intelligence 👇

Explore Real-time Analytics
Airbnb Seasonality Analysis & Trends in Nus (2025)
Peak Season (August, July, June)
- Revenue averages $1,962 per month
- Occupancy rates average 63.1%
- Daily rates average $109
Shoulder Season
- Revenue averages $1,272 per month
- Occupancy maintains around 42.3%
- Daily rates hold near $107
Low Season (April, October, November)
- Revenue drops to average $920 per month
- Occupancy decreases to average 34.3%
- Daily rates adjust to average $105
Seasonality Insights for Nus
- The Airbnb seasonality in Nus shows highly seasonal trends requiring careful strategy. While the sections above show seasonal averages, it's also insightful to look at the extremes:
- During the high season, the absolute peak month showcases Nus's highest earning potential, with monthly revenues capable of climbing to $2,271, occupancy reaching a high of 73.2%, and ADRs peaking at $117.
- Conversely, the slowest single month of the year, typically falling within the low season, marks the market's lowest point. In this month, revenue might dip to $789, occupancy could drop to 30.7%, and ADRs may adjust down to $102.
- Understanding both the seasonal averages and these monthly peaks and troughs in revenue, occupancy, and ADR is crucial for maximizing your Airbnb profit potential in Nus.
Seasonal Strategies for Maximizing Profit
- Peak Season: Maximize revenue through premium pricing and potentially longer minimum stays. Ensure high availability.
- Low Season: Offer competitive pricing, special promotions (e.g., extended stay discounts), and flexible cancellation policies. Target off-season travelers like remote workers or budget-conscious guests.
- Shoulder Seasons: Implement dynamic pricing that balances peak and low rates. Target weekend travelers or specific events. Offer slightly more flexible terms than peak season.
- Regularly analyze your own performance against these Nus seasonality benchmarks and adjust your pricing and availability strategy accordingly.
Best Areas for Airbnb Investment in Nus (2025)
Exploring the top neighborhoods for short-term rentals in Nus? This section highlights key areas, outlining why they are attractive for hosts and guests, along with notable local attractions. Consider these locations based on your target guest profile and investment strategy.
| Neighborhood / Area | Why Host Here? (Target Guests & Appeal) | Key Attractions & Landmarks |
|---|---|---|
| Courmayeur | Renowned for its stunning views of Mont Blanc and ski resorts, it's a favorite destination for tourists seeking both summer and winter activities. | Mont Blanc, Courmayeur Ski Resort, Skyway Monte Bianco, Val Ferret, Giardino Botanico Alpino Saussurea |
| Aosta | The capital city of the Aosta Valley, rich in history and architecture, attract visitors interested in culture and ancient Roman sites. | Roman Theatre, Aosta Cathedral, Arco d'Augusto, Castello di Fenis, Piazza Emile Chanoux |
| La Thuile | A charming ski resort that offers year-round outdoor activities and a more tranquil atmosphere for relaxation and nature enthusiasts. | La Thuile Ski Resort, Les Suches, Parco Nazionale del Gran Paradiso, Fortificazioni di La Thuile |
| Cogne | Situated within the Gran Paradiso National Park, it's ideal for nature lovers and hikers. Offers breathtaking views and outdoor adventures. | Gran Paradiso National Park, Ecole de ski de Cogne, Valnontey, Cogne's historic center, Lago di Cogne |
| Pila | A ski resort easily accessible from Aosta, known for its family-friendly slopes and panoramic views, attracting winter sports enthusiasts. | Pila Ski Resort, Montesus, Pista di San Lorenzo, Sentiero del Lupo |
| Gressoney-Saint-Jean | An attractive resort destination for skiing and hiking, known for its Walser culture and beautiful landscapes. | Monte Rosa, Castel Savoia, Valle di Gressoney, Braulio Park |
| Vallée d'Aoste | A scenic area with charming villages, rich in biodiversity and offering numerous trails for hiking, biking and outdoor sports. | Champlong, Saint-Ours, Bard Fortress, Lago di Brissogne |
| Saint-Vincent | Famous for its thermal baths and wellness tourism, it attracts visitors seeking relaxation and health treatments. | Terme di Saint-Vincent, Casino de la Vallée, Col de Joux, Chiesa Parrocchiale di San Vincenzo |
Understanding Airbnb License Requirements & STR Laws in Nus (2025)
Yes, Nus, Aosta Valley, Italy enforces high STR regulations. Obtaining a license and ensuring compliance is almost certainly required according to current 2025 STR laws. Always verify the latest short term rental regulations and Airbnb license requirements directly with local government authorities for Nus to ensure full compliance before hosting.
(Source: AirROI data, 2025, based on 73% licensed listings)
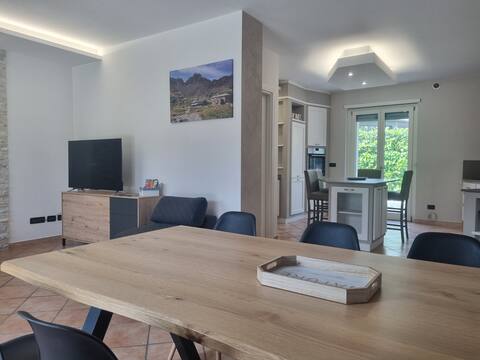
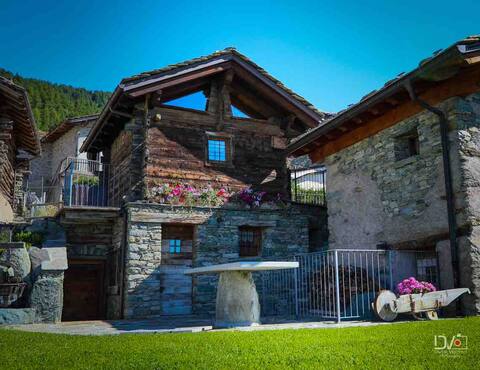
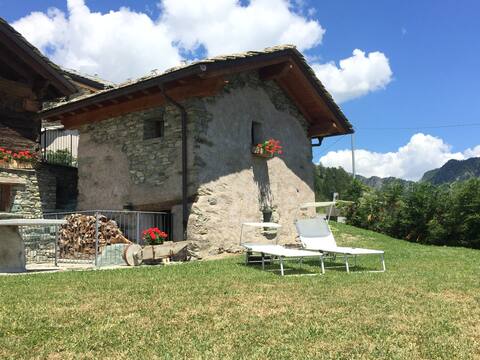
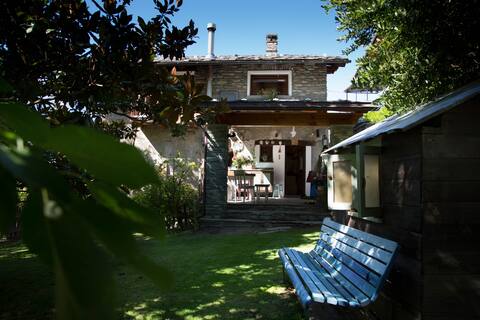
Top Performing Airbnb Properties in Nus (2025)
Benchmark your potential! Explore examples of top-performing Airbnb properties in Nusbased on Trailing Twelve Month (TTM) revenue. Analyze their characteristics, revenue, occupancy rate, and ADR to understand what drives success in this market.
Suite in the heart of the Valley
Entire Place • 2 bedrooms
Lo Grenier - Chalet con vista a Saint Barthélemy
Entire Place • 1 bedroom
Lo Tzambron-Villetta with a view in Saint Barthélemy
Entire Place • 1 bedroom

Peace and nature in Aosta Valley.
Entire Place • 2 bedrooms
Lo Talapan: an elegant farmhouse
Entire Place • 2 bedrooms
"La tsambra" CIR: VDA - NUS - n. 0010
Entire Place • 2 bedrooms
Note: Performance varies based on location, size, amenities, seasonality, and management quality. Data reflects the past 12 months.
Top Performing Airbnb Hosts in Nus (2025)
Learn from the best! This table showcases top-performing Airbnb hosts in Nus based on the number of properties managed and estimated total revenue over the past year. Analyze their scale and performance metrics.
| Host Name | Properties | Grossing Revenue | Stay Reviews | Avg Rating |
|---|---|---|---|---|
| Elena | 4 | $62,937 | 109 | 4.91/5.0 |
| Luca | 2 | $52,736 | 210 | 4.94/5.0 |
| Fabio | 2 | $49,209 | 32 | 4.84/5.0 |
| Fernando | 2 | $32,130 | 85 | 4.96/5.0 |
| Laura | 3 | $25,203 | 213 | 4.96/5.0 |
| Sara | 1 | $22,173 | 217 | 4.89/5.0 |
| Luciano | 1 | $22,167 | 67 | 4.93/5.0 |
| Louiselle Katia | 1 | $19,726 | 110 | 4.98/5.0 |
| Sebastian | 1 | $18,956 | 8 | 4.88/5.0 |
| Elena | 2 | $18,239 | 110 | 4.96/5.0 |
Analyzing the strategies of top hosts, such as their property selection, pricing, and guest communication, can offer valuable lessons for optimizing your own Airbnb operations in Nus.
Dive Deeper: Advanced Nus STR Market Data (2025)
Ready to unlock more insights? AirROI provides access to advanced metrics and comprehensive Airbnb data for Nus. Explore detailed analytics beyond this report to refine your investment strategy, optimize pricing, and maximize your vacation rental profits.
Explore Advanced MetricsNus Short-Term Rental Market Composition (2025): Property & Room Types
Room Type Distribution
Property Type Distribution
Market Composition Insights for Nus
- The Nus Airbnb market composition is heavily skewed towards Entire Home/Apt listings, which make up 91.9% of the 37 active rentals. This indicates strong guest preference for privacy and space.
- Looking at the property type distribution in Nus, Apartment/Condo properties are the most common (67.6%), reflecting the local real estate landscape.
- Houses represent a significant 29.7% portion, catering likely to families or larger groups.
- Smaller segments like outdoor/unique (combined 2.7%) offer potential for unique stay experiences.
Nus Airbnb Room Capacity Analysis (2025): Bedroom Distribution
Distribution of Listings by Number of Bedrooms
Room Capacity Insights for Nus
- The dominant room capacity in Nus is 1 bedroom listings, making up 40.5% of the market. This suggests a strong demand for properties suitable for couples or solo travelers.
- Together, 1 bedroom and 2 bedrooms properties represent 81.0% of the active Airbnb listings in Nus, indicating a high concentration in these sizes.
- Listings with 3+ bedrooms (5.4%) represent a smaller niche, potentially indicating an underserved market for larger group accommodations in Nus.
Nus Vacation Rental Guest Capacity Trends (2025)
Distribution of Listings by Guest Capacity
Guest Capacity Insights for Nus
- The most common guest capacity trend in Nus vacation rentals is listings accommodating 4 guests (29.7%). This suggests the primary traveler segment is likely small families or groups.
- Properties designed for 4 guests and 3 guests dominate the Nus STR market, accounting for 45.9% of listings.
- 21.6% of properties accommodate 6+ guests, serving the market segment for larger families or group travel in Nus.
- On average, properties in Nus are equipped to host 4.0 guests.
Nus Airbnb Booking Patterns (2025): Available vs. Booked Days
Available Days Distribution
Booked Days Distribution
Booking Pattern Insights for Nus
- The most common availability pattern in Nus falls within the 91-180 days range, representing 35.1% of listings. This suggests many properties have significant open periods on their calendars.
- Approximately 64.8% of listings show high availability (181+ days open annually), indicating potential for increased bookings or specific owner usage patterns.
- For booked days, the 181-270 days range is most frequent in Nus (35.1%), reflecting common guest stay durations or potential owner blocking patterns.
- A notable 35.1% of properties secure long booking periods (181+ days booked per year), highlighting successful long-term rental strategies or significant owner usage.
Nus Airbnb Minimum Stay Requirements Analysis
Distribution of Listings by Minimum Night Requirement
1 Night
7 listings
19.4% of total
2 Nights
12 listings
33.3% of total
3 Nights
8 listings
22.2% of total
4-6 Nights
3 listings
8.3% of total
7-29 Nights
2 listings
5.6% of total
30+ Nights
4 listings
11.1% of total
Key Insights
- The most prevalent minimum stay requirement in Nus is 2 Nights, adopted by 33.3% of listings. This highlights the market's preference for shorter, flexible bookings.
- A significant segment (11.1%) caters to monthly stays (30+ nights) in Nus, pointing to opportunities in the extended-stay market.
Recommendations
- Align with the market by considering a 2 Nights minimum stay, as 33.3% of Nus hosts use this setting.
- If feasible, allowing 1-night stays, especially midweek or during low season, could capture last-minute bookings, as only 19.4% currently do.
- A 2-night minimum appears standard (33.3%). Consider this for weekends or peak periods.
- Explore offering discounts for stays of 30+ nights to attract the 11.1% of the market seeking extended stays.
- Adjust minimum nights based on seasonality – potentially shorter during low season and longer during peak demand periods in Nus.
Nus Airbnb Cancellation Policy Trends Analysis (2025)
Flexible
14 listings
41.2% of total
Moderate
14 listings
41.2% of total
Strict
6 listings
17.6% of total
Cancellation Policy Insights for Nus
- The prevailing Airbnb cancellation policy trend in Nus is Flexible, used by 41.2% of listings.
- The market strongly favors guest-friendly terms, with 82.4% of listings offering Flexible or Moderate policies. This suggests guests in Nus may expect booking flexibility.
Recommendations for Hosts
- Consider adopting a Flexible policy to align with the 41.2% market standard in Nus.
- Regularly review your cancellation policy against competitors and market demand shifts in Nus.
Nus STR Booking Lead Time Analysis (2025)
Average Booking Lead Time by Month
Booking Lead Time Insights for Nus
- The overall average booking lead time for vacation rentals in Nus is 60 days.
- Guests book furthest in advance for stays during August (average 127 days), likely coinciding with peak travel demand or local events.
- The shortest booking windows occur for stays in October (average 27 days), indicating more last-minute travel plans during this time.
- Seasonally, Summer (110 days avg.) sees the longest lead times, while Fall (40 days avg.) has the shortest, reflecting typical travel planning cycles.
Recommendations for Hosts
- Use the overall average lead time (60 days) as a baseline for your pricing and availability strategy in Nus.
- For August stays, consider implementing length-of-stay discounts or slightly higher rates for bookings made less than 127 days out to capitalize on advance planning.
- Target marketing efforts for the Summer season well in advance (at least 110 days) to capture early planners.
- Monitor your own booking lead times against these Nus averages to identify opportunities for dynamic pricing adjustments.
Popular & Essential Airbnb Amenities in Nus (2025)
Amenity Prevalence
Amenity Insights for Nus
- Essential amenities in Nus that guests expect include: Hot water, Essentials, Heating. Lacking these (any) could significantly impact bookings.
- Popular amenities like Kitchen, Hair dryer, Dishes and silverware are common but not universal. Offering these can provide a competitive edge.
Recommendations for Hosts
- Ensure your listing includes all essential amenities for Nus: Hot water, Essentials, Heating.
- Prioritize adding missing essentials: Hot water, Essentials, Heating.
- Consider adding popular differentiators like Kitchen or Hair dryer to increase appeal.
- Highlight unique or less common amenities you offer (e.g., hot tub, dedicated workspace, EV charger) in your listing description and photos.
- Regularly check competitor amenities in Nus to stay competitive.
Nus Airbnb Guest Demographics & Profile Analysis (2025)
Guest Profile Summary for Nus
- The typical guest profile for Airbnb in Nus consists of a mix of domestic (43%) and international guests, with top international origins including France, typically belonging to the Post-2000s (Gen Z/Alpha) group (50%), primarily speaking English or Italian.
- Domestic travelers account for 43.4% of guests.
- Key international markets include Italy (43.4%) and France (17.4%).
- Top languages spoken are English (34.9%) followed by Italian (20.3%).
- A significant demographic segment is the Post-2000s (Gen Z/Alpha) group, representing 50% of guests.
Recommendations for Hosts
- Balance marketing efforts between domestic and international channels based on the guest mix.
- Tailor amenities and listing descriptions to appeal to the dominant Post-2000s (Gen Z/Alpha) demographic (e.g., highlight fast WiFi, smart home features, local guides).
- Highlight unique local experiences or amenities relevant to the primary guest profile.
- Consider seasonal promotions aligned with peak travel times for key origin markets.
Nearby Short-Term Rental Market Comparison
How does the Nus Airbnb market stack up against its neighbors? Compare key performance metrics like average monthly revenue, ADR, and occupancy rates in surrounding areas to understand the broader regional STR landscape.
| Market | Active Properties | Monthly Revenue | Daily Rate | Avg. Occupancy |
|---|---|---|---|---|
| Lauterbrunnen | 525 | $7,079 | $546.45 | 54% |
| La Rivière-Enverse | 17 | $5,972 | $624.02 | 41% |
| Les Clefs | 30 | $5,741 | $323.11 | 44% |
| Matten bei Interlaken | 52 | $5,674 | $316.63 | 63% |
| Iseltwald | 14 | $5,491 | $331.95 | 58% |
| Habkern | 13 | $5,382 | $344.74 | 50% |
| Interlaken | 288 | $4,987 | $310.52 | 56% |
| Grindelwald | 489 | $4,921 | $345.40 | 57% |
| Zermatt | 734 | $4,604 | $463.00 | 46% |
| Oberhofen am Thunersee | 24 | $4,572 | $265.94 | 55% |