Morgex Airbnb Market Analysis 2025: Short Term Rental Data & Vacation Rental Statistics in Aosta Valley, Italy
Is Airbnb profitable in Morgex in 2025? Explore comprehensive Airbnb analytics for Morgex, Aosta Valley, Italy to uncover income potential. This 2025 STR market report for Morgex, based on AirROI data from April 2024 to March 2025, reveals key trends in the niche market of 80 active listings.
Whether you're considering an Airbnb investment in Morgex, optimizing your existing vacation rental, or exploring rental arbitrage opportunities, understanding the Morgex Airbnb data is crucial. Navigating the high regulation landscape is key to maximizing your short term rental income potential. Let's dive into the specifics.
Key Morgex Airbnb Performance Metrics Overview
Monthly Airbnb Revenue Variations & Income Potential in Morgex (2025)
Understanding the monthly revenue variations for Airbnb listings in Morgex is key to maximizing your short term rental income potential. Seasonality significantly impacts earnings. Our analysis, based on data from the past 12 months, shows that the peak revenue month for STRs in Morgex is typically August, while October often presents the lowest earnings, highlighting opportunities for strategic pricing adjustments during shoulder and low seasons. Explore the typical Airbnb income in Morgex across different performance tiers:
- Best-in-class properties (Top 10%) achieve $3,080+ monthly, often utilizing dynamic pricing and superior guest experiences.
- Strong performing properties (Top 25%) earn $2,092 or more, indicating effective management and desirable locations/amenities.
- Typical properties (Median) generate around $1,230 per month, representing the average market performance.
- Entry-level properties (Bottom 25%) see earnings around $696, often with potential for optimization.
Average Monthly Airbnb Earnings Trend in Morgex
Morgex Airbnb Occupancy Rate Trends (2025)
Maximize your bookings by understanding the Morgex STR occupancy trends. Seasonal demand shifts significantly influence how often properties are booked. Typically, Augustsees the highest demand (peak season occupancy), while October experiences the lowest (low season). Effective strategies, like adjusting minimum stays or offering promotions, can boost occupancy during slower periods. Here's how different property tiers perform in Morgex:
- Best-in-class properties (Top 10%) achieve 69%+ occupancy, indicating high desirability and potentially optimized availability.
- Strong performing properties (Top 25%) maintain 51% or higher occupancy, suggesting good market fit and guest satisfaction.
- Typical properties (Median) have an occupancy rate around 31%.
- Entry-level properties (Bottom 25%) average 14% occupancy, potentially facing higher vacancy.
Average Monthly Occupancy Rate Trend in Morgex
Average Daily Rate (ADR) Airbnb Trends in Morgex (2025)
Effective short term rental pricing strategy in Morgex involves understanding monthly ADR fluctuations. The Average Daily Rate (ADR) for Airbnb in Morgex typically peaks in December and dips lowest during October. Leveraging Airbnb dynamic pricing tools or strategies based on this seasonality can significantly boost revenue. Here's a look at the typical nightly rates achieved:
- Best-in-class properties (Top 10%) command rates of $271+ per night, often due to premium features or locations.
- Strong performing properties (Top 25%) achieve nightly rates of $172 or more.
- Typical properties (Median) charge around $124 per night.
- Entry-level properties (Bottom 25%) earn around $95 per night.
Average Daily Rate (ADR) Trend by Month in Morgex
Get Live Morgex Market Intelligence 👇

Explore Real-time Analytics
Airbnb Seasonality Analysis & Trends in Morgex (2025)
Peak Season (August, July, February)
- Revenue averages $2,174 per month
- Occupancy rates average 51.8%
- Daily rates average $153
Shoulder Season
- Revenue averages $1,461 per month
- Occupancy maintains around 30.9%
- Daily rates hold near $155
Low Season (September, October, November)
- Revenue drops to average $981 per month
- Occupancy decreases to average 27.2%
- Daily rates adjust to average $137
Seasonality Insights for Morgex
- The Airbnb seasonality in Morgex shows highly seasonal trends requiring careful strategy. While the sections above show seasonal averages, it's also insightful to look at the extremes:
- During the high season, the absolute peak month showcases Morgex's highest earning potential, with monthly revenues capable of climbing to $2,661, occupancy reaching a high of 61.3%, and ADRs peaking at $180.
- Conversely, the slowest single month of the year, typically falling within the low season, marks the market's lowest point. In this month, revenue might dip to $851, occupancy could drop to 23.0%, and ADRs may adjust down to $131.
- Understanding both the seasonal averages and these monthly peaks and troughs in revenue, occupancy, and ADR is crucial for maximizing your Airbnb profit potential in Morgex.
Seasonal Strategies for Maximizing Profit
- Peak Season: Maximize revenue through premium pricing and potentially longer minimum stays. Ensure high availability.
- Low Season: Offer competitive pricing, special promotions (e.g., extended stay discounts), and flexible cancellation policies. Target off-season travelers like remote workers or budget-conscious guests.
- Shoulder Seasons: Implement dynamic pricing that balances peak and low rates. Target weekend travelers or specific events. Offer slightly more flexible terms than peak season.
- Regularly analyze your own performance against these Morgex seasonality benchmarks and adjust your pricing and availability strategy accordingly.
Best Areas for Airbnb Investment in Morgex (2025)
Exploring the top neighborhoods for short-term rentals in Morgex? This section highlights key areas, outlining why they are attractive for hosts and guests, along with notable local attractions. Consider these locations based on your target guest profile and investment strategy.
| Neighborhood / Area | Why Host Here? (Target Guests & Appeal) | Key Attractions & Landmarks |
|---|---|---|
| Morgex Center | Central area of Morgex known for its charming streets and access to local shops and restaurants. This location is popular among visitors for its convenience and proximity to various attractions in the Aosta Valley. | Chiesa Parrocchiale di Morgex, Parco Avventura Saint-Bernard, Local restaurants and cafés |
| La Salle | A picturesque village located nearby, La Salle offers stunning views and access to nature. It’s a great spot for outdoor enthusiasts and those looking to escape into the mountains. | Castello di La Salle, Lago di La Salle, Hiking trails, Local wineries |
| Courmayeur | A famous mountain resort town known for its skiing and alpine activities. Courmayeur attracts a lot of tourists year-round, making it a prime location for Airbnb hosting. | Mont Blanc, Skyway Monte Bianco, Courmayeur ski slopes, La Vallée Blanche, Hiking trails |
| Pré-Saint-Didier | Known for its thermal baths and spa experiences, Pré-Saint-Didier is a relaxing destination for travelers looking to unwind. It attracts visitors all year, especially during the ski season. | Thermes de Pré-Saint-Didier, Mont Blanc views, Skiing opportunities |
| Entreves | A quaint area in Courmayeur known for its scenic beauty and charm. It's an ideal spot for visitors who appreciate close proximity to nature and breathtaking mountain scenery. | Chalet de la Fis, Close access to ski lifts, Local shops |
| La Thuile | Another popular ski resort located near Morgex, La Thuile offers skiing, snowboarding, and beautiful mountain landscapes, appealing to winter sports enthusiasts. | La Thuile ski area, Les Suches ski lift, Scenic mountain views |
| Val Ferret | A stunning valley that attracts hikers and nature lovers. It's perfect for those who want quiet and beautiful surroundings, and it offers various outdoor activities. | Val Ferret hiking trails, Natural landscapes, Wildflowers and wildlife |
| Saint Pierre | A small but charming village that provides a more authentic local experience. Visitors can enjoy the peaceful atmosphere and visit historical sites. | Château de Saint Pierre, Local festivals and events, Scenic views of the surrounding mountains |
Understanding Airbnb License Requirements & STR Laws in Morgex (2025)
Yes, Morgex, Aosta Valley, Italy enforces high STR regulations. Obtaining a license and ensuring compliance is almost certainly required according to current 2025 STR laws. Always verify the latest short term rental regulations and Airbnb license requirements directly with local government authorities for Morgex to ensure full compliance before hosting.
(Source: AirROI data, 2025, based on 66% licensed listings)
Top Performing Airbnb Properties in Morgex (2025)
Benchmark your potential! Explore examples of top-performing Airbnb properties in Morgexbased on Trailing Twelve Month (TTM) revenue. Analyze their characteristics, revenue, occupancy rate, and ADR to understand what drives success in this market.
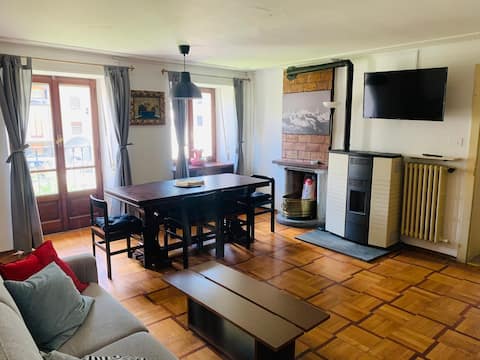
Dependance 1816
Entire Place • 3 bedrooms
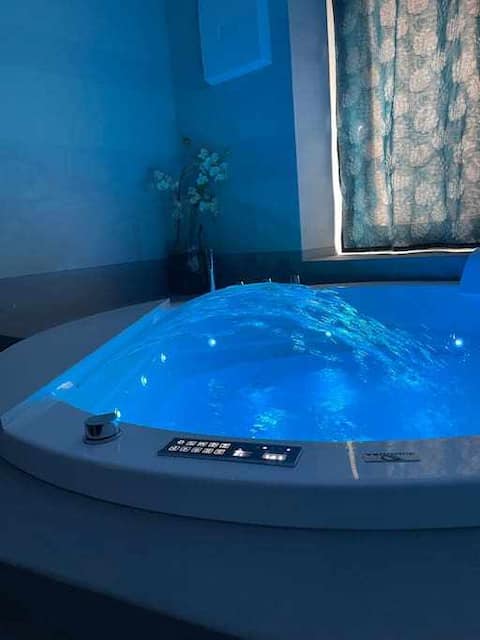
La Goille Morgex
Entire Place • 1 bedroom
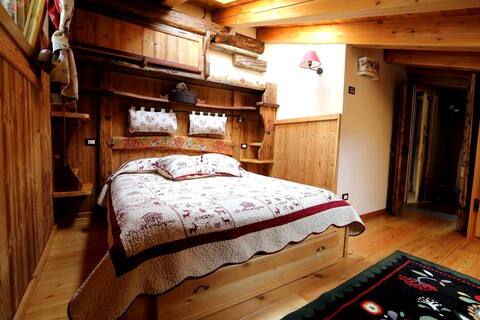
Cozy apartment in alpine style
Entire Place • 1 bedroom
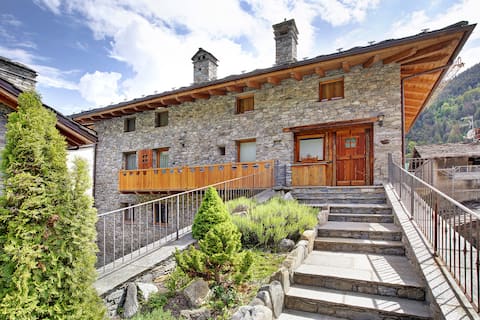
The Heart of Valdigne
Entire Place • 2 bedrooms
Antica Renovated Cabin (only for 2)
Entire Place • 1 bedroom
Maison Luise
Entire Place • 2 bedrooms
Note: Performance varies based on location, size, amenities, seasonality, and management quality. Data reflects the past 12 months.
Top Performing Airbnb Hosts in Morgex (2025)
Learn from the best! This table showcases top-performing Airbnb hosts in Morgex based on the number of properties managed and estimated total revenue over the past year. Analyze their scale and performance metrics.
| Host Name | Properties | Grossing Revenue | Stay Reviews | Avg Rating |
|---|---|---|---|---|
| Chantal | 3 | $66,441 | 479 | 4.88/5.0 |
| Espoirelasalle | 5 | $60,968 | 9 | 1.85/5.0 |
| Sara | 2 | $50,279 | 111 | 4.89/5.0 |
| Yuri | 3 | $48,807 | 152 | 4.83/5.0 |
| Jean Francois | 1 | $42,489 | 6 | 5.00/5.0 |
| Roberto & Gabriella | 3 | $35,072 | 541 | 4.85/5.0 |
| Holidu | 1 | $28,979 | 12 | 4.58/5.0 |
| Emiliana | 1 | $27,751 | 137 | 5.00/5.0 |
| Nicolò | 1 | $27,686 | 62 | 4.73/5.0 |
| Martino | 1 | $25,952 | 13 | 5.00/5.0 |
Analyzing the strategies of top hosts, such as their property selection, pricing, and guest communication, can offer valuable lessons for optimizing your own Airbnb operations in Morgex.
Dive Deeper: Advanced Morgex STR Market Data (2025)
Ready to unlock more insights? AirROI provides access to advanced metrics and comprehensive Airbnb data for Morgex. Explore detailed analytics beyond this report to refine your investment strategy, optimize pricing, and maximize your vacation rental profits.
Explore Advanced MetricsMorgex Short-Term Rental Market Composition (2025): Property & Room Types
Room Type Distribution
Property Type Distribution
Market Composition Insights for Morgex
- The Morgex Airbnb market composition is heavily skewed towards Entire Home/Apt listings, which make up 96.3% of the 80 active rentals. This indicates strong guest preference for privacy and space.
- Looking at the property type distribution in Morgex, Apartment/Condo properties are the most common (85%), reflecting the local real estate landscape.
- Smaller segments like hotel/boutique, others (combined 2.6%) offer potential for unique stay experiences.
Morgex Airbnb Room Capacity Analysis (2025): Bedroom Distribution
Distribution of Listings by Number of Bedrooms
Room Capacity Insights for Morgex
- The dominant room capacity in Morgex is 1 bedroom listings, making up 47.5% of the market. This suggests a strong demand for properties suitable for couples or solo travelers.
- Together, 1 bedroom and 2 bedrooms properties represent 85.0% of the active Airbnb listings in Morgex, indicating a high concentration in these sizes.
- Listings with 3+ bedrooms (7.5%) represent a smaller niche, potentially indicating an underserved market for larger group accommodations in Morgex.
Morgex Vacation Rental Guest Capacity Trends (2025)
Distribution of Listings by Guest Capacity
Guest Capacity Insights for Morgex
- The most common guest capacity trend in Morgex vacation rentals is listings accommodating 4 guests (41.3%). This suggests the primary traveler segment is likely small families or groups.
- Properties designed for 4 guests and 2 guests dominate the Morgex STR market, accounting for 60.1% of listings.
- 20.1% of properties accommodate 6+ guests, serving the market segment for larger families or group travel in Morgex.
- On average, properties in Morgex are equipped to host 4.1 guests.
Morgex Airbnb Booking Patterns (2025): Available vs. Booked Days
Available Days Distribution
Booked Days Distribution
Booking Pattern Insights for Morgex
- The most common availability pattern in Morgex falls within the 271-366 days range, representing 58.8% of listings. This suggests many properties have significant open periods on their calendars.
- Approximately 87.5% of listings show high availability (181+ days open annually), indicating potential for increased bookings or specific owner usage patterns.
- For booked days, the 31-90 days range is most frequent in Morgex (41.3%), reflecting common guest stay durations or potential owner blocking patterns.
- A notable 13.8% of properties secure long booking periods (181+ days booked per year), highlighting successful long-term rental strategies or significant owner usage.
Morgex Airbnb Minimum Stay Requirements Analysis
Distribution of Listings by Minimum Night Requirement
1 Night
12 listings
16.2% of total
2 Nights
21 listings
28.4% of total
3 Nights
5 listings
6.8% of total
4-6 Nights
11 listings
14.9% of total
7-29 Nights
2 listings
2.7% of total
30+ Nights
23 listings
31.1% of total
Key Insights
- The most prevalent minimum stay requirement in Morgex is 30+ Nights, adopted by 31.1% of listings. This highlights the market's preference for longer commitments.
- A significant segment (31.1%) caters to monthly stays (30+ nights) in Morgex, pointing to opportunities in the extended-stay market.
Recommendations
- Align with the market by considering a 30+ Nights minimum stay, as 31.1% of Morgex hosts use this setting.
- If feasible, allowing 1-night stays, especially midweek or during low season, could capture last-minute bookings, as only 16.2% currently do.
- Explore offering discounts for stays of 30+ nights to attract the 31.1% of the market seeking extended stays.
- Adjust minimum nights based on seasonality – potentially shorter during low season and longer during peak demand periods in Morgex.
Morgex Airbnb Cancellation Policy Trends Analysis (2025)
Super Strict 60 Days
1 listings
1.5% of total
Flexible
16 listings
24.6% of total
Moderate
28 listings
43.1% of total
Strict
20 listings
30.8% of total
Cancellation Policy Insights for Morgex
- The prevailing Airbnb cancellation policy trend in Morgex is Moderate, used by 43.1% of listings.
- There's a relatively balanced mix between guest-friendly (67.7%) and stricter (30.8%) policies, offering choices for different guest needs.
Recommendations for Hosts
- Consider adopting a Moderate policy to align with the 43.1% market standard in Morgex.
- With 30.8% using Strict terms, this is a viable option in Morgex, particularly for high-value properties or during peak demand periods.
- Regularly review your cancellation policy against competitors and market demand shifts in Morgex.
Morgex STR Booking Lead Time Analysis (2025)
Average Booking Lead Time by Month
Booking Lead Time Insights for Morgex
- The overall average booking lead time for vacation rentals in Morgex is 48 days.
- Guests book furthest in advance for stays during July (average 79 days), likely coinciding with peak travel demand or local events.
- The shortest booking windows occur for stays in November (average 32 days), indicating more last-minute travel plans during this time.
- Seasonally, Summer (76 days avg.) sees the longest lead times, while Fall (36 days avg.) has the shortest, reflecting typical travel planning cycles.
Recommendations for Hosts
- Use the overall average lead time (48 days) as a baseline for your pricing and availability strategy in Morgex.
- For July stays, consider implementing length-of-stay discounts or slightly higher rates for bookings made less than 79 days out to capitalize on advance planning.
- Target marketing efforts for the Summer season well in advance (at least 76 days) to capture early planners.
- Monitor your own booking lead times against these Morgex averages to identify opportunities for dynamic pricing adjustments.
Popular & Essential Airbnb Amenities in Morgex (2025)
Amenity Prevalence
Amenity Insights for Morgex
- Essential amenities in Morgex that guests expect include: Heating, Kitchen. Lacking these (any) could significantly impact bookings.
- Popular amenities like TV, Hot water, Essentials are common but not universal. Offering these can provide a competitive edge.
Recommendations for Hosts
- Ensure your listing includes all essential amenities for Morgex: Heating, Kitchen.
- Prioritize adding missing essentials: Heating, Kitchen.
- Consider adding popular differentiators like TV or Hot water to increase appeal.
- Highlight unique or less common amenities you offer (e.g., hot tub, dedicated workspace, EV charger) in your listing description and photos.
- Regularly check competitor amenities in Morgex to stay competitive.
Morgex Airbnb Guest Demographics & Profile Analysis (2025)
Guest Profile Summary for Morgex
- The typical guest profile for Airbnb in Morgex consists of primarily domestic travelers (70%), often arriving from nearby Milan, typically belonging to the Post-2000s (Gen Z/Alpha) group (50%), primarily speaking English or Italian.
- Domestic travelers account for 69.6% of guests.
- Key international markets include Italy (69.6%) and France (11.8%).
- Top languages spoken are English (38.2%) followed by Italian (31.2%).
- A significant demographic segment is the Post-2000s (Gen Z/Alpha) group, representing 50% of guests.
Recommendations for Hosts
- Target domestic marketing efforts towards travelers from Milan and Turin.
- Tailor amenities and listing descriptions to appeal to the dominant Post-2000s (Gen Z/Alpha) demographic (e.g., highlight fast WiFi, smart home features, local guides).
- Highlight unique local experiences or amenities relevant to the primary guest profile.
- Consider seasonal promotions aligned with peak travel times for key origin markets.
Nearby Short-Term Rental Market Comparison
How does the Morgex Airbnb market stack up against its neighbors? Compare key performance metrics like average monthly revenue, ADR, and occupancy rates in surrounding areas to understand the broader regional STR landscape.
| Market | Active Properties | Monthly Revenue | Daily Rate | Avg. Occupancy |
|---|---|---|---|---|
| Lauterbrunnen | 525 | $7,079 | $546.45 | 54% |
| La Rivière-Enverse | 17 | $5,972 | $624.02 | 41% |
| Les Clefs | 30 | $5,741 | $323.11 | 44% |
| Matten bei Interlaken | 52 | $5,674 | $316.63 | 63% |
| Iseltwald | 14 | $5,491 | $331.95 | 58% |
| Habkern | 13 | $5,382 | $344.74 | 50% |
| Interlaken | 288 | $4,987 | $310.52 | 56% |
| Grindelwald | 489 | $4,921 | $345.40 | 57% |
| Zermatt | 734 | $4,604 | $463.00 | 46% |
| Oberhofen am Thunersee | 24 | $4,572 | $265.94 | 55% |