Courmayeur Airbnb Market Analysis 2025: Short Term Rental Data & Vacation Rental Statistics in Aosta Valley, Italy
Is Airbnb profitable in Courmayeur in 2025? Explore comprehensive Airbnb analytics for Courmayeur, Aosta Valley, Italy to uncover income potential. This 2025 STR market report for Courmayeur, based on AirROI data from April 2024 to March 2025, reveals key trends in the market of 223 active listings.
Whether you're considering an Airbnb investment in Courmayeur, optimizing your existing vacation rental, or exploring rental arbitrage opportunities, understanding the Courmayeur Airbnb data is crucial. Navigating the high regulation landscape is key to maximizing your short term rental income potential. Let's dive into the specifics.
Key Courmayeur Airbnb Performance Metrics Overview
Monthly Airbnb Revenue Variations & Income Potential in Courmayeur (2025)
Understanding the monthly revenue variations for Airbnb listings in Courmayeur is key to maximizing your short term rental income potential. Seasonality significantly impacts earnings. Our analysis, based on data from the past 12 months, shows that the peak revenue month for STRs in Courmayeur is typically February, while October often presents the lowest earnings, highlighting opportunities for strategic pricing adjustments during shoulder and low seasons. Explore the typical Airbnb income in Courmayeur across different performance tiers:
- Best-in-class properties (Top 10%) achieve $5,873+ monthly, often utilizing dynamic pricing and superior guest experiences.
- Strong performing properties (Top 25%) earn $3,541 or more, indicating effective management and desirable locations/amenities.
- Typical properties (Median) generate around $1,985 per month, representing the average market performance.
- Entry-level properties (Bottom 25%) see earnings around $1,060, often with potential for optimization.
Average Monthly Airbnb Earnings Trend in Courmayeur
Courmayeur Airbnb Occupancy Rate Trends (2025)
Maximize your bookings by understanding the Courmayeur STR occupancy trends. Seasonal demand shifts significantly influence how often properties are booked. Typically, Augustsees the highest demand (peak season occupancy), while October experiences the lowest (low season). Effective strategies, like adjusting minimum stays or offering promotions, can boost occupancy during slower periods. Here's how different property tiers perform in Courmayeur:
- Best-in-class properties (Top 10%) achieve 64%+ occupancy, indicating high desirability and potentially optimized availability.
- Strong performing properties (Top 25%) maintain 47% or higher occupancy, suggesting good market fit and guest satisfaction.
- Typical properties (Median) have an occupancy rate around 30%.
- Entry-level properties (Bottom 25%) average 14% occupancy, potentially facing higher vacancy.
Average Monthly Occupancy Rate Trend in Courmayeur
Average Daily Rate (ADR) Airbnb Trends in Courmayeur (2025)
Effective short term rental pricing strategy in Courmayeur involves understanding monthly ADR fluctuations. The Average Daily Rate (ADR) for Airbnb in Courmayeur typically peaks in February and dips lowest during October. Leveraging Airbnb dynamic pricing tools or strategies based on this seasonality can significantly boost revenue. Here's a look at the typical nightly rates achieved:
- Best-in-class properties (Top 10%) command rates of $433+ per night, often due to premium features or locations.
- Strong performing properties (Top 25%) achieve nightly rates of $300 or more.
- Typical properties (Median) charge around $204 per night.
- Entry-level properties (Bottom 25%) earn around $145 per night.
Average Daily Rate (ADR) Trend by Month in Courmayeur
Get Live Courmayeur Market Intelligence 👇

Explore Real-time Analytics
Airbnb Seasonality Analysis & Trends in Courmayeur (2025)
Peak Season (February, August, January)
- Revenue averages $3,955 per month
- Occupancy rates average 47.3%
- Daily rates average $277
Shoulder Season
- Revenue averages $2,698 per month
- Occupancy maintains around 30.5%
- Daily rates hold near $253
Low Season (May, September, October)
- Revenue drops to average $1,674 per month
- Occupancy decreases to average 24.4%
- Daily rates adjust to average $236
Seasonality Insights for Courmayeur
- The Airbnb seasonality in Courmayeur shows highly seasonal trends requiring careful strategy. While the sections above show seasonal averages, it's also insightful to look at the extremes:
- During the high season, the absolute peak month showcases Courmayeur's highest earning potential, with monthly revenues capable of climbing to $4,496, occupancy reaching a high of 54.8%, and ADRs peaking at $293.
- Conversely, the slowest single month of the year, typically falling within the low season, marks the market's lowest point. In this month, revenue might dip to $1,335, occupancy could drop to 21.1%, and ADRs may adjust down to $234.
- Understanding both the seasonal averages and these monthly peaks and troughs in revenue, occupancy, and ADR is crucial for maximizing your Airbnb profit potential in Courmayeur.
Seasonal Strategies for Maximizing Profit
- Peak Season: Maximize revenue through premium pricing and potentially longer minimum stays. Ensure high availability.
- Low Season: Offer competitive pricing, special promotions (e.g., extended stay discounts), and flexible cancellation policies. Target off-season travelers like remote workers or budget-conscious guests.
- Shoulder Seasons: Implement dynamic pricing that balances peak and low rates. Target weekend travelers or specific events. Offer slightly more flexible terms than peak season.
- Regularly analyze your own performance against these Courmayeur seasonality benchmarks and adjust your pricing and availability strategy accordingly.
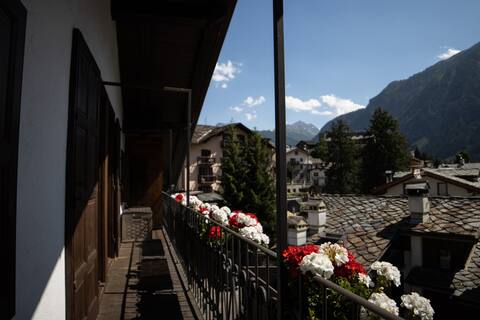
Best Areas for Airbnb Investment in Courmayeur (2025)
Exploring the top neighborhoods for short-term rentals in Courmayeur? This section highlights key areas, outlining why they are attractive for hosts and guests, along with notable local attractions. Consider these locations based on your target guest profile and investment strategy.
| Neighborhood / Area | Why Host Here? (Target Guests & Appeal) | Key Attractions & Landmarks |
|---|---|---|
| Courmayeur Center | The heart of Courmayeur, known for its charming streets, shops, and restaurants. It's a prime location for tourists seeking easy access to skiing, dining, and nightlife. | Mont Blanc, Skyway Monte Bianco, Courmayeur Cable Car, Thermes de Pre Saint Didier, Val Veny, Hiking trails |
| Val Ferret | A stunning valley offering breathtaking views and great hiking paths. Ideal for nature lovers and those seeking tranquility away from the busy center. | Val Ferret hiking trails, Monts de la Frasse, Mer de Glace, Skyway Monte Bianco, Ponte di San Marco |
| La Palud | A picturesque village near Courmayeur that provides a quieter atmosphere and direct access to skiing and the mountains. | Cable car to Punta Helbronner, Alpine restaurants, Natural scenery, Ski slopes access |
| Dolonne | A charming village close to Courmayeur with a cozy atmosphere and easy access to ski lifts and the main town. | Dolonne ski lift, Historical architecture, Local restaurants, Skiing access |
| Arpy Lake | A beautiful natural lake surrounded by lush forests, perfect for outdoor enthusiasts and those looking for a tranquil getaway. | Hiking trails, Biking paths, Scenic views, Picnic areas |
| Pre Saint Didier | Known for its thermal baths and spa facilities, this area attracts visitors looking to relax and rejuvenate after outdoor activities. | Thermes de Pré Saint Didier, Spa resorts, Mountain views, Hiking routes |
| Val d'Aosta | A broader region surrounding Courmayeur with a variety of outdoor activities and cultural sites, appealing to travelers exploring the region. | Castles of Aosta, Wine tasting, Alpine skiing, Historic sites |
| Ponteille | A unique spot providing access to lesser-known trails and a more secluded experience for those wishing to explore the nature of the Aosta Valley. | Hidden hiking trails, Stunning landscapes, Wildlife watching |
Understanding Airbnb License Requirements & STR Laws in Courmayeur (2025)
Yes, Courmayeur, Aosta Valley, Italy enforces high STR regulations. Obtaining a license and ensuring compliance is almost certainly required according to current 2025 STR laws. Always verify the latest short term rental regulations and Airbnb license requirements directly with local government authorities for Courmayeur to ensure full compliance before hosting.
(Source: AirROI data, 2025, based on 62% licensed listings)
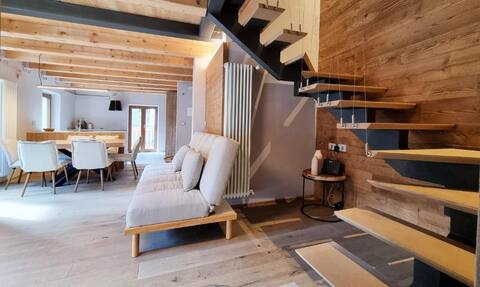
Top Performing Airbnb Properties in Courmayeur (2025)
Benchmark your potential! Explore examples of top-performing Airbnb properties in Courmayeurbased on Trailing Twelve Month (TTM) revenue. Analyze their characteristics, revenue, occupancy rate, and ADR to understand what drives success in this market.
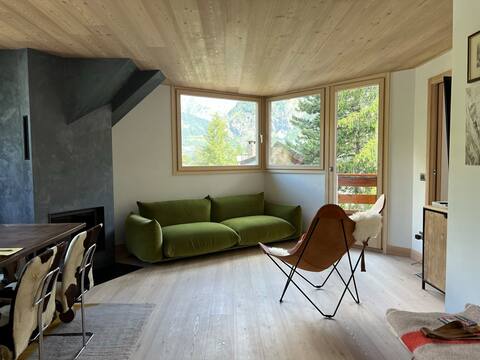
Gem aptwith Views to the Alps
Entire Place • 3 bedrooms
Chalet Fior di Roccia, Val Veny, Courmayeur
Entire Place • 3 bedrooms
Alpine Chic Retreat
Entire Place • 3 bedrooms

LUVI - Courmayeur
Entire Place • 2 bedrooms
The white spot
Entire Place • 4 bedrooms

Large top location accommodation Viale Monte Bianco
Entire Place • 3 bedrooms
Note: Performance varies based on location, size, amenities, seasonality, and management quality. Data reflects the past 12 months.
Top Performing Airbnb Hosts in Courmayeur (2025)
Learn from the best! This table showcases top-performing Airbnb hosts in Courmayeur based on the number of properties managed and estimated total revenue over the past year. Analyze their scale and performance metrics.
| Host Name | Properties | Grossing Revenue | Stay Reviews | Avg Rating |
|---|---|---|---|---|
| Valentina | 18 | $365,176 | 123 | 3.32/5.0 |
| Alpine Chic Retreat | 2 | $165,741 | 20 | 4.62/5.0 |
| Rinat | 1 | $147,662 | 11 | 4.82/5.0 |
| Luvi Customers | 2 | $123,442 | 33 | 4.82/5.0 |
| Micol | 4 | $112,123 | 132 | 4.83/5.0 |
| Luca Francesco Luigi | 2 | $110,483 | 195 | 4.96/5.0 |
| Stefano | 5 | $109,128 | 29 | 2.76/5.0 |
| Martina | 1 | $107,548 | 20 | 5.00/5.0 |
| Francesca | 3 | $96,300 | 83 | 4.82/5.0 |
| Pietro | 1 | $93,147 | 13 | 4.92/5.0 |
Analyzing the strategies of top hosts, such as their property selection, pricing, and guest communication, can offer valuable lessons for optimizing your own Airbnb operations in Courmayeur.
Dive Deeper: Advanced Courmayeur STR Market Data (2025)
Ready to unlock more insights? AirROI provides access to advanced metrics and comprehensive Airbnb data for Courmayeur. Explore detailed analytics beyond this report to refine your investment strategy, optimize pricing, and maximize your vacation rental profits.
Explore Advanced MetricsCourmayeur Short-Term Rental Market Composition (2025): Property & Room Types
Room Type Distribution
Property Type Distribution
Market Composition Insights for Courmayeur
- The Courmayeur Airbnb market composition is heavily skewed towards Entire Home/Apt listings, which make up 99.1% of the 223 active rentals. This indicates strong guest preference for privacy and space.
- Looking at the property type distribution in Courmayeur, Apartment/Condo properties are the most common (80.7%), reflecting the local real estate landscape.
- Smaller segments like outdoor/unique, hotel/boutique (combined 5.4%) offer potential for unique stay experiences.
Courmayeur Airbnb Room Capacity Analysis (2025): Bedroom Distribution
Distribution of Listings by Number of Bedrooms
Room Capacity Insights for Courmayeur
- The dominant room capacity in Courmayeur is 2 bedrooms listings, making up 39.9% of the market. This suggests a strong demand for properties suitable for couples or solo travelers.
- Together, 2 bedrooms and 1 bedroom properties represent 70.4% of the active Airbnb listings in Courmayeur, indicating a high concentration in these sizes.
- A significant 26.4% of listings offer 3+ bedrooms, catering to larger groups and families seeking more space in Courmayeur.
Courmayeur Vacation Rental Guest Capacity Trends (2025)
Distribution of Listings by Guest Capacity
Guest Capacity Insights for Courmayeur
- The most common guest capacity trend in Courmayeur vacation rentals is listings accommodating 4 guests (35.4%). This suggests the primary traveler segment is likely small families or groups.
- Properties designed for 4 guests and 6 guests dominate the Courmayeur STR market, accounting for 53.3% of listings.
- 31.8% of properties accommodate 6+ guests, serving the market segment for larger families or group travel in Courmayeur.
- On average, properties in Courmayeur are equipped to host 4.7 guests.
Courmayeur Airbnb Booking Patterns (2025): Available vs. Booked Days
Available Days Distribution
Booked Days Distribution
Booking Pattern Insights for Courmayeur
- The most common availability pattern in Courmayeur falls within the 271-366 days range, representing 63.2% of listings. This suggests many properties have significant open periods on their calendars.
- Approximately 89.7% of listings show high availability (181+ days open annually), indicating potential for increased bookings or specific owner usage patterns.
- For booked days, the 31-90 days range is most frequent in Courmayeur (37.2%), reflecting common guest stay durations or potential owner blocking patterns.
- A notable 10.3% of properties secure long booking periods (181+ days booked per year), highlighting successful long-term rental strategies or significant owner usage.
Courmayeur Airbnb Minimum Stay Requirements Analysis
Distribution of Listings by Minimum Night Requirement
1 Night
17 listings
8.5% of total
2 Nights
36 listings
18% of total
3 Nights
28 listings
14% of total
4-6 Nights
52 listings
26% of total
7-29 Nights
19 listings
9.5% of total
30+ Nights
48 listings
24% of total
Key Insights
- The most prevalent minimum stay requirement in Courmayeur is 4-6 Nights, adopted by 26% of listings. This highlights the market's preference for longer commitments.
- A significant segment (24%) caters to monthly stays (30+ nights) in Courmayeur, pointing to opportunities in the extended-stay market.
Recommendations
- Align with the market by considering a 4-6 Nights minimum stay, as 26% of Courmayeur hosts use this setting.
- If feasible, allowing 1-night stays, especially midweek or during low season, could capture last-minute bookings, as only 8.5% currently do.
- Explore offering discounts for stays of 30+ nights to attract the 24% of the market seeking extended stays.
- Adjust minimum nights based on seasonality – potentially shorter during low season and longer during peak demand periods in Courmayeur.
Courmayeur Airbnb Cancellation Policy Trends Analysis (2025)
Super Strict 60 Days
3 listings
1.5% of total
Super Strict 30 Days
1 listings
0.5% of total
Flexible
31 listings
15.9% of total
Moderate
75 listings
38.5% of total
Strict
85 listings
43.6% of total
Cancellation Policy Insights for Courmayeur
- The prevailing Airbnb cancellation policy trend in Courmayeur is Strict, used by 43.6% of listings.
- There's a relatively balanced mix between guest-friendly (54.4%) and stricter (43.6%) policies, offering choices for different guest needs.
Recommendations for Hosts
- Consider adopting a Strict policy to align with the 43.6% market standard in Courmayeur.
- With 43.6% using Strict terms, this is a viable option in Courmayeur, particularly for high-value properties or during peak demand periods.
- Regularly review your cancellation policy against competitors and market demand shifts in Courmayeur.
Courmayeur STR Booking Lead Time Analysis (2025)
Average Booking Lead Time by Month
Booking Lead Time Insights for Courmayeur
- The overall average booking lead time for vacation rentals in Courmayeur is 73 days.
- Guests book furthest in advance for stays during July (average 101 days), likely coinciding with peak travel demand or local events.
- The shortest booking windows occur for stays in November (average 35 days), indicating more last-minute travel plans during this time.
- Seasonally, Summer (92 days avg.) sees the longest lead times, while Fall (52 days avg.) has the shortest, reflecting typical travel planning cycles.
Recommendations for Hosts
- Use the overall average lead time (73 days) as a baseline for your pricing and availability strategy in Courmayeur.
- For July stays, consider implementing length-of-stay discounts or slightly higher rates for bookings made less than 101 days out to capitalize on advance planning.
- Target marketing efforts for the Summer season well in advance (at least 92 days) to capture early planners.
- Monitor your own booking lead times against these Courmayeur averages to identify opportunities for dynamic pricing adjustments.
Popular & Essential Airbnb Amenities in Courmayeur (2025)
Amenity Prevalence
Amenity Insights for Courmayeur
- Essential amenities in Courmayeur that guests expect include: Kitchen, TV, Heating. Lacking these (any) could significantly impact bookings.
- Popular amenities like Hot water, Essentials, Hair dryer are common but not universal. Offering these can provide a competitive edge.
Recommendations for Hosts
- Ensure your listing includes all essential amenities for Courmayeur: Kitchen, TV, Heating.
- Prioritize adding missing essentials: Kitchen, TV, Heating.
- Consider adding popular differentiators like Hot water or Essentials to increase appeal.
- Highlight unique or less common amenities you offer (e.g., hot tub, dedicated workspace, EV charger) in your listing description and photos.
- Regularly check competitor amenities in Courmayeur to stay competitive.
Courmayeur Airbnb Guest Demographics & Profile Analysis (2025)
Guest Profile Summary for Courmayeur
- The typical guest profile for Airbnb in Courmayeur consists of predominantly international visitors (68%), with top international origins including United States, typically belonging to the Post-2000s (Gen Z/Alpha) group (50%), primarily speaking English or Italian.
- Domestic travelers account for 31.9% of guests.
- Key international markets include Italy (31.9%) and United States (14.3%).
- Top languages spoken are English (39.1%) followed by Italian (20.3%).
- A significant demographic segment is the Post-2000s (Gen Z/Alpha) group, representing 50% of guests.
Recommendations for Hosts
- Focus marketing internationally, particularly towards travelers from United States.
- Tailor amenities and listing descriptions to appeal to the dominant Post-2000s (Gen Z/Alpha) demographic (e.g., highlight fast WiFi, smart home features, local guides).
- Highlight unique local experiences or amenities relevant to the primary guest profile.
- Consider seasonal promotions aligned with peak travel times for key origin markets.
Nearby Short-Term Rental Market Comparison
How does the Courmayeur Airbnb market stack up against its neighbors? Compare key performance metrics like average monthly revenue, ADR, and occupancy rates in surrounding areas to understand the broader regional STR landscape.
| Market | Active Properties | Monthly Revenue | Daily Rate | Avg. Occupancy |
|---|---|---|---|---|
| Lauterbrunnen | 525 | $7,079 | $546.45 | 54% |
| La Rivière-Enverse | 17 | $5,972 | $624.02 | 41% |
| Les Clefs | 30 | $5,741 | $323.11 | 44% |
| Matten bei Interlaken | 52 | $5,674 | $316.63 | 63% |
| Iseltwald | 14 | $5,491 | $331.95 | 58% |
| Habkern | 13 | $5,382 | $344.74 | 50% |
| Interlaken | 288 | $4,987 | $310.52 | 56% |
| Zermatt | 734 | $4,604 | $463.00 | 46% |
| Oberhofen am Thunersee | 24 | $4,572 | $265.94 | 55% |
| Monteu Roero | 16 | $4,432 | $540.14 | 36% |