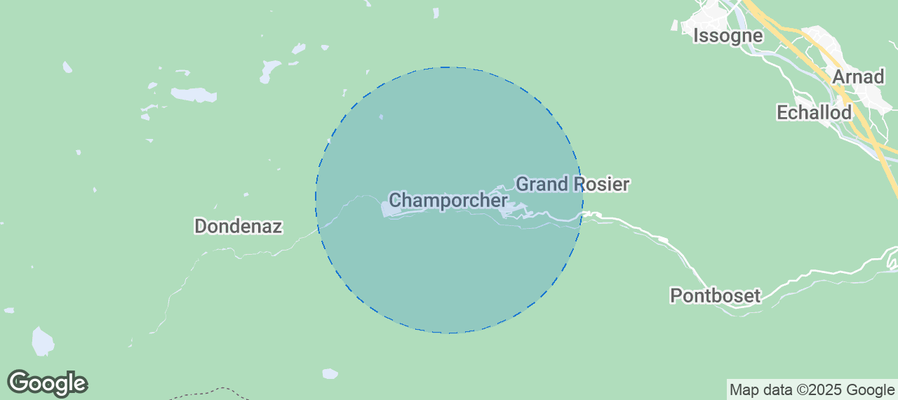
Champorcher Airbnb Market Analysis 2025: Short Term Rental Data & Vacation Rental Statistics in Aosta Valley, Italy
Is Airbnb profitable in Champorcher in 2025? Explore comprehensive Airbnb analytics for Champorcher, Aosta Valley, Italy to uncover income potential. This 2025 STR market report for Champorcher, based on AirROI data from April 2024 to March 2025, reveals key trends in the niche market of 25 active listings.
Whether you're considering an Airbnb investment in Champorcher, optimizing your existing vacation rental, or exploring rental arbitrage opportunities, understanding the Champorcher Airbnb data is crucial. Navigating the high regulation landscape is key to maximizing your short term rental income potential. Let's dive into the specifics.
Key Champorcher Airbnb Performance Metrics Overview
Monthly Airbnb Revenue Variations & Income Potential in Champorcher (2025)
Understanding the monthly revenue variations for Airbnb listings in Champorcher is key to maximizing your short term rental income potential. Seasonality significantly impacts earnings. Our analysis, based on data from the past 12 months, shows that the peak revenue month for STRs in Champorcher is typically August, while May often presents the lowest earnings, highlighting opportunities for strategic pricing adjustments during shoulder and low seasons. Explore the typical Airbnb income in Champorcher across different performance tiers:
- Best-in-class properties (Top 10%) achieve $2,061+ monthly, often utilizing dynamic pricing and superior guest experiences.
- Strong performing properties (Top 25%) earn $1,494 or more, indicating effective management and desirable locations/amenities.
- Typical properties (Median) generate around $910 per month, representing the average market performance.
- Entry-level properties (Bottom 25%) see earnings around $397, often with potential for optimization.
Average Monthly Airbnb Earnings Trend in Champorcher
Champorcher Airbnb Occupancy Rate Trends (2025)
Maximize your bookings by understanding the Champorcher STR occupancy trends. Seasonal demand shifts significantly influence how often properties are booked. Typically, Augustsees the highest demand (peak season occupancy), while May experiences the lowest (low season). Effective strategies, like adjusting minimum stays or offering promotions, can boost occupancy during slower periods. Here's how different property tiers perform in Champorcher:
- Best-in-class properties (Top 10%) achieve 62%+ occupancy, indicating high desirability and potentially optimized availability.
- Strong performing properties (Top 25%) maintain 46% or higher occupancy, suggesting good market fit and guest satisfaction.
- Typical properties (Median) have an occupancy rate around 27%.
- Entry-level properties (Bottom 25%) average 14% occupancy, potentially facing higher vacancy.
Average Monthly Occupancy Rate Trend in Champorcher
Average Daily Rate (ADR) Airbnb Trends in Champorcher (2025)
Effective short term rental pricing strategy in Champorcher involves understanding monthly ADR fluctuations. The Average Daily Rate (ADR) for Airbnb in Champorcher typically peaks in December and dips lowest during September. Leveraging Airbnb dynamic pricing tools or strategies based on this seasonality can significantly boost revenue. Here's a look at the typical nightly rates achieved:
- Best-in-class properties (Top 10%) command rates of $171+ per night, often due to premium features or locations.
- Strong performing properties (Top 25%) achieve nightly rates of $126 or more.
- Typical properties (Median) charge around $96 per night.
- Entry-level properties (Bottom 25%) earn around $73 per night.
Average Daily Rate (ADR) Trend by Month in Champorcher
Get Live Champorcher Market Intelligence 👇
Explore Real-time Analytics
Airbnb Seasonality Analysis & Trends in Champorcher (2025)
Peak Season (August, July, January)
- Revenue averages $1,695 per month
- Occupancy rates average 48.1%
- Daily rates average $109
Shoulder Season
- Revenue averages $1,026 per month
- Occupancy maintains around 28.8%
- Daily rates hold near $113
Low Season (May, June, September)
- Revenue drops to average $606 per month
- Occupancy decreases to average 21.4%
- Daily rates adjust to average $97
Seasonality Insights for Champorcher
- The Airbnb seasonality in Champorcher shows highly seasonal trends requiring careful strategy. While the sections above show seasonal averages, it's also insightful to look at the extremes:
- During the high season, the absolute peak month showcases Champorcher's highest earning potential, with monthly revenues capable of climbing to $2,023, occupancy reaching a high of 66.8%, and ADRs peaking at $130.
- Conversely, the slowest single month of the year, typically falling within the low season, marks the market's lowest point. In this month, revenue might dip to $405, occupancy could drop to 14.1%, and ADRs may adjust down to $96.
- Understanding both the seasonal averages and these monthly peaks and troughs in revenue, occupancy, and ADR is crucial for maximizing your Airbnb profit potential in Champorcher.
Seasonal Strategies for Maximizing Profit
- Peak Season: Maximize revenue through premium pricing and potentially longer minimum stays. Ensure high availability.
- Low Season: Offer competitive pricing, special promotions (e.g., extended stay discounts), and flexible cancellation policies. Target off-season travelers like remote workers or budget-conscious guests.
- Shoulder Seasons: Implement dynamic pricing that balances peak and low rates. Target weekend travelers or specific events. Offer slightly more flexible terms than peak season.
- Regularly analyze your own performance against these Champorcher seasonality benchmarks and adjust your pricing and availability strategy accordingly.
Best Areas for Airbnb Investment in Champorcher (2025)
Exploring the top neighborhoods for short-term rentals in Champorcher? This section highlights key areas, outlining why they are attractive for hosts and guests, along with notable local attractions. Consider these locations based on your target guest profile and investment strategy.
| Neighborhood / Area | Why Host Here? (Target Guests & Appeal) | Key Attractions & Landmarks |
|---|---|---|
| Champorcher Village | A charming village offering stunning mountain views and a tranquil environment, perfect for nature lovers and those seeking relaxation. | Mont Avic Natural Park, Champorcher Ski Resort, Chiesa di San Bartolomeo, historic alpine architecture, hiking trails |
| Lago di Brusson | A picturesque lake surrounded by mountains, ideal for outdoor activities like fishing, hiking, and picnicking. Attractive location for families and nature enthusiasts. | Brusson Lake, water sports activities, scenic hiking trails, beautiful picnic areas, local eateries |
| Ceresole Reale | A stunning natural area popular for its lake and outdoor recreation. Great for tourists looking to immerse themselves in nature and enjoy activities like trekking. | Ceresole Reale Lake, Gran Paradiso National Park, excellent trekking routes, wildlife viewing, local cuisine |
| Valle di Champorcher | Known for its breathtaking landscapes and rich biodiversity, it attracts outdoor enthusiasts and those wanting to explore the beauty of the Aosta Valley. | Valley hikes, wildflower viewing, local flora and fauna, traditional mountain huts, winter sports activities |
| Lillaz Waterfalls | A stunning natural attraction with beautiful waterfalls. Great spot for hiking and enjoying the view, attracting both tourists and locals. | Lillaz Falls, hiking routes, local cafes, scenic viewpoints, photography opportunities |
| Gressoney Valley | A valley offering activities for both winter sports and summer hiking. Known for its fantastic landscapes and traditional Walser culture. | Gressoney Ski Region, Lago di Gressoney, Walser Heritage Museum, mountain trails, cultural festivals |
| Alagna Valsesia | A small village famous for its mountain trails, skiing, and vibrant hiking community. Offers a mix of adventure and culture. | Monterosa Ski area, hiking to Monte Rosa, traditional Valser cuisine, local artisan shops, cultural festivals |
| Pont-Saint-Martin | A historic town with ancient Roman architecture. An attractive location for tourists interested in history and culture. | Roman Bridge, historic town center, local markets, museums, cultural events |
Understanding Airbnb License Requirements & STR Laws in Champorcher (2025)
Yes, Champorcher, Aosta Valley, Italy enforces high STR regulations. Obtaining a license and ensuring compliance is almost certainly required according to current 2025 STR laws. Always verify the latest short term rental regulations and Airbnb license requirements directly with local government authorities for Champorcher to ensure full compliance before hosting.
(Source: AirROI data, 2025, based on 64% licensed listings)
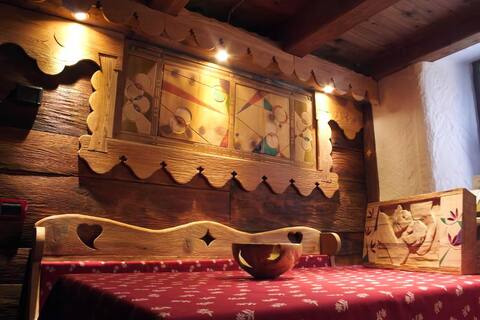
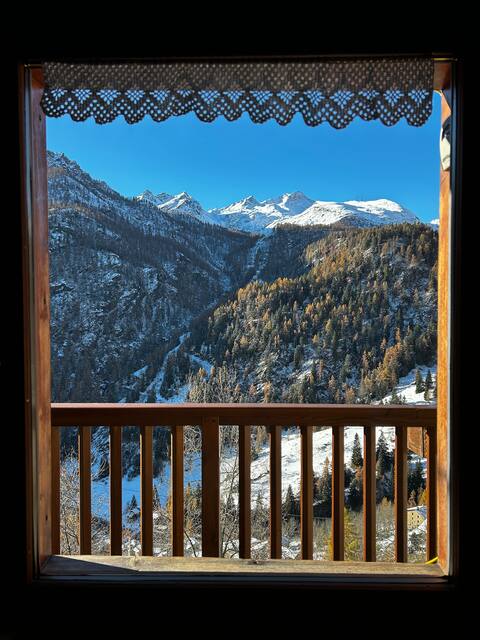
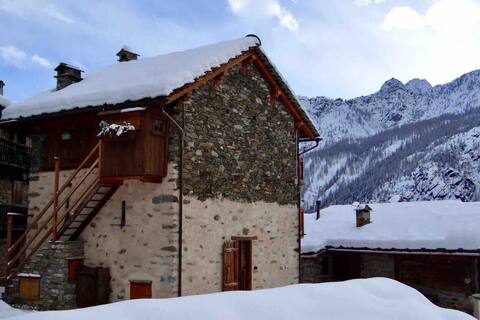
Top Performing Airbnb Properties in Champorcher (2025)
Benchmark your potential! Explore examples of top-performing Airbnb properties in Champorcherbased on Trailing Twelve Month (TTM) revenue. Analyze their characteristics, revenue, occupancy rate, and ADR to understand what drives success in this market.
B&B La Maison de Grand-Maman
Entire Place • 3 bedrooms
Grandma's barn chalet
Entire Place • 1 bedroom

Alloggio Champorcher
Entire Place • 1 bedroom
"Lou mitti de Emma" Petit Mont Blanc
Entire Place • 2 bedrooms

Il Castello nel Bosco, apartment "Valle"
Entire Place • 1 bedroom
Il Castello nel Bosco, apartment "Torrente"
Entire Place • 1 bedroom
Note: Performance varies based on location, size, amenities, seasonality, and management quality. Data reflects the past 12 months.
Top Performing Airbnb Hosts in Champorcher (2025)
Learn from the best! This table showcases top-performing Airbnb hosts in Champorcher based on the number of properties managed and estimated total revenue over the past year. Analyze their scale and performance metrics.
| Host Name | Properties | Grossing Revenue | Stay Reviews | Avg Rating |
|---|---|---|---|---|
| Flavio | 3 | $37,597 | 46 | 4.93/5.0 |
| Massimiliano | 2 | $26,185 | 179 | 4.98/5.0 |
| Enea | 2 | $22,594 | 138 | 4.97/5.0 |
| Johara | 1 | $17,420 | 136 | 4.91/5.0 |
| Valentina | 1 | $16,361 | 20 | 5.00/5.0 |
| Katia | 1 | $12,771 | 48 | 4.85/5.0 |
| Giorgia | 1 | $10,067 | 27 | 4.85/5.0 |
| Host #474625590 | 1 | $6,288 | 1 | 0.00/5.0 |
| Michel | 1 | $5,370 | 23 | 4.61/5.0 |
| Lilli | 1 | $5,020 | 14 | 4.93/5.0 |
Analyzing the strategies of top hosts, such as their property selection, pricing, and guest communication, can offer valuable lessons for optimizing your own Airbnb operations in Champorcher.
Dive Deeper: Advanced Champorcher STR Market Data (2025)
Ready to unlock more insights? AirROI provides access to advanced metrics and comprehensive Airbnb data for Champorcher. Explore detailed analytics beyond this report to refine your investment strategy, optimize pricing, and maximize your vacation rental profits.
Explore Advanced MetricsChamporcher Short-Term Rental Market Composition (2025): Property & Room Types
Room Type Distribution
Property Type Distribution
Market Composition Insights for Champorcher
- The Champorcher Airbnb market composition is heavily skewed towards Entire Home/Apt listings, which make up 88% of the 25 active rentals. This indicates strong guest preference for privacy and space.
- Looking at the property type distribution in Champorcher, Apartment/Condo properties are the most common (52%), reflecting the local real estate landscape.
- Houses represent a significant 32% portion, catering likely to families or larger groups.
- The presence of 12% Hotel/Boutique listings indicates integration with traditional hospitality.
- Smaller segments like outdoor/unique (combined 4.0%) offer potential for unique stay experiences.
Champorcher Airbnb Room Capacity Analysis (2025): Bedroom Distribution
Distribution of Listings by Number of Bedrooms
Room Capacity Insights for Champorcher
- The dominant room capacity in Champorcher is 1 bedroom listings, making up 40% of the market. This suggests a strong demand for properties suitable for couples or solo travelers.
- Together, 1 bedroom and 2 bedrooms properties represent 68.0% of the active Airbnb listings in Champorcher, indicating a high concentration in these sizes.
Champorcher Vacation Rental Guest Capacity Trends (2025)
Distribution of Listings by Guest Capacity
Guest Capacity Insights for Champorcher
- The most common guest capacity trend in Champorcher vacation rentals is listings accommodating 4 guests (28%). This suggests the primary traveler segment is likely small families or groups.
- Properties designed for 4 guests and 2 guests dominate the Champorcher STR market, accounting for 48.0% of listings.
- 28.0% of properties accommodate 6+ guests, serving the market segment for larger families or group travel in Champorcher.
- On average, properties in Champorcher are equipped to host 4.1 guests.
Champorcher Airbnb Booking Patterns (2025): Available vs. Booked Days
Available Days Distribution
Booked Days Distribution
Booking Pattern Insights for Champorcher
- The most common availability pattern in Champorcher falls within the 271-366 days range, representing 72% of listings. This suggests many properties have significant open periods on their calendars.
- Approximately 96.0% of listings show high availability (181+ days open annually), indicating potential for increased bookings or specific owner usage patterns.
- For booked days, the 31-90 days range is most frequent in Champorcher (48%), reflecting common guest stay durations or potential owner blocking patterns.
- A notable 4.0% of properties secure long booking periods (181+ days booked per year), highlighting successful long-term rental strategies or significant owner usage.
Champorcher Airbnb Minimum Stay Requirements Analysis
Distribution of Listings by Minimum Night Requirement
2 Nights
8 listings
33.3% of total
3 Nights
2 listings
8.3% of total
4-6 Nights
4 listings
16.7% of total
7-29 Nights
7 listings
29.2% of total
30+ Nights
3 listings
12.5% of total
Key Insights
- The most prevalent minimum stay requirement in Champorcher is 2 Nights, adopted by 33.3% of listings. This highlights the market's preference for shorter, flexible bookings.
- A significant segment (12.5%) caters to monthly stays (30+ nights) in Champorcher, pointing to opportunities in the extended-stay market.
Recommendations
- Align with the market by considering a 2 Nights minimum stay, as 33.3% of Champorcher hosts use this setting.
- A 2-night minimum appears standard (33.3%). Consider this for weekends or peak periods.
- Explore offering discounts for stays of 30+ nights to attract the 12.5% of the market seeking extended stays.
- Adjust minimum nights based on seasonality – potentially shorter during low season and longer during peak demand periods in Champorcher.
Champorcher Airbnb Cancellation Policy Trends Analysis (2025)
Flexible
4 listings
17.4% of total
Moderate
12 listings
52.2% of total
Strict
7 listings
30.4% of total
Cancellation Policy Insights for Champorcher
- The prevailing Airbnb cancellation policy trend in Champorcher is Moderate, used by 52.2% of listings.
- There's a relatively balanced mix between guest-friendly (69.6%) and stricter (30.4%) policies, offering choices for different guest needs.
Recommendations for Hosts
- Consider adopting a Moderate policy to align with the 52.2% market standard in Champorcher.
- With 30.4% using Strict terms, this is a viable option in Champorcher, particularly for high-value properties or during peak demand periods.
- Regularly review your cancellation policy against competitors and market demand shifts in Champorcher.
Champorcher STR Booking Lead Time Analysis (2025)
Average Booking Lead Time by Month
Booking Lead Time Insights for Champorcher
- The overall average booking lead time for vacation rentals in Champorcher is 54 days.
- Guests book furthest in advance for stays during August (average 88 days), likely coinciding with peak travel demand or local events.
- The shortest booking windows occur for stays in November (average 13 days), indicating more last-minute travel plans during this time.
- Seasonally, Summer (67 days avg.) sees the longest lead times, while Fall (28 days avg.) has the shortest, reflecting typical travel planning cycles.
Recommendations for Hosts
- Use the overall average lead time (54 days) as a baseline for your pricing and availability strategy in Champorcher.
- For August stays, consider implementing length-of-stay discounts or slightly higher rates for bookings made less than 88 days out to capitalize on advance planning.
- During November, focus on last-minute booking availability and promotions, as guests book with very short notice (13 days avg.).
- Target marketing efforts for the Summer season well in advance (at least 67 days) to capture early planners.
- Monitor your own booking lead times against these Champorcher averages to identify opportunities for dynamic pricing adjustments.
Popular & Essential Airbnb Amenities in Champorcher (2025)
Amenity Prevalence
Amenity Insights for Champorcher
- Popular amenities like Kitchen, Heating, Hot water are common but not universal. Offering these can provide a competitive edge.
Recommendations for Hosts
- Consider adding popular differentiators like Kitchen or Heating to increase appeal.
- Highlight unique or less common amenities you offer (e.g., hot tub, dedicated workspace, EV charger) in your listing description and photos.
- Regularly check competitor amenities in Champorcher to stay competitive.
Champorcher Airbnb Guest Demographics & Profile Analysis (2025)
Guest Profile Summary for Champorcher
- The typical guest profile for Airbnb in Champorcher consists of a mix of domestic (54%) and international guests, often arriving from nearby Milan, typically belonging to the Post-2000s (Gen Z/Alpha) group (50%), primarily speaking English or Italian.
- Domestic travelers account for 53.9% of guests.
- Key international markets include Italy (53.9%) and France (14.8%).
- Top languages spoken are English (35.6%) followed by Italian (20.8%).
- A significant demographic segment is the Post-2000s (Gen Z/Alpha) group, representing 50% of guests.
Recommendations for Hosts
- Balance marketing efforts between domestic and international channels based on the guest mix.
- Tailor amenities and listing descriptions to appeal to the dominant Post-2000s (Gen Z/Alpha) demographic (e.g., highlight fast WiFi, smart home features, local guides).
- Highlight unique local experiences or amenities relevant to the primary guest profile.
- Consider seasonal promotions aligned with peak travel times for key origin markets.
Nearby Short-Term Rental Market Comparison
How does the Champorcher Airbnb market stack up against its neighbors? Compare key performance metrics like average monthly revenue, ADR, and occupancy rates in surrounding areas to understand the broader regional STR landscape.
| Market | Active Properties | Monthly Revenue | Daily Rate | Avg. Occupancy |
|---|---|---|---|---|
| Lauterbrunnen | 525 | $7,079 | $546.45 | 54% |
| La Rivière-Enverse | 17 | $5,972 | $624.02 | 41% |
| Les Clefs | 30 | $5,741 | $323.11 | 44% |
| Matten bei Interlaken | 52 | $5,674 | $316.63 | 63% |
| Iseltwald | 14 | $5,491 | $331.95 | 58% |
| Habkern | 13 | $5,382 | $344.74 | 50% |
| Interlaken | 288 | $4,987 | $310.52 | 56% |
| Grindelwald | 489 | $4,921 | $345.40 | 57% |
| Zermatt | 734 | $4,604 | $463.00 | 46% |
| Oberhofen am Thunersee | 24 | $4,572 | $265.94 | 55% |