Tortoreto Airbnb Market Analysis 2025: Short Term Rental Data & Vacation Rental Statistics in Abruzzo, Italy
Is Airbnb profitable in Tortoreto in 2025? Explore comprehensive Airbnb analytics for Tortoreto, Abruzzo, Italy to uncover income potential. This 2025 STR market report for Tortoreto, based on AirROI data from April 2024 to March 2025, reveals key trends in the niche market of 108 active listings.
Whether you're considering an Airbnb investment in Tortoreto, optimizing your existing vacation rental, or exploring rental arbitrage opportunities, understanding the Tortoreto Airbnb data is crucial. Navigating the high regulation landscape is key to maximizing your short term rental income potential. Let's dive into the specifics.
Key Tortoreto Airbnb Performance Metrics Overview
Monthly Airbnb Revenue Variations & Income Potential in Tortoreto (2025)
Understanding the monthly revenue variations for Airbnb listings in Tortoreto is key to maximizing your short term rental income potential. Seasonality significantly impacts earnings. Our analysis, based on data from the past 12 months, shows that the peak revenue month for STRs in Tortoreto is typically August, while January often presents the lowest earnings, highlighting opportunities for strategic pricing adjustments during shoulder and low seasons. Explore the typical Airbnb income in Tortoreto across different performance tiers:
- Best-in-class properties (Top 10%) achieve $2,343+ monthly, often utilizing dynamic pricing and superior guest experiences.
- Strong performing properties (Top 25%) earn $1,505 or more, indicating effective management and desirable locations/amenities.
- Typical properties (Median) generate around $901 per month, representing the average market performance.
- Entry-level properties (Bottom 25%) see earnings around $488, often with potential for optimization.
Average Monthly Airbnb Earnings Trend in Tortoreto
Tortoreto Airbnb Occupancy Rate Trends (2025)
Maximize your bookings by understanding the Tortoreto STR occupancy trends. Seasonal demand shifts significantly influence how often properties are booked. Typically, Augustsees the highest demand (peak season occupancy), while April experiences the lowest (low season). Effective strategies, like adjusting minimum stays or offering promotions, can boost occupancy during slower periods. Here's how different property tiers perform in Tortoreto:
- Best-in-class properties (Top 10%) achieve 69%+ occupancy, indicating high desirability and potentially optimized availability.
- Strong performing properties (Top 25%) maintain 47% or higher occupancy, suggesting good market fit and guest satisfaction.
- Typical properties (Median) have an occupancy rate around 31%.
- Entry-level properties (Bottom 25%) average 17% occupancy, potentially facing higher vacancy.
Average Monthly Occupancy Rate Trend in Tortoreto
Average Daily Rate (ADR) Airbnb Trends in Tortoreto (2025)
Effective short term rental pricing strategy in Tortoreto involves understanding monthly ADR fluctuations. The Average Daily Rate (ADR) for Airbnb in Tortoreto typically peaks in August and dips lowest during January. Leveraging Airbnb dynamic pricing tools or strategies based on this seasonality can significantly boost revenue. Here's a look at the typical nightly rates achieved:
- Best-in-class properties (Top 10%) command rates of $151+ per night, often due to premium features or locations.
- Strong performing properties (Top 25%) achieve nightly rates of $116 or more.
- Typical properties (Median) charge around $89 per night.
- Entry-level properties (Bottom 25%) earn around $66 per night.
Average Daily Rate (ADR) Trend by Month in Tortoreto
Get Live Tortoreto Market Intelligence 👇

Explore Real-time Analytics
Airbnb Seasonality Analysis & Trends in Tortoreto (2025)
Peak Season (August, July, June)
- Revenue averages $2,187 per month
- Occupancy rates average 51.9%
- Daily rates average $115
Shoulder Season
- Revenue averages $901 per month
- Occupancy maintains around 30.7%
- Daily rates hold near $99
Low Season (January, February, December)
- Revenue drops to average $468 per month
- Occupancy decreases to average 25.0%
- Daily rates adjust to average $89
Seasonality Insights for Tortoreto
- The Airbnb seasonality in Tortoreto shows highly seasonal trends requiring careful strategy. While the sections above show seasonal averages, it's also insightful to look at the extremes:
- During the high season, the absolute peak month showcases Tortoreto's highest earning potential, with monthly revenues capable of climbing to $3,011, occupancy reaching a high of 70.8%, and ADRs peaking at $119.
- Conversely, the slowest single month of the year, typically falling within the low season, marks the market's lowest point. In this month, revenue might dip to $364, occupancy could drop to 18.6%, and ADRs may adjust down to $89.
- Understanding both the seasonal averages and these monthly peaks and troughs in revenue, occupancy, and ADR is crucial for maximizing your Airbnb profit potential in Tortoreto.
Seasonal Strategies for Maximizing Profit
- Peak Season: Maximize revenue through premium pricing and potentially longer minimum stays. Ensure high availability.
- Low Season: Offer competitive pricing, special promotions (e.g., extended stay discounts), and flexible cancellation policies. Target off-season travelers like remote workers or budget-conscious guests.
- Shoulder Seasons: Implement dynamic pricing that balances peak and low rates. Target weekend travelers or specific events. Offer slightly more flexible terms than peak season.
- Regularly analyze your own performance against these Tortoreto seasonality benchmarks and adjust your pricing and availability strategy accordingly.
Best Areas for Airbnb Investment in Tortoreto (2025)
Exploring the top neighborhoods for short-term rentals in Tortoreto? This section highlights key areas, outlining why they are attractive for hosts and guests, along with notable local attractions. Consider these locations based on your target guest profile and investment strategy.
| Neighborhood / Area | Why Host Here? (Target Guests & Appeal) | Key Attractions & Landmarks |
|---|---|---|
| Tortoreto Beach | A popular seaside destination with beautiful sandy beaches, ideal for summer vacationers seeking sun and relaxation by the Adriatic Sea. | Tortoreto Lido Beach, Beachfront promenade, Il Molo, Parco della Luna, Water parks nearby |
| Historic Tortoreto | This area offers charm and history, with medieval architecture and stunning views over the coast, attracting visitors interested in culture and heritage. | Tortoreto Alto, Church of Santa Maria della Misericordia, Ancient walls, Scenic viewpoints, Local eateries |
| Roseto degli Abruzzi | A close neighboring town that provides additional attractions and amenities, and is known for its beautiful beach and family-friendly atmosphere. | Roseto Beach, Pinewood parks, Cultural festivals, Shopping centers, Promenade |
| Giulianova | Another nearby beach town with a vibrant local community and events, popular for its long, sandy beaches and historic sites. | Giulianova Beach, Old Town, Port with fishing heritage, Cultural events, Restaurants and bars |
| Pineto | Famous for its protected natural park and tranquil beaches, attracting nature lovers and families looking for a relaxed environment. | Pineto Beach, Cerrano Abbey, Nature trails, Local markets, Pinewoods |
| Silvi Marina | Known for its lively beach scene and nightlife, making it attractive for younger tourists looking to enjoy beach parties and entertainment. | Silvi Beach, Nightclubs, Bars and restaurants, Beach clubs, Markets |
| Alba Adriatica | A family-friendly beach destination with a long stretch of coastline and many activities for children, attracting tourists looking for family vacations. | Alba Adriatica Beach, Seafront cycling path, Water sports, Family-friendly activities, Local cuisine |
| Teramo | Though a bit inland, Teramo offers cultural heritage and historical sites for tourists looking to explore the surrounding region of Abruzzo. | Teramo Cathedral, Roman theatre, Historical museums, Local festivals, Cuisine experiences |
Understanding Airbnb License Requirements & STR Laws in Tortoreto (2025)
Yes, Tortoreto, Abruzzo, Italy enforces high STR regulations. Obtaining a license and ensuring compliance is almost certainly required according to current 2025 STR laws. Always verify the latest short term rental regulations and Airbnb license requirements directly with local government authorities for Tortoreto to ensure full compliance before hosting.
(Source: AirROI data, 2025, based on 38% licensed listings)
Top Performing Airbnb Properties in Tortoreto (2025)
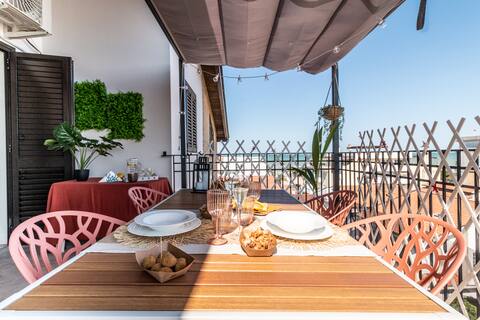
Benchmark your potential! Explore examples of top-performing Airbnb properties in Tortoretobased on Trailing Twelve Month (TTM) revenue. Analyze their characteristics, revenue, occupancy rate, and ADR to understand what drives success in this market.

HoliHome_Sara's House 50m from the sea
Entire Place • 2 bedrooms
Winter holidays by the sea: Italian relax
Entire Place • 2 bedrooms
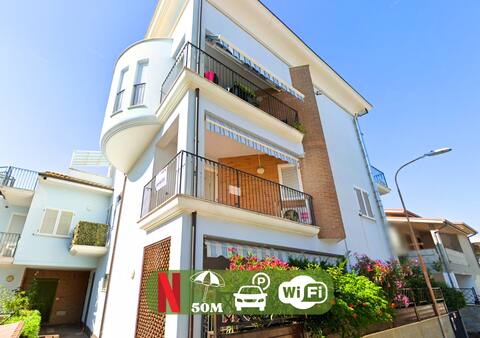
Holihome_Stefano's house 50m from the sea
Entire Place • 2 bedrooms

Holihome_C&C Sunrise House
Entire Place • 2 bedrooms

Attic 30 Meters From the Sea
Entire Place • 1 bedroom

Fonte del Ceppo 1 by Interhome
Entire Place • 4 bedrooms
Note: Performance varies based on location, size, amenities, seasonality, and management quality. Data reflects the past 12 months.
Top Performing Airbnb Hosts in Tortoreto (2025)
Learn from the best! This table showcases top-performing Airbnb hosts in Tortoreto based on the number of properties managed and estimated total revenue over the past year. Analyze their scale and performance metrics.
| Host Name | Properties | Grossing Revenue | Stay Reviews | Avg Rating |
|---|---|---|---|---|
| Fabian | 11 | $168,511 | 79 | 4.36/5.0 |
| Smart And | 9 | $34,470 | 79 | 4.74/5.0 |
| Alessandra | 1 | $27,574 | 45 | 4.84/5.0 |
| Alessandro | 2 | $25,410 | 91 | 4.84/5.0 |
| Host #466614915 | 2 | $22,863 | 74 | 4.64/5.0 |
| Miria | 3 | $22,685 | 22 | 4.90/5.0 |
| Cristiano | 1 | $19,388 | 28 | 4.89/5.0 |
| Marion - Interhome Group | 1 | $18,953 | 3 | 4.67/5.0 |
| Cristina | 2 | $16,745 | 14 | 5.00/5.0 |
| Host #6035938 | 3 | $15,527 | 1 | 0.00/5.0 |
Analyzing the strategies of top hosts, such as their property selection, pricing, and guest communication, can offer valuable lessons for optimizing your own Airbnb operations in Tortoreto.
Dive Deeper: Advanced Tortoreto STR Market Data (2025)
Ready to unlock more insights? AirROI provides access to advanced metrics and comprehensive Airbnb data for Tortoreto. Explore detailed analytics beyond this report to refine your investment strategy, optimize pricing, and maximize your vacation rental profits.
Explore Advanced MetricsTortoreto Short-Term Rental Market Composition (2025): Property & Room Types
Room Type Distribution
Property Type Distribution
Market Composition Insights for Tortoreto
- The Tortoreto Airbnb market composition is heavily skewed towards Entire Home/Apt listings, which make up 99.1% of the 108 active rentals. This indicates strong guest preference for privacy and space.
- Looking at the property type distribution in Tortoreto, Apartment/Condo properties are the most common (83.3%), reflecting the local real estate landscape.
- Houses represent a significant 16.7% portion, catering likely to families or larger groups.
Tortoreto Airbnb Room Capacity Analysis (2025): Bedroom Distribution
Distribution of Listings by Number of Bedrooms
Room Capacity Insights for Tortoreto
- The dominant room capacity in Tortoreto is 2 bedrooms listings, making up 47.2% of the market. This suggests a strong demand for properties suitable for couples or solo travelers.
- Together, 2 bedrooms and 1 bedroom properties represent 88.9% of the active Airbnb listings in Tortoreto, indicating a high concentration in these sizes.
Tortoreto Vacation Rental Guest Capacity Trends (2025)
Distribution of Listings by Guest Capacity
Guest Capacity Insights for Tortoreto
- The most common guest capacity trend in Tortoreto vacation rentals is listings accommodating 4 guests (48.1%). This suggests the primary traveler segment is likely small families or groups.
- Properties designed for 4 guests and 6 guests dominate the Tortoreto STR market, accounting for 67.5% of listings.
- 25.9% of properties accommodate 6+ guests, serving the market segment for larger families or group travel in Tortoreto.
- On average, properties in Tortoreto are equipped to host 4.6 guests.
Tortoreto Airbnb Booking Patterns (2025): Available vs. Booked Days
Available Days Distribution
Booked Days Distribution
Booking Pattern Insights for Tortoreto
- The most common availability pattern in Tortoreto falls within the 271-366 days range, representing 73.1% of listings. This suggests many properties have significant open periods on their calendars.
- Approximately 94.4% of listings show high availability (181+ days open annually), indicating potential for increased bookings or specific owner usage patterns.
- For booked days, the 31-90 days range is most frequent in Tortoreto (47.2%), reflecting common guest stay durations or potential owner blocking patterns.
- A notable 6.5% of properties secure long booking periods (181+ days booked per year), highlighting successful long-term rental strategies or significant owner usage.
Tortoreto Airbnb Minimum Stay Requirements Analysis
Distribution of Listings by Minimum Night Requirement
1 Night
9 listings
9% of total
2 Nights
22 listings
22% of total
3 Nights
20 listings
20% of total
4-6 Nights
12 listings
12% of total
7-29 Nights
30 listings
30% of total
30+ Nights
7 listings
7% of total
Key Insights
- The most prevalent minimum stay requirement in Tortoreto is 7-29 Nights, adopted by 30% of listings. This highlights the market's preference for shorter, flexible bookings.
Recommendations
- Align with the market by considering a 7-29 Nights minimum stay, as 30% of Tortoreto hosts use this setting.
- If feasible, allowing 1-night stays, especially midweek or during low season, could capture last-minute bookings, as only 9% currently do.
- Explore offering discounts for stays of 30+ nights to attract the 7% of the market seeking extended stays.
- Adjust minimum nights based on seasonality – potentially shorter during low season and longer during peak demand periods in Tortoreto.
Tortoreto Airbnb Cancellation Policy Trends Analysis (2025)
Super Strict 60 Days
1 listings
1.3% of total
Super Strict 30 Days
2 listings
2.6% of total
Flexible
9 listings
11.5% of total
Moderate
47 listings
60.3% of total
Strict
19 listings
24.4% of total
Cancellation Policy Insights for Tortoreto
- The prevailing Airbnb cancellation policy trend in Tortoreto is Moderate, used by 60.3% of listings.
- The market strongly favors guest-friendly terms, with 71.8% of listings offering Flexible or Moderate policies. This suggests guests in Tortoreto may expect booking flexibility.
Recommendations for Hosts
- Consider adopting a Moderate policy to align with the 60.3% market standard in Tortoreto.
- Regularly review your cancellation policy against competitors and market demand shifts in Tortoreto.
Tortoreto STR Booking Lead Time Analysis (2025)
Average Booking Lead Time by Month
Booking Lead Time Insights for Tortoreto
- The overall average booking lead time for vacation rentals in Tortoreto is 53 days.
- Guests book furthest in advance for stays during July (average 95 days), likely coinciding with peak travel demand or local events.
- The shortest booking windows occur for stays in January (average 10 days), indicating more last-minute travel plans during this time.
- Seasonally, Summer (83 days avg.) sees the longest lead times, while Winter (24 days avg.) has the shortest, reflecting typical travel planning cycles.
Recommendations for Hosts
- Use the overall average lead time (53 days) as a baseline for your pricing and availability strategy in Tortoreto.
- For July stays, consider implementing length-of-stay discounts or slightly higher rates for bookings made less than 95 days out to capitalize on advance planning.
- During January, focus on last-minute booking availability and promotions, as guests book with very short notice (10 days avg.).
- Target marketing efforts for the Summer season well in advance (at least 83 days) to capture early planners.
- Monitor your own booking lead times against these Tortoreto averages to identify opportunities for dynamic pricing adjustments.
Popular & Essential Airbnb Amenities in Tortoreto (2025)
Amenity Prevalence
Amenity Insights for Tortoreto
- Essential amenities in Tortoreto that guests expect include: TV, Kitchen, Washer. Lacking these (any) could significantly impact bookings.
- Popular amenities like Hot water, Air conditioning, Refrigerator are common but not universal. Offering these can provide a competitive edge.
Recommendations for Hosts
- Ensure your listing includes all essential amenities for Tortoreto: TV, Kitchen, Washer.
- Prioritize adding missing essentials: Kitchen, Washer.
- Consider adding popular differentiators like Hot water or Air conditioning to increase appeal.
- Highlight unique or less common amenities you offer (e.g., hot tub, dedicated workspace, EV charger) in your listing description and photos.
- Regularly check competitor amenities in Tortoreto to stay competitive.
Tortoreto Airbnb Guest Demographics & Profile Analysis (2025)
Guest Profile Summary for Tortoreto
- The typical guest profile for Airbnb in Tortoreto consists of primarily domestic travelers (71%), often arriving from nearby Rome, typically belonging to the Post-2000s (Gen Z/Alpha) group (50%), primarily speaking English or Italian.
- Domestic travelers account for 70.9% of guests.
- Key international markets include Italy (70.9%) and Germany (4.9%).
- Top languages spoken are English (33.5%) followed by Italian (29.6%).
- A significant demographic segment is the Post-2000s (Gen Z/Alpha) group, representing 50% of guests.
Recommendations for Hosts
- Target domestic marketing efforts towards travelers from Rome and Milan.
- Tailor amenities and listing descriptions to appeal to the dominant Post-2000s (Gen Z/Alpha) demographic (e.g., highlight fast WiFi, smart home features, local guides).
- Highlight unique local experiences or amenities relevant to the primary guest profile.
- Consider seasonal promotions aligned with peak travel times for key origin markets.
Nearby Short-Term Rental Market Comparison
How does the Tortoreto Airbnb market stack up against its neighbors? Compare key performance metrics like average monthly revenue, ADR, and occupancy rates in surrounding areas to understand the broader regional STR landscape.
| Market | Active Properties | Monthly Revenue | Daily Rate | Avg. Occupancy |
|---|---|---|---|---|
| Rome | 23,290 | $2,898 | $208.87 | 51% |
| Collazzone | 28 | $2,839 | $341.11 | 36% |
| Parrano | 18 | $2,762 | $329.95 | 34% |
| Monte Castello di Vibio | 18 | $2,659 | $567.21 | 41% |
| Guardea | 15 | $2,542 | $320.56 | 35% |
| Monteleone d'Orvieto | 31 | $2,537 | $306.96 | 36% |
| Lugnano in Teverina | 19 | $2,238 | $267.38 | 35% |
| Collevecchio | 12 | $2,213 | $302.16 | 38% |
| Lisciano Niccone | 30 | $2,175 | $384.66 | 35% |
| Palombara Sabina | 16 | $2,160 | $336.01 | 35% |