Tagliacozzo Airbnb Market Analysis 2025: Short Term Rental Data & Vacation Rental Statistics in Abruzzo, Italy
Is Airbnb profitable in Tagliacozzo in 2025? Explore comprehensive Airbnb analytics for Tagliacozzo, Abruzzo, Italy to uncover income potential. This 2025 STR market report for Tagliacozzo, based on AirROI data from April 2024 to March 2025, reveals key trends in the niche market of 30 active listings.
Whether you're considering an Airbnb investment in Tagliacozzo, optimizing your existing vacation rental, or exploring rental arbitrage opportunities, understanding the Tagliacozzo Airbnb data is crucial. Understanding the local regulations is key to maximizing your short term rental income potential. Let's dive into the specifics.
Key Tagliacozzo Airbnb Performance Metrics Overview
Monthly Airbnb Revenue Variations & Income Potential in Tagliacozzo (2025)
Understanding the monthly revenue variations for Airbnb listings in Tagliacozzo is key to maximizing your short term rental income potential. Seasonality significantly impacts earnings. Our analysis, based on data from the past 12 months, shows that the peak revenue month for STRs in Tagliacozzo is typically August, while January often presents the lowest earnings, highlighting opportunities for strategic pricing adjustments during shoulder and low seasons. Explore the typical Airbnb income in Tagliacozzo across different performance tiers:
- Best-in-class properties (Top 10%) achieve $1,895+ monthly, often utilizing dynamic pricing and superior guest experiences.
- Strong performing properties (Top 25%) earn $1,108 or more, indicating effective management and desirable locations/amenities.
- Typical properties (Median) generate around $407 per month, representing the average market performance.
- Entry-level properties (Bottom 25%) see earnings around $172, often with potential for optimization.
Average Monthly Airbnb Earnings Trend in Tagliacozzo
Tagliacozzo Airbnb Occupancy Rate Trends (2025)
Maximize your bookings by understanding the Tagliacozzo STR occupancy trends. Seasonal demand shifts significantly influence how often properties are booked. Typically, Augustsees the highest demand (peak season occupancy), while January experiences the lowest (low season). Effective strategies, like adjusting minimum stays or offering promotions, can boost occupancy during slower periods. Here's how different property tiers perform in Tagliacozzo:
- Best-in-class properties (Top 10%) achieve 49%+ occupancy, indicating high desirability and potentially optimized availability.
- Strong performing properties (Top 25%) maintain 30% or higher occupancy, suggesting good market fit and guest satisfaction.
- Typical properties (Median) have an occupancy rate around 14%.
- Entry-level properties (Bottom 25%) average 7% occupancy, potentially facing higher vacancy.
Average Monthly Occupancy Rate Trend in Tagliacozzo
Average Daily Rate (ADR) Airbnb Trends in Tagliacozzo (2025)
Effective short term rental pricing strategy in Tagliacozzo involves understanding monthly ADR fluctuations. The Average Daily Rate (ADR) for Airbnb in Tagliacozzo typically peaks in October and dips lowest during November. Leveraging Airbnb dynamic pricing tools or strategies based on this seasonality can significantly boost revenue. Here's a look at the typical nightly rates achieved:
- Best-in-class properties (Top 10%) command rates of $138+ per night, often due to premium features or locations.
- Strong performing properties (Top 25%) achieve nightly rates of $109 or more.
- Typical properties (Median) charge around $88 per night.
- Entry-level properties (Bottom 25%) earn around $71 per night.
Average Daily Rate (ADR) Trend by Month in Tagliacozzo
Get Live Tagliacozzo Market Intelligence 👇

Explore Real-time Analytics
Airbnb Seasonality Analysis & Trends in Tagliacozzo (2025)
Peak Season (August, April, May)
- Revenue averages $1,109 per month
- Occupancy rates average 24.1%
- Daily rates average $118
Shoulder Season
- Revenue averages $723 per month
- Occupancy maintains around 22.0%
- Daily rates hold near $113
Low Season (January, February, November)
- Revenue drops to average $411 per month
- Occupancy decreases to average 15.2%
- Daily rates adjust to average $96
Seasonality Insights for Tagliacozzo
- The Airbnb seasonality in Tagliacozzo shows highly seasonal trends requiring careful strategy. While the sections above show seasonal averages, it's also insightful to look at the extremes:
- During the high season, the absolute peak month showcases Tagliacozzo's highest earning potential, with monthly revenues capable of climbing to $1,240, occupancy reaching a high of 37.9%, and ADRs peaking at $122.
- Conversely, the slowest single month of the year, typically falling within the low season, marks the market's lowest point. In this month, revenue might dip to $292, occupancy could drop to 9.4%, and ADRs may adjust down to $94.
- Understanding both the seasonal averages and these monthly peaks and troughs in revenue, occupancy, and ADR is crucial for maximizing your Airbnb profit potential in Tagliacozzo.
Seasonal Strategies for Maximizing Profit
- Peak Season: Maximize revenue through premium pricing and potentially longer minimum stays. Ensure high availability.
- Low Season: Offer competitive pricing, special promotions (e.g., extended stay discounts), and flexible cancellation policies. Target off-season travelers like remote workers or budget-conscious guests.
- Shoulder Seasons: Implement dynamic pricing that balances peak and low rates. Target weekend travelers or specific events. Offer slightly more flexible terms than peak season.
- Regularly analyze your own performance against these Tagliacozzo seasonality benchmarks and adjust your pricing and availability strategy accordingly.
Best Areas for Airbnb Investment in Tagliacozzo (2025)
Exploring the top neighborhoods for short-term rentals in Tagliacozzo? This section highlights key areas, outlining why they are attractive for hosts and guests, along with notable local attractions. Consider these locations based on your target guest profile and investment strategy.
| Neighborhood / Area | Why Host Here? (Target Guests & Appeal) | Key Attractions & Landmarks |
|---|---|---|
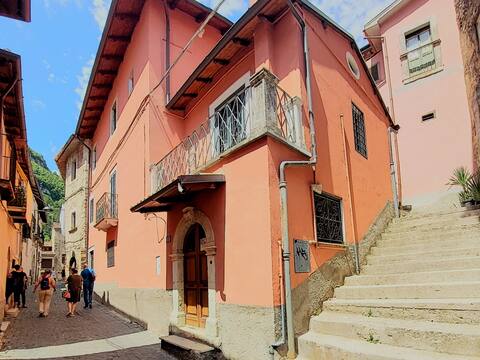
| Centro Storico | Charming old town area known for its medieval architecture and historical significance. Attracts tourists interested in culture, history, and beautiful landscapes. | Piazza dell'Ordine, Chiesa di Santa Maria ad Cryptas, Castello Piccolomini, Parco Centrale, Museo della Montagna |
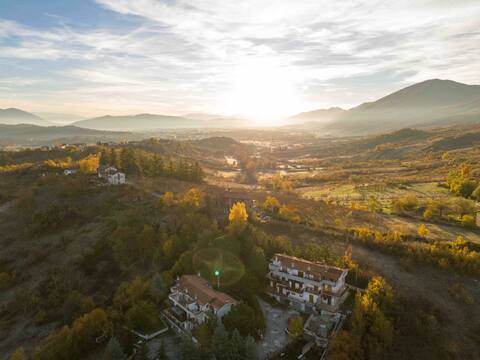
| Parco Regionale Sirente-Velino | Stunning natural park that offers outdoor activities such as hiking and skiing. Popular among nature enthusiasts and those seeking tranquility away from the city. | Lake Sinizzo, Monte Velino, Hiking trails, Wildlife viewing, Skiing in winter |
| Via Roma | Main street with shops and restaurants catering to both locals and tourists, providing a lively atmosphere and convenience for guests. | Shops and boutiques, Cafés and restaurants, Local markets, Art galleries, Street events |
| Via della Libertà | Residential area with a mix of locals and visitors, known for its homey atmosphere and proximity to main attractions. Ideal for longer stays. | Local eateries, Parks, Community events, Local artisans, Family-friendly activities |
| Colli di Licenza | Picturesque hills surrounding Tagliacozzo known for their scenic views and wine production. Excellent for guests seeking relaxation and natural beauty. | Vineyards, Scenic walking paths, Wine tasting tours, Rural architecture, Breathtaking views |
| Santo Stefano di Sessanio | A nearby medieval village offering a unique experience with its stone buildings and historical charm. Attracts tourists looking for authenticity. | Norman Castle, Cultural tours, Artisan shops, Authentic cuisine, Historical sites |
| Campo Felice | Popular ski area during winter months, attracting tourists for winter sports activities. Great for year-round visitors, especially in colder seasons. | Ski slopes, Snowboarding, Winter events, Mountain restaurants, Scenic views |
| Fagnano Alto | Rural area with tranquility and charm, ideal for guests looking for a peaceful getaway. Close to nature and outdoor activities. | Hiking trails, Local farms, Scenic landscapes, Peaceful retreats, Community festivals |
Understanding Airbnb License Requirements & STR Laws in Tagliacozzo (2025)
With 20% of listings showing registration in 2025, understanding potential Airbnb license requirements is crucial in Tagliacozzo. Always verify the latest short term rental regulations and Airbnb license requirements directly with local government authorities for Tagliacozzo to ensure full compliance before hosting.
(Source: AirROI data, 2025, based on 20% licensed listings)
Top Performing Airbnb Properties in Tagliacozzo (2025)
Benchmark your potential! Explore examples of top-performing Airbnb properties in Tagliacozzobased on Trailing Twelve Month (TTM) revenue. Analyze their characteristics, revenue, occupancy rate, and ADR to understand what drives success in this market.
Casa Graziella
Entire Place • 2 bedrooms
La Risorgente
Entire Place • 3 bedrooms

casetta nsullatèra
Entire Place • 1 bedroom

Pearl HOUSE in the center, panoramic view
Entire Place • 2 bedrooms
Delightful Villa in hillside estate, 1 hr to Rome
Entire Place • 3 bedrooms
Panoramic penthouse with breathtaking views
Entire Place • 2 bedrooms
Note: Performance varies based on location, size, amenities, seasonality, and management quality. Data reflects the past 12 months.
Top Performing Airbnb Hosts in Tagliacozzo (2025)
Learn from the best! This table showcases top-performing Airbnb hosts in Tagliacozzo based on the number of properties managed and estimated total revenue over the past year. Analyze their scale and performance metrics.
| Host Name | Properties | Grossing Revenue | Stay Reviews | Avg Rating |
|---|---|---|---|---|
| Federico | 1 | $17,107 | 10 | 4.80/5.0 |
| Maria | 1 | $17,023 | 7 | 4.86/5.0 |
| Luisa | 2 | $12,681 | 41 | 4.89/5.0 |
| Davide | 1 | $10,660 | 24 | 4.71/5.0 |
| Leonardo | 1 | $10,631 | 19 | 5.00/5.0 |
| Silvia | 1 | $8,465 | 14 | 4.71/5.0 |
| Yusmari | 1 | $7,876 | 8 | 5.00/5.0 |
| Anna Maria | 1 | $6,967 | 18 | 4.83/5.0 |
| Domenico | 2 | $6,795 | 17 | 2.44/5.0 |
| Host #166349750 | 1 | $4,291 | 21 | 4.71/5.0 |
Analyzing the strategies of top hosts, such as their property selection, pricing, and guest communication, can offer valuable lessons for optimizing your own Airbnb operations in Tagliacozzo.
Dive Deeper: Advanced Tagliacozzo STR Market Data (2025)
Ready to unlock more insights? AirROI provides access to advanced metrics and comprehensive Airbnb data for Tagliacozzo. Explore detailed analytics beyond this report to refine your investment strategy, optimize pricing, and maximize your vacation rental profits.
Explore Advanced MetricsTagliacozzo Short-Term Rental Market Composition (2025): Property & Room Types
Room Type Distribution
Property Type Distribution
Market Composition Insights for Tagliacozzo
- The Tagliacozzo Airbnb market composition is heavily skewed towards Entire Home/Apt listings, which make up 83.3% of the 30 active rentals. This indicates strong guest preference for privacy and space.
- Looking at the property type distribution in Tagliacozzo, Apartment/Condo properties are the most common (56.7%), reflecting the local real estate landscape.
- Houses represent a significant 43.3% portion, catering likely to families or larger groups.
Tagliacozzo Airbnb Room Capacity Analysis (2025): Bedroom Distribution
Distribution of Listings by Number of Bedrooms
Room Capacity Insights for Tagliacozzo
- The dominant room capacity in Tagliacozzo is 1 bedroom listings, making up 40% of the market. This suggests a strong demand for properties suitable for couples or solo travelers.
- Together, 1 bedroom and 2 bedrooms properties represent 73.3% of the active Airbnb listings in Tagliacozzo, indicating a high concentration in these sizes.
Tagliacozzo Vacation Rental Guest Capacity Trends (2025)
Distribution of Listings by Guest Capacity
Guest Capacity Insights for Tagliacozzo
- The most common guest capacity trend in Tagliacozzo vacation rentals is listings accommodating 4 guests (23.3%). This suggests the primary traveler segment is likely small families or groups.
- Properties designed for 4 guests and 3 guests dominate the Tagliacozzo STR market, accounting for 43.3% of listings.
- 20.0% of properties accommodate 6+ guests, serving the market segment for larger families or group travel in Tagliacozzo.
- On average, properties in Tagliacozzo are equipped to host 3.6 guests.
Tagliacozzo Airbnb Booking Patterns (2025): Available vs. Booked Days
Available Days Distribution
Booked Days Distribution
Booking Pattern Insights for Tagliacozzo
- The most common availability pattern in Tagliacozzo falls within the 271-366 days range, representing 86.7% of listings. This suggests many properties have significant open periods on their calendars.
- Approximately 96.7% of listings show high availability (181+ days open annually), indicating potential for increased bookings or specific owner usage patterns.
- For booked days, the 1-30 days range is most frequent in Tagliacozzo (53.3%), reflecting common guest stay durations or potential owner blocking patterns.
- A notable 3.3% of properties secure long booking periods (181+ days booked per year), highlighting successful long-term rental strategies or significant owner usage.
Tagliacozzo Airbnb Minimum Stay Requirements Analysis
Distribution of Listings by Minimum Night Requirement
1 Night
10 listings
37% of total
2 Nights
3 listings
11.1% of total
3 Nights
1 listings
3.7% of total
4-6 Nights
2 listings
7.4% of total
7-29 Nights
8 listings
29.6% of total
30+ Nights
3 listings
11.1% of total
Key Insights
- The most prevalent minimum stay requirement in Tagliacozzo is 1 Night, adopted by 37% of listings. This highlights the market's preference for shorter, flexible bookings.
- A significant segment (11.1%) caters to monthly stays (30+ nights) in Tagliacozzo, pointing to opportunities in the extended-stay market.
Recommendations
- Align with the market by considering a 1 Night minimum stay, as 37% of Tagliacozzo hosts use this setting.
- Explore offering discounts for stays of 30+ nights to attract the 11.1% of the market seeking extended stays.
- Adjust minimum nights based on seasonality – potentially shorter during low season and longer during peak demand periods in Tagliacozzo.
Tagliacozzo Airbnb Cancellation Policy Trends Analysis (2025)
Super Strict 30 Days
1 listings
3.8% of total
Flexible
6 listings
23.1% of total
Moderate
17 listings
65.4% of total
Strict
2 listings
7.7% of total
Cancellation Policy Insights for Tagliacozzo
- The prevailing Airbnb cancellation policy trend in Tagliacozzo is Moderate, used by 65.4% of listings.
- The market strongly favors guest-friendly terms, with 88.5% of listings offering Flexible or Moderate policies. This suggests guests in Tagliacozzo may expect booking flexibility.
- Strict cancellation policies are quite rare (7.7%), potentially making listings with this policy less competitive unless justified by high demand or property type.
Recommendations for Hosts
- Consider adopting a Moderate policy to align with the 65.4% market standard in Tagliacozzo.
- Using a Strict policy might deter some guests, as only 7.7% of listings use it. Evaluate if potential revenue protection outweighs possible lower booking rates.
- Regularly review your cancellation policy against competitors and market demand shifts in Tagliacozzo.
Tagliacozzo STR Booking Lead Time Analysis (2025)
Average Booking Lead Time by Month
Booking Lead Time Insights for Tagliacozzo
- The overall average booking lead time for vacation rentals in Tagliacozzo is 50 days.
- Guests book furthest in advance for stays during July (average 109 days), likely coinciding with peak travel demand or local events.
- The shortest booking windows occur for stays in November (average 0 days), indicating more last-minute travel plans during this time.
- Seasonally, Summer (92 days avg.) sees the longest lead times, while Winter (19 days avg.) has the shortest, reflecting typical travel planning cycles.
Recommendations for Hosts
- Use the overall average lead time (50 days) as a baseline for your pricing and availability strategy in Tagliacozzo.
- For July stays, consider implementing length-of-stay discounts or slightly higher rates for bookings made less than 109 days out to capitalize on advance planning.
- During November, focus on last-minute booking availability and promotions, as guests book with very short notice (0 days avg.).
- Target marketing efforts for the Summer season well in advance (at least 92 days) to capture early planners.
- Monitor your own booking lead times against these Tagliacozzo averages to identify opportunities for dynamic pricing adjustments.
Popular & Essential Airbnb Amenities in Tagliacozzo (2025)
Amenity Prevalence
Amenity Insights for Tagliacozzo
- Essential amenities in Tagliacozzo that guests expect include: Essentials, Kitchen. Lacking these (any) could significantly impact bookings.
- Popular amenities like Heating, TV, Hot water are common but not universal. Offering these can provide a competitive edge.
Recommendations for Hosts
- Ensure your listing includes all essential amenities for Tagliacozzo: Essentials, Kitchen.
- Consider adding popular differentiators like Heating or TV to increase appeal.
- Highlight unique or less common amenities you offer (e.g., hot tub, dedicated workspace, EV charger) in your listing description and photos.
- Regularly check competitor amenities in Tagliacozzo to stay competitive.
Tagliacozzo Airbnb Guest Demographics & Profile Analysis (2025)
Guest Profile Summary for Tagliacozzo
- The typical guest profile for Airbnb in Tagliacozzo consists of primarily domestic travelers (68%), often arriving from nearby Rome, typically belonging to the Post-2000s (Gen Z/Alpha) group (50%), primarily speaking English or Italian.
- Domestic travelers account for 67.9% of guests.
- Key international markets include Italy (67.9%) and United States (17.9%).
- Top languages spoken are English (37.9%) followed by Italian (27.6%).
- A significant demographic segment is the Post-2000s (Gen Z/Alpha) group, representing 50% of guests.
Recommendations for Hosts
- Target domestic marketing efforts towards travelers from Rome and Yachats.
- Tailor amenities and listing descriptions to appeal to the dominant Post-2000s (Gen Z/Alpha) demographic (e.g., highlight fast WiFi, smart home features, local guides).
- Highlight unique local experiences or amenities relevant to the primary guest profile.
- Consider seasonal promotions aligned with peak travel times for key origin markets.
Nearby Short-Term Rental Market Comparison
How does the Tagliacozzo Airbnb market stack up against its neighbors? Compare key performance metrics like average monthly revenue, ADR, and occupancy rates in surrounding areas to understand the broader regional STR landscape.
| Market | Active Properties | Monthly Revenue | Daily Rate | Avg. Occupancy |
|---|---|---|---|---|
| Rome | 23,290 | $2,898 | $208.87 | 51% |
| Collazzone | 28 | $2,839 | $341.11 | 36% |
| Parrano | 18 | $2,762 | $329.95 | 34% |
| Monte Castello di Vibio | 18 | $2,659 | $567.21 | 41% |
| Guardea | 15 | $2,542 | $320.56 | 35% |
| Monteleone d'Orvieto | 31 | $2,537 | $306.96 | 36% |
| Lugnano in Teverina | 19 | $2,238 | $267.38 | 35% |
| Collevecchio | 12 | $2,213 | $302.16 | 38% |
| Lisciano Niccone | 30 | $2,175 | $384.66 | 35% |
| Palombara Sabina | 16 | $2,160 | $336.01 | 35% |