Town of Bassendean Airbnb Market Analysis 2025: Short Term Rental Data & Vacation Rental Statistics in Western Australia, Australia
Is Airbnb profitable in Town of Bassendean in 2025? Explore comprehensive Airbnb analytics for Town of Bassendean, Western Australia, Australia to uncover income potential. This 2025 STR market report for Town of Bassendean, based on AirROI data from April 2024 to March 2025, reveals key trends in the niche market of 27 active listings.
Whether you're considering an Airbnb investment in Town of Bassendean, optimizing your existing vacation rental, or exploring rental arbitrage opportunities, understanding the Town of Bassendean Airbnb data is crucial. Navigating the high regulation landscape is key to maximizing your short term rental income potential. Let's dive into the specifics.
Key Town of Bassendean Airbnb Performance Metrics Overview
Monthly Airbnb Revenue Variations & Income Potential in Town of Bassendean (2025)
Understanding the monthly revenue variations for Airbnb listings in Town of Bassendean is key to maximizing your short term rental income potential. Seasonality significantly impacts earnings. Our analysis, based on data from the past 12 months, shows that the peak revenue month for STRs in Town of Bassendean is typically December, while March often presents the lowest earnings, highlighting opportunities for strategic pricing adjustments during shoulder and low seasons. Explore the typical Airbnb income in Town of Bassendean across different performance tiers:
- Best-in-class properties (Top 10%) achieve $4,322+ monthly, often utilizing dynamic pricing and superior guest experiences.
- Strong performing properties (Top 25%) earn $3,293 or more, indicating effective management and desirable locations/amenities.
- Typical properties (Median) generate around $1,703 per month, representing the average market performance.
- Entry-level properties (Bottom 25%) see earnings around $811, often with potential for optimization.
Average Monthly Airbnb Earnings Trend in Town of Bassendean
Town of Bassendean Airbnb Occupancy Rate Trends (2025)
Maximize your bookings by understanding the Town of Bassendean STR occupancy trends. Seasonal demand shifts significantly influence how often properties are booked. Typically, Februarysees the highest demand (peak season occupancy), while March experiences the lowest (low season). Effective strategies, like adjusting minimum stays or offering promotions, can boost occupancy during slower periods. Here's how different property tiers perform in Town of Bassendean:
- Best-in-class properties (Top 10%) achieve 90%+ occupancy, indicating high desirability and potentially optimized availability.
- Strong performing properties (Top 25%) maintain 80% or higher occupancy, suggesting good market fit and guest satisfaction.
- Typical properties (Median) have an occupancy rate around 62%.
- Entry-level properties (Bottom 25%) average 33% occupancy, potentially facing higher vacancy.
Average Monthly Occupancy Rate Trend in Town of Bassendean
Average Daily Rate (ADR) Airbnb Trends in Town of Bassendean (2025)
Effective short term rental pricing strategy in Town of Bassendean involves understanding monthly ADR fluctuations. The Average Daily Rate (ADR) for Airbnb in Town of Bassendean typically peaks in December and dips lowest during May. Leveraging Airbnb dynamic pricing tools or strategies based on this seasonality can significantly boost revenue. Here's a look at the typical nightly rates achieved:
- Best-in-class properties (Top 10%) command rates of $193+ per night, often due to premium features or locations.
- Strong performing properties (Top 25%) achieve nightly rates of $165 or more.
- Typical properties (Median) charge around $78 per night.
- Entry-level properties (Bottom 25%) earn around $52 per night.
Average Daily Rate (ADR) Trend by Month in Town of Bassendean
Get Live Town of Bassendean Market Intelligence 👇

Explore Real-time Analytics
Airbnb Seasonality Analysis & Trends in Town of Bassendean (2025)
Peak Season (December, October, June)
- Revenue averages $2,414 per month
- Occupancy rates average 61.3%
- Daily rates average $118
Shoulder Season
- Revenue averages $2,122 per month
- Occupancy maintains around 56.9%
- Daily rates hold near $116
Low Season (February, March, August)
- Revenue drops to average $1,879 per month
- Occupancy decreases to average 55.5%
- Daily rates adjust to average $118
Seasonality Insights for Town of Bassendean
- The Airbnb seasonality in Town of Bassendean shows moderate seasonality with distinct peak and low periods. While the sections above show seasonal averages, it's also insightful to look at the extremes:
- During the high season, the absolute peak month showcases Town of Bassendean's highest earning potential, with monthly revenues capable of climbing to $2,643, occupancy reaching a high of 71.4%, and ADRs peaking at $129.
- Conversely, the slowest single month of the year, typically falling within the low season, marks the market's lowest point. In this month, revenue might dip to $1,682, occupancy could drop to 45.0%, and ADRs may adjust down to $110.
- Understanding both the seasonal averages and these monthly peaks and troughs in revenue, occupancy, and ADR is crucial for maximizing your Airbnb profit potential in Town of Bassendean.
Seasonal Strategies for Maximizing Profit
- Peak Season: Maximize revenue through premium pricing and potentially longer minimum stays. Ensure high availability.
- Low Season: Offer competitive pricing, special promotions (e.g., extended stay discounts), and flexible cancellation policies. Target off-season travelers like remote workers or budget-conscious guests.
- Shoulder Seasons: Implement dynamic pricing that balances peak and low rates. Target weekend travelers or specific events. Offer slightly more flexible terms than peak season.
- Regularly analyze your own performance against these Town of Bassendean seasonality benchmarks and adjust your pricing and availability strategy accordingly.
Best Areas for Airbnb Investment in Town of Bassendean (2025)
Exploring the top neighborhoods for short-term rentals in Town of Bassendean? This section highlights key areas, outlining why they are attractive for hosts and guests, along with notable local attractions. Consider these locations based on your target guest profile and investment strategy.
| Neighborhood / Area | Why Host Here? (Target Guests & Appeal) | Key Attractions & Landmarks |
|---|---|---|
| Bassendean Town Centre | The heart of Bassendean, featuring shops, cafes, and easy access to public transport. This area is popular with visitors looking for convenience and a local feel. | Bassendean Railway Station, Local parks, Shopping precinct, Cafes, Restaurants |
| Success Hill | A scenic suburb along the Swan River with beautiful views and parks. Ideal for tourists who enjoy nature and outdoor activities. | Success Hill Park, Swan River, Walking trails, Bird watching opportunities |
| Bassendean Oval | Home to local sports and events, this area attracts families and sports enthusiasts. Great for short stays during local matches or events. | Bassendean Oval, Community sports events, Walking trails |
| Old Perth Road | Historic street lined with charming architecture, offering a mix of entertainment, dining, and boutique shops. Perfect for those looking to explore local culture. | Heritage buildings, Local markets, Cafes, Art galleries |
| Ashfield | Close to Bassendean, Ashfield offers a mix of residential charm and proximity to parks. Ideal for families visiting nearby attractions. | Ashfield Park, Local cafes, Community feel |
| Guildford Road | A convenient route with access to transportation and several eateries. Good for travelers looking for a strategic base. | Restaurants, Shops, Transport access |
| Swan Reserve | A beautiful natural reserve with walking trails and river views. Attracts nature lovers and those looking to relax in a tranquil setting. | Walking trails, Picnic areas, Wildlife watching |
| Cyril Jackson Recreation Centre | A hub for community activities and events, making it a popular choice for families and travelers involved in local events and sports. | Sports facilities, Community events, Parks |
Understanding Airbnb License Requirements & STR Laws in Town of Bassendean (2025)
Yes, Town of Bassendean, Western Australia, Australia enforces high STR regulations. Obtaining a license and ensuring compliance is almost certainly required according to current 2025 STR laws. Always verify the latest short term rental regulations and Airbnb license requirements directly with local government authorities for Town of Bassendean to ensure full compliance before hosting.
(Source: AirROI data, 2025, based on 48% licensed listings)
Top Performing Airbnb Properties in Town of Bassendean (2025)
Benchmark your potential! Explore examples of top-performing Airbnb properties in Town of Bassendeanbased on Trailing Twelve Month (TTM) revenue. Analyze their characteristics, revenue, occupancy rate, and ADR to understand what drives success in this market.

Luxurious Family Home
Entire Place • 4 bedrooms

Revive Spa Retreat
Entire Place • 3 bedrooms
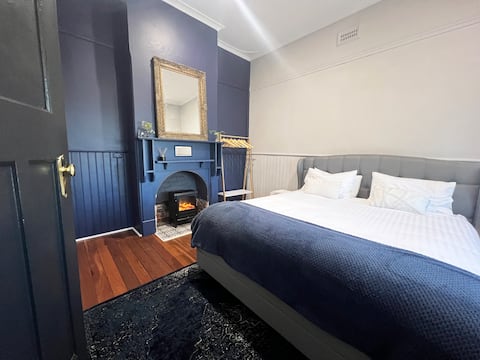
Broadway Cottage Airport/CBD/Train/Wineries Nearby
Entire Place • 3 bedrooms
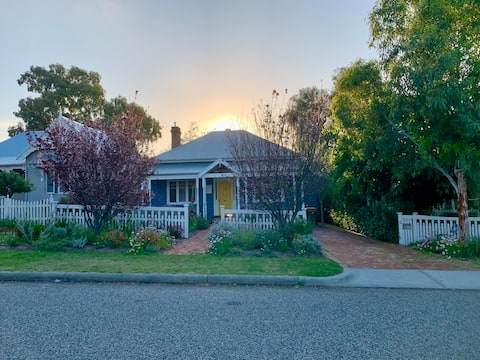
Bassendean Cottage
Entire Place • 3 bedrooms

Urban Oasis Getaway: Light bright and airy
Entire Place • 2 bedrooms
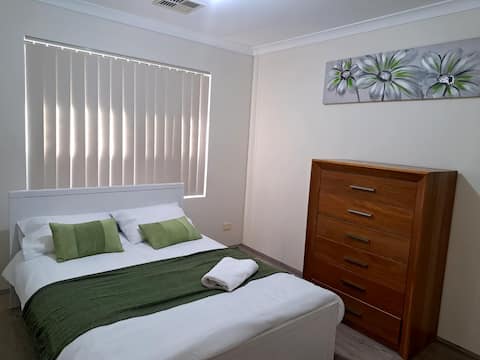
Lovely Cozy and Accessible
Entire Place • 4 bedrooms
Note: Performance varies based on location, size, amenities, seasonality, and management quality. Data reflects the past 12 months.
Top Performing Airbnb Hosts in Town of Bassendean (2025)
Learn from the best! This table showcases top-performing Airbnb hosts in Town of Bassendean based on the number of properties managed and estimated total revenue over the past year. Analyze their scale and performance metrics.
| Host Name | Properties | Grossing Revenue | Stay Reviews | Avg Rating |
|---|---|---|---|---|
| Louise | 4 | $127,460 | 733 | 4.79/5.0 |
| Josephine | 1 | $54,254 | 66 | 5.00/5.0 |
| Ally | 1 | $53,549 | 127 | 4.73/5.0 |
| Cher | 4 | $46,562 | 368 | 4.88/5.0 |
| Tristan | 1 | $41,748 | 60 | 4.78/5.0 |
| Bernadette | 1 | $41,213 | 130 | 4.96/5.0 |
| Vimbayi | 1 | $36,974 | 37 | 4.73/5.0 |
| Rachele Space BnB | 1 | $33,013 | 169 | 4.90/5.0 |
| Carmel | 1 | $28,309 | 97 | 4.73/5.0 |
| Darren | 3 | $22,296 | 41 | 3.26/5.0 |
Analyzing the strategies of top hosts, such as their property selection, pricing, and guest communication, can offer valuable lessons for optimizing your own Airbnb operations in Town of Bassendean.
Dive Deeper: Advanced Town of Bassendean STR Market Data (2025)
Ready to unlock more insights? AirROI provides access to advanced metrics and comprehensive Airbnb data for Town of Bassendean. Explore detailed analytics beyond this report to refine your investment strategy, optimize pricing, and maximize your vacation rental profits.
Explore Advanced MetricsTown of Bassendean Short-Term Rental Market Composition (2025): Property & Room Types
Room Type Distribution
Property Type Distribution
Market Composition Insights for Town of Bassendean
- The Town of Bassendean Airbnb market composition is heavily skewed towards Entire Home/Apt listings, which make up 59.3% of the 27 active rentals. This indicates strong guest preference for privacy and space.
- However, a notable 40.7% share for Private Rooms suggests opportunities for budget-conscious travelers or hosts renting out spare rooms.
- Looking at the property type distribution in Town of Bassendean, House properties are the most common (74.1%), reflecting the local real estate landscape.
- Houses represent a significant 74.1% portion, catering likely to families or larger groups.
- Smaller segments like hotel/boutique (combined 3.7%) offer potential for unique stay experiences.
Town of Bassendean Airbnb Room Capacity Analysis (2025): Bedroom Distribution
Distribution of Listings by Number of Bedrooms
Room Capacity Insights for Town of Bassendean
- The dominant room capacity in Town of Bassendean is 3 bedrooms listings, making up 22.2% of the market. This suggests a strong demand for properties suitable for families or small groups.
- Together, 3 bedrooms and 2 bedrooms properties represent 44.4% of the active Airbnb listings in Town of Bassendean, indicating a high concentration in these sizes.
- A significant 29.6% of listings offer 3+ bedrooms, catering to larger groups and families seeking more space in Town of Bassendean.
Town of Bassendean Vacation Rental Guest Capacity Trends (2025)
Distribution of Listings by Guest Capacity
Guest Capacity Insights for Town of Bassendean
- The most common guest capacity trend in Town of Bassendean vacation rentals is listings accommodating 6 guests (22.2%). This suggests the primary traveler segment is likely larger groups.
- Properties designed for 6 guests and 2 guests dominate the Town of Bassendean STR market, accounting for 37.0% of listings.
- 29.6% of properties accommodate 6+ guests, serving the market segment for larger families or group travel in Town of Bassendean.
- On average, properties in Town of Bassendean are equipped to host 3.0 guests.
Town of Bassendean Airbnb Booking Patterns (2025): Available vs. Booked Days
Available Days Distribution
Booked Days Distribution
Booking Pattern Insights for Town of Bassendean
- The most common availability pattern in Town of Bassendean falls within the 91-180 days range, representing 33.3% of listings. This suggests many properties have significant open periods on their calendars.
- Approximately 44.4% of listings show high availability (181+ days open annually), indicating potential for increased bookings or specific owner usage patterns.
- For booked days, the 181-270 days range is most frequent in Town of Bassendean (33.3%), reflecting common guest stay durations or potential owner blocking patterns.
- A notable 55.5% of properties secure long booking periods (181+ days booked per year), highlighting successful long-term rental strategies or significant owner usage.
Town of Bassendean Airbnb Minimum Stay Requirements Analysis
Distribution of Listings by Minimum Night Requirement
1 Night
2 listings
8.7% of total
2 Nights
5 listings
21.7% of total
3 Nights
5 listings
21.7% of total
4-6 Nights
6 listings
26.1% of total
30+ Nights
5 listings
21.7% of total
Key Insights
- The most prevalent minimum stay requirement in Town of Bassendean is 4-6 Nights, adopted by 26.1% of listings. This highlights the market's preference for longer commitments.
- A significant segment (21.7%) caters to monthly stays (30+ nights) in Town of Bassendean, pointing to opportunities in the extended-stay market.
Recommendations
- Align with the market by considering a 4-6 Nights minimum stay, as 26.1% of Town of Bassendean hosts use this setting.
- If feasible, allowing 1-night stays, especially midweek or during low season, could capture last-minute bookings, as only 8.7% currently do.
- Explore offering discounts for stays of 30+ nights to attract the 21.7% of the market seeking extended stays.
- Adjust minimum nights based on seasonality – potentially shorter during low season and longer during peak demand periods in Town of Bassendean.
Town of Bassendean Airbnb Cancellation Policy Trends Analysis (2025)
Flexible
5 listings
20.8% of total
Moderate
7 listings
29.2% of total
Firm
4 listings
16.7% of total
Strict
8 listings
33.3% of total
Cancellation Policy Insights for Town of Bassendean
- The prevailing Airbnb cancellation policy trend in Town of Bassendean is Strict, used by 33.3% of listings.
- There's a relatively balanced mix between guest-friendly (50.0%) and stricter (50.0%) policies, offering choices for different guest needs.
Recommendations for Hosts
- Consider adopting a Strict policy to align with the 33.3% market standard in Town of Bassendean.
- With 33.3% using Strict terms, this is a viable option in Town of Bassendean, particularly for high-value properties or during peak demand periods.
- Regularly review your cancellation policy against competitors and market demand shifts in Town of Bassendean.
Town of Bassendean STR Booking Lead Time Analysis (2025)
Average Booking Lead Time by Month
Booking Lead Time Insights for Town of Bassendean
- The overall average booking lead time for vacation rentals in Town of Bassendean is 44 days.
- Guests book furthest in advance for stays during March (average 67 days), likely coinciding with peak travel demand or local events.
- The shortest booking windows occur for stays in June (average 28 days), indicating more last-minute travel plans during this time.
- Seasonally, Winter (55 days avg.) sees the longest lead times, while Summer (32 days avg.) has the shortest, reflecting typical travel planning cycles.
Recommendations for Hosts
- Use the overall average lead time (44 days) as a baseline for your pricing and availability strategy in Town of Bassendean.
- For March stays, consider implementing length-of-stay discounts or slightly higher rates for bookings made less than 67 days out to capitalize on advance planning.
- Target marketing efforts for the Winter season well in advance (at least 55 days) to capture early planners.
- Monitor your own booking lead times against these Town of Bassendean averages to identify opportunities for dynamic pricing adjustments.
Popular & Essential Airbnb Amenities in Town of Bassendean (2025)
Amenity Prevalence
Amenity Insights for Town of Bassendean
- Essential amenities in Town of Bassendean that guests expect include: Kitchen, Washer, Air conditioning. Lacking these (any) could significantly impact bookings.
- Popular amenities like Hot water, Smoke alarm, Free parking on premises are common but not universal. Offering these can provide a competitive edge.
- Warning: Wifi is not universally provided but is considered essential globally. Ensure reliable Wifi is offered.
Recommendations for Hosts
- Ensure your listing includes all essential amenities for Town of Bassendean: Kitchen, Washer, Air conditioning.
- Consider adding popular differentiators like Hot water or Smoke alarm to increase appeal.
- Highlight unique or less common amenities you offer (e.g., hot tub, dedicated workspace, EV charger) in your listing description and photos.
- Regularly check competitor amenities in Town of Bassendean to stay competitive.
Town of Bassendean Airbnb Guest Demographics & Profile Analysis (2025)
Guest Profile Summary for Town of Bassendean
- The typical guest profile for Airbnb in Town of Bassendean consists of a mix of domestic (59%) and international guests, often arriving from nearby Perth, typically belonging to the Post-2000s (Gen Z/Alpha) group (50%), primarily speaking English or Chinese.
- Domestic travelers account for 59.4% of guests.
- Key international markets include Australia (59.4%) and Singapore (12.6%).
- Top languages spoken are English (66.5%) followed by Chinese (7.9%).
- A significant demographic segment is the Post-2000s (Gen Z/Alpha) group, representing 50% of guests.
Recommendations for Hosts
- Balance marketing efforts between domestic and international channels based on the guest mix.
- Tailor amenities and listing descriptions to appeal to the dominant Post-2000s (Gen Z/Alpha) demographic (e.g., highlight fast WiFi, smart home features, local guides).
- Highlight unique local experiences or amenities relevant to the primary guest profile.
- Consider seasonal promotions aligned with peak travel times for key origin markets.
Nearby Short-Term Rental Market Comparison
How does the Town of Bassendean Airbnb market stack up against its neighbors? Compare key performance metrics like average monthly revenue, ADR, and occupancy rates in surrounding areas to understand the broader regional STR landscape.
| Market | Active Properties | Monthly Revenue | Daily Rate | Avg. Occupancy |
|---|---|---|---|---|
| Cottesloe | 138 | $4,018 | $230.16 | 66% |
| Swanbourne | 10 | $3,608 | $326.94 | 49% |
| City of Mandurah | 29 | $2,989 | $218.84 | 46% |
| Shire Of Murray | 56 | $2,975 | $222.09 | 47% |
| Mosman Park | 49 | $2,967 | $195.80 | 64% |
| Mandurah | 387 | $2,963 | $241.70 | 48% |
| Dwellingup | 18 | $2,954 | $149.11 | 64% |
| South Fremantle | 74 | $2,896 | $177.02 | 61% |
| Shire Of Toodyay | 17 | $2,868 | $231.11 | 44% |
| North Fremantle | 29 | $2,821 | $189.18 | 62% |