Shire Of Donnybrook-Balingup Airbnb Market Analysis 2025: Short Term Rental Data & Vacation Rental Statistics in Western Australia, Australia
Is Airbnb profitable in Shire Of Donnybrook-Balingup in 2025? Explore comprehensive Airbnb analytics for Shire Of Donnybrook-Balingup, Western Australia, Australia to uncover income potential. This 2025 STR market report for Shire Of Donnybrook-Balingup, based on AirROI data from April 2024 to March 2025, reveals key trends in the niche market of 18 active listings.
Whether you're considering an Airbnb investment in Shire Of Donnybrook-Balingup, optimizing your existing vacation rental, or exploring rental arbitrage opportunities, understanding the Shire Of Donnybrook-Balingup Airbnb data is crucial. Navigating the high regulation landscape is key to maximizing your short term rental income potential. Let's dive into the specifics.
Key Shire Of Donnybrook-Balingup Airbnb Performance Metrics Overview
Monthly Airbnb Revenue Variations & Income Potential in Shire Of Donnybrook-Balingup (2025)
Understanding the monthly revenue variations for Airbnb listings in Shire Of Donnybrook-Balingup is key to maximizing your short term rental income potential. Seasonality significantly impacts earnings. Our analysis, based on data from the past 12 months, shows that the peak revenue month for STRs in Shire Of Donnybrook-Balingup is typically December, while February often presents the lowest earnings, highlighting opportunities for strategic pricing adjustments during shoulder and low seasons. Explore the typical Airbnb income in Shire Of Donnybrook-Balingup across different performance tiers:
- Best-in-class properties (Top 10%) achieve $4,549+ monthly, often utilizing dynamic pricing and superior guest experiences.
- Strong performing properties (Top 25%) earn $3,512 or more, indicating effective management and desirable locations/amenities.
- Typical properties (Median) generate around $2,657 per month, representing the average market performance.
- Entry-level properties (Bottom 25%) see earnings around $1,483, often with potential for optimization.
Average Monthly Airbnb Earnings Trend in Shire Of Donnybrook-Balingup
Shire Of Donnybrook-Balingup Airbnb Occupancy Rate Trends (2025)
Maximize your bookings by understanding the Shire Of Donnybrook-Balingup STR occupancy trends. Seasonal demand shifts significantly influence how often properties are booked. Typically, Julysees the highest demand (peak season occupancy), while February experiences the lowest (low season). Effective strategies, like adjusting minimum stays or offering promotions, can boost occupancy during slower periods. Here's how different property tiers perform in Shire Of Donnybrook-Balingup:
- Best-in-class properties (Top 10%) achieve 90%+ occupancy, indicating high desirability and potentially optimized availability.
- Strong performing properties (Top 25%) maintain 80% or higher occupancy, suggesting good market fit and guest satisfaction.
- Typical properties (Median) have an occupancy rate around 64%.
- Entry-level properties (Bottom 25%) average 29% occupancy, potentially facing higher vacancy.
Average Monthly Occupancy Rate Trend in Shire Of Donnybrook-Balingup
Average Daily Rate (ADR) Airbnb Trends in Shire Of Donnybrook-Balingup (2025)
Effective short term rental pricing strategy in Shire Of Donnybrook-Balingup involves understanding monthly ADR fluctuations. The Average Daily Rate (ADR) for Airbnb in Shire Of Donnybrook-Balingup typically peaks in October and dips lowest during March. Leveraging Airbnb dynamic pricing tools or strategies based on this seasonality can significantly boost revenue. Here's a look at the typical nightly rates achieved:
- Best-in-class properties (Top 10%) command rates of $219+ per night, often due to premium features or locations.
- Strong performing properties (Top 25%) achieve nightly rates of $191 or more.
- Typical properties (Median) charge around $132 per night.
- Entry-level properties (Bottom 25%) earn around $110 per night.
Average Daily Rate (ADR) Trend by Month in Shire Of Donnybrook-Balingup
Get Live Shire Of Donnybrook-Balingup Market Intelligence 👇

Explore Real-time Analytics
Airbnb Seasonality Analysis & Trends in Shire Of Donnybrook-Balingup (2025)
Peak Season (December, July, November)
- Revenue averages $3,420 per month
- Occupancy rates average 69.2%
- Daily rates average $152
Shoulder Season
- Revenue averages $2,695 per month
- Occupancy maintains around 55.1%
- Daily rates hold near $152
Low Season (February, March, August)
- Revenue drops to average $2,098 per month
- Occupancy decreases to average 50.3%
- Daily rates adjust to average $143
Seasonality Insights for Shire Of Donnybrook-Balingup
- The Airbnb seasonality in Shire Of Donnybrook-Balingup shows moderate seasonality with distinct peak and low periods. While the sections above show seasonal averages, it's also insightful to look at the extremes:
- During the high season, the absolute peak month showcases Shire Of Donnybrook-Balingup's highest earning potential, with monthly revenues capable of climbing to $3,552, occupancy reaching a high of 75.5%, and ADRs peaking at $155.
- Conversely, the slowest single month of the year, typically falling within the low season, marks the market's lowest point. In this month, revenue might dip to $1,751, occupancy could drop to 44.2%, and ADRs may adjust down to $138.
- Understanding both the seasonal averages and these monthly peaks and troughs in revenue, occupancy, and ADR is crucial for maximizing your Airbnb profit potential in Shire Of Donnybrook-Balingup.
Seasonal Strategies for Maximizing Profit
- Peak Season: Maximize revenue through premium pricing and potentially longer minimum stays. Ensure high availability.
- Low Season: Offer competitive pricing, special promotions (e.g., extended stay discounts), and flexible cancellation policies. Target off-season travelers like remote workers or budget-conscious guests.
- Shoulder Seasons: Implement dynamic pricing that balances peak and low rates. Target weekend travelers or specific events. Offer slightly more flexible terms than peak season.
- Regularly analyze your own performance against these Shire Of Donnybrook-Balingup seasonality benchmarks and adjust your pricing and availability strategy accordingly.
Best Areas for Airbnb Investment in Shire Of Donnybrook-Balingup (2025)
Exploring the top neighborhoods for short-term rentals in Shire Of Donnybrook-Balingup? This section highlights key areas, outlining why they are attractive for hosts and guests, along with notable local attractions. Consider these locations based on your target guest profile and investment strategy.
| Neighborhood / Area | Why Host Here? (Target Guests & Appeal) | Key Attractions & Landmarks |
|---|---|---|
| Balingup | A picturesque town known for its beautiful landscapes, charming rural settings, and artistic community. Attracts visitors looking for a peaceful retreat and outdoor activities. | Balingup Lavender Farm, Balingup Heritage Trail, Golden Valley Tree Park, Balingup Faerie Park, Balingup Sculpture Park |
| Donnybrook | Famed for its apple orchards and the Donnybrook Apple Festival, this town is a gateway for visitors exploring the nearby Blackwood River Valley and offers a range of attractions for families and nature lovers. | Donnybrook Apple Farm, Blackwood River, Donnybrook Historical Society, Balmoral Reserve, Balingup Golf Club |
| Bridgetown | Known for its heritage buildings and vibrant arts scene, Bridgetown attracts tourists for its festivals and local cultural events, making it a great spot for Airbnb investment. | Bridgetown Gardens, Bridgetown Heritage Walk, Blackwood River Park, Bridgetown Markets, Bridgetown Central Motorcycle Museum |
| Mumballup | A small and quiet locality with beautiful landscapes, perfect for those seeking a serene getaway. The area's natural beauty is its biggest draw, ideal for nature lovers and outdoor enthusiasts. | Mumballup Park, Beelu National Park, Scenic lookouts, Walking trails |
| Greenbushes | Famous for its mineral mining and the beautiful Greenbushes Lake, this town attracts visitors interested in nature and history, enhancing its appeal for vacation rentals. | Greenbushes Discovery Centre, Greenbushes Lake, Historical mine sites, Walking tracks |
| Nannup | Set in a beautiful valley, Nannup is known for its forestry, arts and crafts, and welcoming community events, making it a lovely destination for short-term stays. | Nannup Flower and Garden Festival, Nannup Heritage Walk, Blackwood River, Nannup Music Festival, Cycling and walking trails |
| Boyup Brook | A rural community known for its agricultural shows and country lifestyle, Boyup Brook offers unique experiences for visitors interested in rural tourism. | Boyup Brook Sheep Dog Trials, Boyup Brook Country Music Festival, Boyup Brook Trail, Heritage buildings |
| Collie | A mining town with rich history and numerous outdoor adventures, Collie attracts visitors looking for an active holiday in nature with stunning landscapes and recreational activities. | Eviac Lake, Donnelly River, Collie Art Gallery, Mt. McCabe Lookout, Wellington National Park |
Understanding Airbnb License Requirements & STR Laws in Shire Of Donnybrook-Balingup (2025)
Yes, Shire Of Donnybrook-Balingup, Western Australia, Australia enforces high STR regulations. Obtaining a license and ensuring compliance is almost certainly required according to current 2025 STR laws. Always verify the latest short term rental regulations and Airbnb license requirements directly with local government authorities for Shire Of Donnybrook-Balingup to ensure full compliance before hosting.
(Source: AirROI data, 2025, based on 89% licensed listings)
Top Performing Airbnb Properties in Shire Of Donnybrook-Balingup (2025)
Benchmark your potential! Explore examples of top-performing Airbnb properties in Shire Of Donnybrook-Balingupbased on Trailing Twelve Month (TTM) revenue. Analyze their characteristics, revenue, occupancy rate, and ADR to understand what drives success in this market.
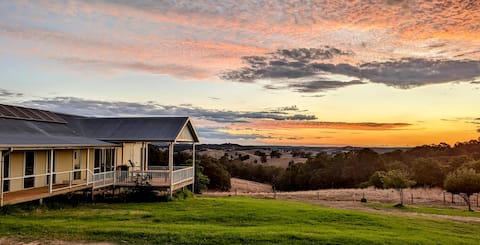
Toonakarta - stunning sunsets
Entire Place • 5 bedrooms

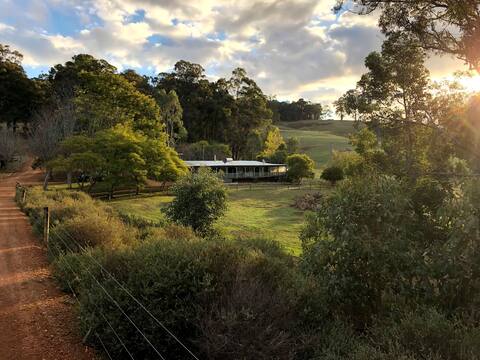
Little Hop House - escape to the valley
Entire Place • 1 bedroom
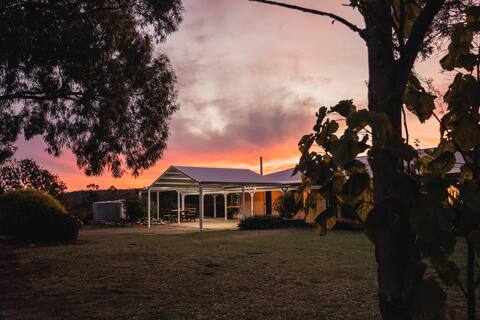
Yonga Valley Retreat
Entire Place • 4 bedrooms
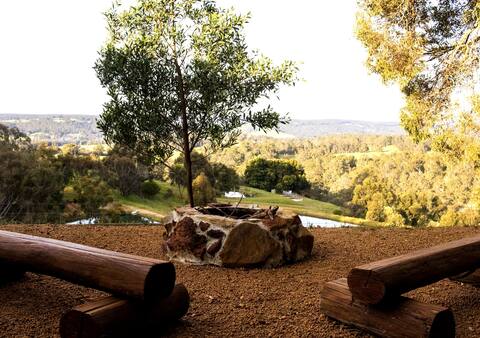
Glen Mervyn Lodge
Entire Place • 4 bedrooms

Preston Valley Country Cabin
Entire Place • 2 bedrooms
Preston Valley Retreat
Entire Place • 1 bedroom
Note: Performance varies based on location, size, amenities, seasonality, and management quality. Data reflects the past 12 months.
Top Performing Airbnb Hosts in Shire Of Donnybrook-Balingup (2025)
Learn from the best! This table showcases top-performing Airbnb hosts in Shire Of Donnybrook-Balingup based on the number of properties managed and estimated total revenue over the past year. Analyze their scale and performance metrics.
| Host Name | Properties | Grossing Revenue | Stay Reviews | Avg Rating |
|---|---|---|---|---|
| Michael | 4 | $126,917 | 403 | 4.75/5.0 |
| Kes | 3 | $119,849 | 491 | 4.99/5.0 |
| Vicki | 2 | $76,451 | 344 | 4.87/5.0 |
| Christopher | 1 | $63,241 | 31 | 4.84/5.0 |
| Frida | 2 | $57,089 | 22 | 5.00/5.0 |
| Alexis | 1 | $53,563 | 245 | 4.99/5.0 |
| Emma & Cam | 1 | $49,448 | 207 | 4.95/5.0 |
| Taz | 2 | $34,445 | 229 | 4.66/5.0 |
| Sandra | 1 | $19,001 | 177 | 4.88/5.0 |
| Peter | 1 | $16,749 | 103 | 5.00/5.0 |
Analyzing the strategies of top hosts, such as their property selection, pricing, and guest communication, can offer valuable lessons for optimizing your own Airbnb operations in Shire Of Donnybrook-Balingup.
Dive Deeper: Advanced Shire Of Donnybrook-Balingup STR Market Data (2025)
Ready to unlock more insights? AirROI provides access to advanced metrics and comprehensive Airbnb data for Shire Of Donnybrook-Balingup. Explore detailed analytics beyond this report to refine your investment strategy, optimize pricing, and maximize your vacation rental profits.
Explore Advanced MetricsShire Of Donnybrook-Balingup Short-Term Rental Market Composition (2025): Property & Room Types
Room Type Distribution
Property Type Distribution
Market Composition Insights for Shire Of Donnybrook-Balingup
- The Shire Of Donnybrook-Balingup Airbnb market composition is heavily skewed towards Entire Home/Apt listings, which make up 100% of the 18 active rentals. This indicates strong guest preference for privacy and space.
- Looking at the property type distribution in Shire Of Donnybrook-Balingup, Outdoor/Unique properties are the most common (83.3%), reflecting the local real estate landscape.
- Houses represent a significant 16.7% portion, catering likely to families or larger groups.
Shire Of Donnybrook-Balingup Airbnb Room Capacity Analysis (2025): Bedroom Distribution
Distribution of Listings by Number of Bedrooms
Room Capacity Insights for Shire Of Donnybrook-Balingup
- The dominant room capacity in Shire Of Donnybrook-Balingup is 1 bedroom listings, making up 50% of the market. This suggests a strong demand for properties suitable for couples or solo travelers.
- Together, 1 bedroom and 2 bedrooms properties represent 83.3% of the active Airbnb listings in Shire Of Donnybrook-Balingup, indicating a high concentration in these sizes.
Shire Of Donnybrook-Balingup Vacation Rental Guest Capacity Trends (2025)
Distribution of Listings by Guest Capacity
Guest Capacity Insights for Shire Of Donnybrook-Balingup
- The most common guest capacity trend in Shire Of Donnybrook-Balingup vacation rentals is listings accommodating 5 guests (27.8%). This suggests the primary traveler segment is likely larger groups.
- Properties designed for 5 guests and 2 guests dominate the Shire Of Donnybrook-Balingup STR market, accounting for 55.6% of listings.
- 22.2% of properties accommodate 6+ guests, serving the market segment for larger families or group travel in Shire Of Donnybrook-Balingup.
- On average, properties in Shire Of Donnybrook-Balingup are equipped to host 4.4 guests.
Shire Of Donnybrook-Balingup Airbnb Booking Patterns (2025): Available vs. Booked Days
Available Days Distribution
Booked Days Distribution
Booking Pattern Insights for Shire Of Donnybrook-Balingup
- The most common availability pattern in Shire Of Donnybrook-Balingup falls within the 31-90 days range, representing 38.9% of listings. This suggests many properties have significant open periods on their calendars.
- Approximately 22.2% of listings show high availability (181+ days open annually), indicating potential for increased bookings or specific owner usage patterns.
- For booked days, the 271-366 days range is most frequent in Shire Of Donnybrook-Balingup (44.4%), reflecting common guest stay durations or potential owner blocking patterns.
- A notable 77.7% of properties secure long booking periods (181+ days booked per year), highlighting successful long-term rental strategies or significant owner usage.
Shire Of Donnybrook-Balingup Airbnb Minimum Stay Requirements Analysis
Distribution of Listings by Minimum Night Requirement
1 Night
7 listings
38.9% of total
2 Nights
5 listings
27.8% of total
7-29 Nights
1 listings
5.6% of total
30+ Nights
5 listings
27.8% of total
Key Insights
- The most prevalent minimum stay requirement in Shire Of Donnybrook-Balingup is 1 Night, adopted by 38.9% of listings. This highlights the market's preference for shorter, flexible bookings.
- A strong majority (66.7%) of the Shire Of Donnybrook-Balingup Airbnb data shows acceptance of very short stays (1-2 nights), indicating a dynamic, high-turnover market.
- A significant segment (27.8%) caters to monthly stays (30+ nights) in Shire Of Donnybrook-Balingup, pointing to opportunities in the extended-stay market.
Recommendations
- Align with the market by considering a 1 Night minimum stay, as 38.9% of Shire Of Donnybrook-Balingup hosts use this setting.
- Explore offering discounts for stays of 30+ nights to attract the 27.8% of the market seeking extended stays.
- Adjust minimum nights based on seasonality – potentially shorter during low season and longer during peak demand periods in Shire Of Donnybrook-Balingup.
Shire Of Donnybrook-Balingup Airbnb Cancellation Policy Trends Analysis (2025)
Flexible
2 listings
11.1% of total
Moderate
3 listings
16.7% of total
Firm
7 listings
38.9% of total
Strict
6 listings
33.3% of total
Cancellation Policy Insights for Shire Of Donnybrook-Balingup
- The prevailing Airbnb cancellation policy trend in Shire Of Donnybrook-Balingup is Firm, used by 38.9% of listings.
- A majority (72.2%) of hosts in Shire Of Donnybrook-Balingup utilize Firm or Strict policies, indicating a market where hosts prioritize booking security.
Recommendations for Hosts
- Consider adopting a Firm policy to align with the 38.9% market standard in Shire Of Donnybrook-Balingup.
- With 33.3% using Strict terms, this is a viable option in Shire Of Donnybrook-Balingup, particularly for high-value properties or during peak demand periods.
- Regularly review your cancellation policy against competitors and market demand shifts in Shire Of Donnybrook-Balingup.
Shire Of Donnybrook-Balingup STR Booking Lead Time Analysis (2025)
Average Booking Lead Time by Month
Booking Lead Time Insights for Shire Of Donnybrook-Balingup
- The overall average booking lead time for vacation rentals in Shire Of Donnybrook-Balingup is 55 days.
- Guests book furthest in advance for stays during August (average 134 days), likely coinciding with peak travel demand or local events.
- The shortest booking windows occur for stays in February (average 39 days), indicating more last-minute travel plans during this time.
- Seasonally, Summer (103 days avg.) sees the longest lead times, while Winter (62 days avg.) has the shortest, reflecting typical travel planning cycles.
Recommendations for Hosts
- Use the overall average lead time (55 days) as a baseline for your pricing and availability strategy in Shire Of Donnybrook-Balingup.
- For August stays, consider implementing length-of-stay discounts or slightly higher rates for bookings made less than 134 days out to capitalize on advance planning.
- Target marketing efforts for the Summer season well in advance (at least 103 days) to capture early planners.
- Monitor your own booking lead times against these Shire Of Donnybrook-Balingup averages to identify opportunities for dynamic pricing adjustments.
Popular & Essential Airbnb Amenities in Shire Of Donnybrook-Balingup (2025)
Amenity Prevalence
No amenities with partial availability (less than 100%) were found to display in the chart. All essential amenities might be present in all listings. Check insights below.
Amenity Insights for Shire Of Donnybrook-Balingup
- Essential amenities in Shire Of Donnybrook-Balingup that guests expect include: Essentials, Bed linens, Refrigerator, Smoke alarm, Hot water, Free parking on premises, Kitchen, TV, Dishes and silverware, Heating. Lacking these (any) could significantly impact bookings.
Recommendations for Hosts
- Ensure your listing includes all essential amenities for Shire Of Donnybrook-Balingup: Essentials, Bed linens, Refrigerator, Smoke alarm, Hot water, Free parking on premises, Kitchen, TV, Dishes and silverware, Heating.
- Highlight unique or less common amenities you offer (e.g., hot tub, dedicated workspace, EV charger) in your listing description and photos.
- Regularly check competitor amenities in Shire Of Donnybrook-Balingup to stay competitive.
Shire Of Donnybrook-Balingup Airbnb Guest Demographics & Profile Analysis (2025)
Guest Profile Summary for Shire Of Donnybrook-Balingup
- The typical guest profile for Airbnb in Shire Of Donnybrook-Balingup consists of primarily domestic travelers (88%), often arriving from nearby Perth, typically belonging to the Post-2000s (Gen Z/Alpha) group (50%), primarily speaking English or Chinese.
- Domestic travelers account for 87.6% of guests.
- Key international markets include Australia (87.6%) and Singapore (6.1%).
- Top languages spoken are English (75.6%) followed by Chinese (7.9%).
- A significant demographic segment is the Post-2000s (Gen Z/Alpha) group, representing 50% of guests.
Recommendations for Hosts
- Target domestic marketing efforts towards travelers from Perth and Western Australia.
- Tailor amenities and listing descriptions to appeal to the dominant Post-2000s (Gen Z/Alpha) demographic (e.g., highlight fast WiFi, smart home features, local guides).
- Highlight unique local experiences or amenities relevant to the primary guest profile.
- Consider seasonal promotions aligned with peak travel times for key origin markets.
Nearby Short-Term Rental Market Comparison
How does the Shire Of Donnybrook-Balingup Airbnb market stack up against its neighbors? Compare key performance metrics like average monthly revenue, ADR, and occupancy rates in surrounding areas to understand the broader regional STR landscape.
| Market | Active Properties | Monthly Revenue | Daily Rate | Avg. Occupancy |
|---|---|---|---|---|
| Gracetown | 34 | $4,562 | $358.38 | 47% |
| Margaret River | 410 | $3,882 | $218.78 | 61% |
| Shire Of Augusta Margaret River | 96 | $3,824 | $252.66 | 56% |
| Gnarabup | 88 | $3,791 | $265.86 | 52% |
| Prevelly | 41 | $3,790 | $238.98 | 57% |
| Dunsborough | 446 | $3,762 | $289.15 | 48% |
| Yallingup | 238 | $3,754 | $334.67 | 46% |
| Witchcliffe | 20 | $3,753 | $304.52 | 56% |
| Peppermint Grove Beach | 35 | $3,750 | $326.50 | 39% |
| City Of Busselton | 535 | $3,637 | $301.10 | 44% |