Shenton Park Airbnb Market Analysis 2025: Short Term Rental Data & Vacation Rental Statistics in Western Australia, Australia
Is Airbnb profitable in Shenton Park in 2025? Explore comprehensive Airbnb analytics for Shenton Park, Western Australia, Australia to uncover income potential. This 2025 STR market report for Shenton Park, based on AirROI data from April 2024 to March 2025, reveals key trends in the niche market of 31 active listings.
Whether you're considering an Airbnb investment in Shenton Park, optimizing your existing vacation rental, or exploring rental arbitrage opportunities, understanding the Shenton Park Airbnb data is crucial. Navigating the high regulation landscape is key to maximizing your short term rental income potential. Let's dive into the specifics.
Key Shenton Park Airbnb Performance Metrics Overview
Monthly Airbnb Revenue Variations & Income Potential in Shenton Park (2025)
Understanding the monthly revenue variations for Airbnb listings in Shenton Park is key to maximizing your short term rental income potential. Seasonality significantly impacts earnings. Our analysis, based on data from the past 12 months, shows that the peak revenue month for STRs in Shenton Park is typically November, while March often presents the lowest earnings, highlighting opportunities for strategic pricing adjustments during shoulder and low seasons. Explore the typical Airbnb income in Shenton Park across different performance tiers:
- Best-in-class properties (Top 10%) achieve $5,203+ monthly, often utilizing dynamic pricing and superior guest experiences.
- Strong performing properties (Top 25%) earn $3,577 or more, indicating effective management and desirable locations/amenities.
- Typical properties (Median) generate around $2,337 per month, representing the average market performance.
- Entry-level properties (Bottom 25%) see earnings around $1,439, often with potential for optimization.
Average Monthly Airbnb Earnings Trend in Shenton Park
Shenton Park Airbnb Occupancy Rate Trends (2025)
Maximize your bookings by understanding the Shenton Park STR occupancy trends. Seasonal demand shifts significantly influence how often properties are booked. Typically, Februarysees the highest demand (peak season occupancy), while June experiences the lowest (low season). Effective strategies, like adjusting minimum stays or offering promotions, can boost occupancy during slower periods. Here's how different property tiers perform in Shenton Park:
- Best-in-class properties (Top 10%) achieve 91%+ occupancy, indicating high desirability and potentially optimized availability.
- Strong performing properties (Top 25%) maintain 85% or higher occupancy, suggesting good market fit and guest satisfaction.
- Typical properties (Median) have an occupancy rate around 69%.
- Entry-level properties (Bottom 25%) average 50% occupancy, potentially facing higher vacancy.
Average Monthly Occupancy Rate Trend in Shenton Park
Average Daily Rate (ADR) Airbnb Trends in Shenton Park (2025)
Effective short term rental pricing strategy in Shenton Park involves understanding monthly ADR fluctuations. The Average Daily Rate (ADR) for Airbnb in Shenton Park typically peaks in December and dips lowest during March. Leveraging Airbnb dynamic pricing tools or strategies based on this seasonality can significantly boost revenue. Here's a look at the typical nightly rates achieved:
- Best-in-class properties (Top 10%) command rates of $220+ per night, often due to premium features or locations.
- Strong performing properties (Top 25%) achieve nightly rates of $164 or more.
- Typical properties (Median) charge around $102 per night.
- Entry-level properties (Bottom 25%) earn around $89 per night.
Average Daily Rate (ADR) Trend by Month in Shenton Park
Get Live Shenton Park Market Intelligence 👇

Explore Real-time Analytics
Airbnb Seasonality Analysis & Trends in Shenton Park (2025)
Peak Season (November, April, December)
- Revenue averages $2,983 per month
- Occupancy rates average 68.4%
- Daily rates average $144
Shoulder Season
- Revenue averages $2,772 per month
- Occupancy maintains around 66.8%
- Daily rates hold near $139
Low Season (March, July, August)
- Revenue drops to average $2,229 per month
- Occupancy decreases to average 57.9%
- Daily rates adjust to average $137
Seasonality Insights for Shenton Park
- The Airbnb seasonality in Shenton Park shows moderate seasonality with distinct peak and low periods. While the sections above show seasonal averages, it's also insightful to look at the extremes:
- During the high season, the absolute peak month showcases Shenton Park's highest earning potential, with monthly revenues capable of climbing to $2,999, occupancy reaching a high of 78.4%, and ADRs peaking at $150.
- Conversely, the slowest single month of the year, typically falling within the low season, marks the market's lowest point. In this month, revenue might dip to $2,062, occupancy could drop to 47.3%, and ADRs may adjust down to $135.
- Understanding both the seasonal averages and these monthly peaks and troughs in revenue, occupancy, and ADR is crucial for maximizing your Airbnb profit potential in Shenton Park.
Seasonal Strategies for Maximizing Profit
- Peak Season: Maximize revenue through premium pricing and potentially longer minimum stays. Ensure high availability.
- Low Season: Offer competitive pricing, special promotions (e.g., extended stay discounts), and flexible cancellation policies. Target off-season travelers like remote workers or budget-conscious guests.
- Shoulder Seasons: Implement dynamic pricing that balances peak and low rates. Target weekend travelers or specific events. Offer slightly more flexible terms than peak season.
- Regularly analyze your own performance against these Shenton Park seasonality benchmarks and adjust your pricing and availability strategy accordingly.
Best Areas for Airbnb Investment in Shenton Park (2025)
Exploring the top neighborhoods for short-term rentals in Shenton Park? This section highlights key areas, outlining why they are attractive for hosts and guests, along with notable local attractions. Consider these locations based on your target guest profile and investment strategy.
| Neighborhood / Area | Why Host Here? (Target Guests & Appeal) | Key Attractions & Landmarks |
|---|---|---|
| Kings Park | One of the world’s largest inner-city parks, offering stunning views of the city and the Swan River. Attracts tourists and locals looking for outdoor experiences, walks, and nature. | Kings Park and Botanic Garden, Botanic Garden, Swan River, War Memorial, Lookout Points |
| Subiaco | A vibrant suburb known for its trendy shops, cafes, and lively atmosphere. It is popular with visitors looking for a neighborhood feel, close to the city but with a unique charm. | Subiaco Oval, Markets, Subiaco Arts Centre, The Pavilion Markets, Restaurants and Cafes |
| Crawley | Located near universities and the beautiful Matilda Bay, Crawley attracts students and families looking for a peaceful yet convenient location close to the river. | Matilda Bay, University of Western Australia, Crawley Edge Boatshed, Swan River, Crawley Park |
| Leederville | A hip and trendy suburb with a mix of boutiques, restaurants, and entertainment options. Great for young professionals and those looking to explore Perth's vibrant nightlife. | Leederville Theatre, Oxford Street, Restaurants and Bars, Boutiques, Lake Monger |
| Mount Lawley | A fashionable neighborhood known for its nightlife, cafes, and artistic vibe. Attracts young travelers and those looking for an urban lifestyle experience. | Beaufort Street, Cafes and Restaurants, Mount Lawley Golf Club, Live Music Venues, Art Galleries |
| Northbridge | The cultural hub of Perth, known for its nightlife, entertainment, and dining scenes. Ideal for those seeking a lively environment and cultural experiences. | Perth Cultural Centre, Art Gallery of WA, Northbridge Piazza, Bars and Nightclubs, Restaurants |
| Fremantle | A historic and vibrant port city offering a unique atmosphere, rich history, and a thriving arts scene. Popular with tourists and locals alike. | Fremantle Markets, Fremantle Prison, Cappuccino Strip, Bathers Beach, Fremantle Fishing Boat Harbour |
| Scarborough | Famous for its stunning beach, surfing culture, and relaxed vibe. An ideal location for tourists looking for a beachfront experience and outdoor activities. | Scarborough Beach, The Beach Pool, Restaurants along the coast, Surfing Hotspots, Beachfront Parks |
Understanding Airbnb License Requirements & STR Laws in Shenton Park (2025)
Yes, Shenton Park, Western Australia, Australia enforces high STR regulations. Obtaining a license and ensuring compliance is almost certainly required according to current 2025 STR laws. Always verify the latest short term rental regulations and Airbnb license requirements directly with local government authorities for Shenton Park to ensure full compliance before hosting.
(Source: AirROI data, 2025, based on 65% licensed listings)
Top Performing Airbnb Properties in Shenton Park (2025)
Benchmark your potential! Explore examples of top-performing Airbnb properties in Shenton Parkbased on Trailing Twelve Month (TTM) revenue. Analyze their characteristics, revenue, occupancy rate, and ADR to understand what drives success in this market.

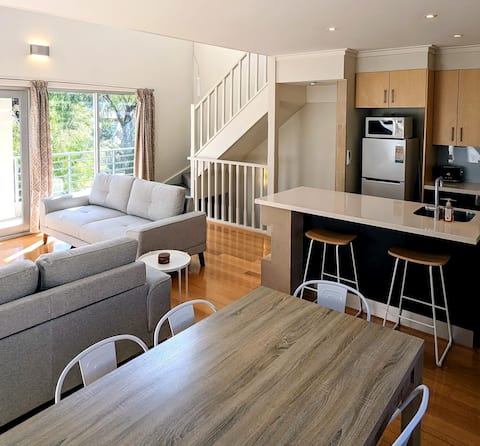
Fantastic Townhouse with 2 Car Parking Spaces
Entire Place • 3 bedrooms
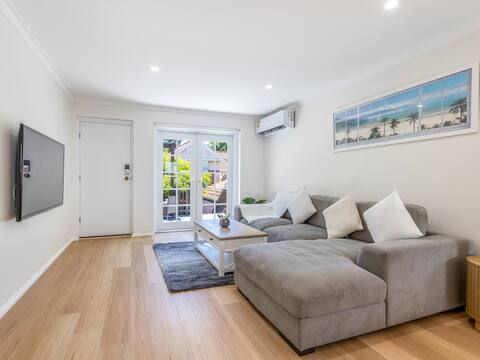
Bright & Conveniently Located Townhouse
Entire Place • 3 bedrooms
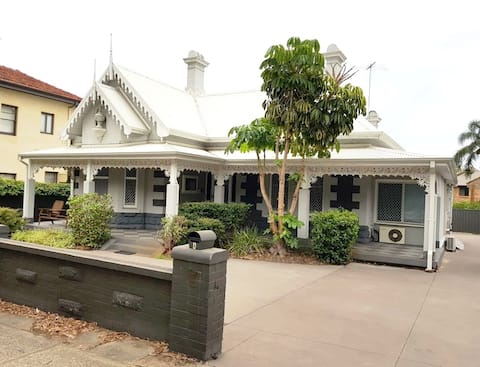
Subiaco Heritage House "Gem"!
Entire Place • 2 bedrooms
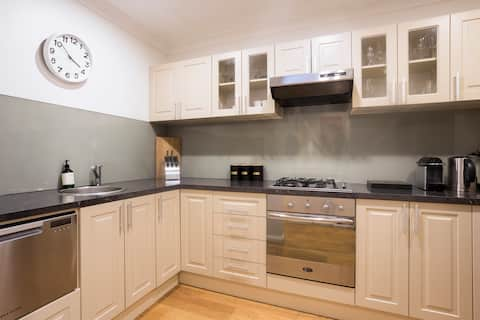
Beautiful Villa - Great Location, Patio, Parking
Entire Place • 2 bedrooms
Leafy haven over King's Park
Entire Place • 2 bedrooms
Shenton Park Retreat with Pool & Car Bay
Entire Place • 1 bedroom
Note: Performance varies based on location, size, amenities, seasonality, and management quality. Data reflects the past 12 months.
Top Performing Airbnb Hosts in Shenton Park (2025)
Learn from the best! This table showcases top-performing Airbnb hosts in Shenton Park based on the number of properties managed and estimated total revenue over the past year. Analyze their scale and performance metrics.
| Host Name | Properties | Grossing Revenue | Stay Reviews | Avg Rating |
|---|---|---|---|---|
| Marian | 2 | $136,746 | 125 | 4.91/5.0 |
| SBStays | 2 | $93,573 | 27 | 4.92/5.0 |
| Annabelle | 8 | $92,486 | 198 | 4.72/5.0 |
| Sharon | 3 | $65,632 | 176 | 4.70/5.0 |
| Menno | 2 | $58,765 | 132 | 4.77/5.0 |
| Sandi | 1 | $55,561 | 124 | 4.56/5.0 |
| Chloe | 1 | $55,244 | 113 | 4.91/5.0 |
| Mathieu | 3 | $36,182 | 26 | 4.88/5.0 |
| Anna | 1 | $31,727 | 214 | 4.77/5.0 |
| Short Stay WA - Jane Cresswell | 1 | $30,564 | 11 | 4.91/5.0 |
Analyzing the strategies of top hosts, such as their property selection, pricing, and guest communication, can offer valuable lessons for optimizing your own Airbnb operations in Shenton Park.
Dive Deeper: Advanced Shenton Park STR Market Data (2025)
Ready to unlock more insights? AirROI provides access to advanced metrics and comprehensive Airbnb data for Shenton Park. Explore detailed analytics beyond this report to refine your investment strategy, optimize pricing, and maximize your vacation rental profits.
Explore Advanced MetricsShenton Park Short-Term Rental Market Composition (2025): Property & Room Types
Room Type Distribution
Property Type Distribution
Market Composition Insights for Shenton Park
- The Shenton Park Airbnb market composition is heavily skewed towards Entire Home/Apt listings, which make up 83.9% of the 31 active rentals. This indicates strong guest preference for privacy and space.
- Looking at the property type distribution in Shenton Park, Apartment/Condo properties are the most common (58.1%), reflecting the local real estate landscape.
- Houses represent a significant 38.7% portion, catering likely to families or larger groups.
- Smaller segments like hotel/boutique (combined 3.2%) offer potential for unique stay experiences.
Shenton Park Airbnb Room Capacity Analysis (2025): Bedroom Distribution
Distribution of Listings by Number of Bedrooms
Room Capacity Insights for Shenton Park
- The dominant room capacity in Shenton Park is 1 bedroom listings, making up 58.1% of the market. This suggests a strong demand for properties suitable for couples or solo travelers.
- Together, 1 bedroom and 2 bedrooms properties represent 77.5% of the active Airbnb listings in Shenton Park, indicating a high concentration in these sizes.
- With over half the market (58.1%) consisting of studios or 1-bedroom units, Shenton Park is particularly well-suited for individuals or couples.
- Listings with 3+ bedrooms (9.7%) represent a smaller niche, potentially indicating an underserved market for larger group accommodations in Shenton Park.
Shenton Park Vacation Rental Guest Capacity Trends (2025)
Distribution of Listings by Guest Capacity
Guest Capacity Insights for Shenton Park
- The most common guest capacity trend in Shenton Park vacation rentals is listings accommodating 2 guests (54.8%). This suggests the primary traveler segment is likely couples or solo travelers.
- Properties designed for 2 guests and 4 guests dominate the Shenton Park STR market, accounting for 67.7% of listings.
- A significant 54.8% of listings cater specifically to 1-2 guests, highlighting strong demand from couples and solo travelers in Shenton Park.
- 12.9% of properties accommodate 6+ guests, serving the market segment for larger families or group travel in Shenton Park.
- On average, properties in Shenton Park are equipped to host 2.6 guests.
Shenton Park Airbnb Booking Patterns (2025): Available vs. Booked Days
Available Days Distribution
Booked Days Distribution
Booking Pattern Insights for Shenton Park
- The most common availability pattern in Shenton Park falls within the 91-180 days range, representing 35.5% of listings. This suggests many properties have significant open periods on their calendars.
- Approximately 38.7% of listings show high availability (181+ days open annually), indicating potential for increased bookings or specific owner usage patterns.
- For booked days, the 181-270 days range is most frequent in Shenton Park (35.5%), reflecting common guest stay durations or potential owner blocking patterns.
- A notable 61.3% of properties secure long booking periods (181+ days booked per year), highlighting successful long-term rental strategies or significant owner usage.
Shenton Park Airbnb Minimum Stay Requirements Analysis
Distribution of Listings by Minimum Night Requirement
1 Night
1 listings
3.7% of total
2 Nights
2 listings
7.4% of total
3 Nights
7 listings
25.9% of total
4-6 Nights
4 listings
14.8% of total
7-29 Nights
7 listings
25.9% of total
30+ Nights
6 listings
22.2% of total
Key Insights
- The most prevalent minimum stay requirement in Shenton Park is 3 Nights, adopted by 25.9% of listings. This highlights the market's preference for longer commitments.
- Very short stays (1-2 nights) are less common (11.1%), suggesting hosts prefer slightly longer bookings to optimize turnover.
- A significant segment (22.2%) caters to monthly stays (30+ nights) in Shenton Park, pointing to opportunities in the extended-stay market.
Recommendations
- Align with the market by considering a 3 Nights minimum stay, as 25.9% of Shenton Park hosts use this setting.
- If feasible, allowing 1-night stays, especially midweek or during low season, could capture last-minute bookings, as only 3.7% currently do.
- Explore offering discounts for stays of 30+ nights to attract the 22.2% of the market seeking extended stays.
- Adjust minimum nights based on seasonality – potentially shorter during low season and longer during peak demand periods in Shenton Park.
Shenton Park Airbnb Cancellation Policy Trends Analysis (2025)
Flexible
2 listings
6.9% of total
Moderate
11 listings
37.9% of total
Firm
3 listings
10.3% of total
Strict
13 listings
44.8% of total
Cancellation Policy Insights for Shenton Park
- The prevailing Airbnb cancellation policy trend in Shenton Park is Strict, used by 44.8% of listings.
- A majority (55.1%) of hosts in Shenton Park utilize Firm or Strict policies, indicating a market where hosts prioritize booking security.
Recommendations for Hosts
- Consider adopting a Strict policy to align with the 44.8% market standard in Shenton Park.
- With 44.8% using Strict terms, this is a viable option in Shenton Park, particularly for high-value properties or during peak demand periods.
- Regularly review your cancellation policy against competitors and market demand shifts in Shenton Park.
Shenton Park STR Booking Lead Time Analysis (2025)
Average Booking Lead Time by Month
Booking Lead Time Insights for Shenton Park
- The overall average booking lead time for vacation rentals in Shenton Park is 56 days.
- Guests book furthest in advance for stays during October (average 79 days), likely coinciding with peak travel demand or local events.
- The shortest booking windows occur for stays in August (average 33 days), indicating more last-minute travel plans during this time.
- Seasonally, Fall (68 days avg.) sees the longest lead times, while Summer (49 days avg.) has the shortest, reflecting typical travel planning cycles.
Recommendations for Hosts
- Use the overall average lead time (56 days) as a baseline for your pricing and availability strategy in Shenton Park.
- For October stays, consider implementing length-of-stay discounts or slightly higher rates for bookings made less than 79 days out to capitalize on advance planning.
- Target marketing efforts for the Fall season well in advance (at least 68 days) to capture early planners.
- Monitor your own booking lead times against these Shenton Park averages to identify opportunities for dynamic pricing adjustments.
Popular & Essential Airbnb Amenities in Shenton Park (2025)
Amenity Prevalence
Amenity Insights for Shenton Park
- Essential amenities in Shenton Park that guests expect include: Hot water, TV, Hangers, Smoke alarm, Wifi. Lacking these (any) could significantly impact bookings.
- Popular amenities like Kitchen, Washer, Essentials are common but not universal. Offering these can provide a competitive edge.
Recommendations for Hosts
- Ensure your listing includes all essential amenities for Shenton Park: Hot water, TV, Hangers, Smoke alarm, Wifi.
- Prioritize adding missing essentials: Hangers, Smoke alarm, Wifi.
- Consider adding popular differentiators like Kitchen or Washer to increase appeal.
- Highlight unique or less common amenities you offer (e.g., hot tub, dedicated workspace, EV charger) in your listing description and photos.
- Regularly check competitor amenities in Shenton Park to stay competitive.
Shenton Park Airbnb Guest Demographics & Profile Analysis (2025)
Guest Profile Summary for Shenton Park
- The typical guest profile for Airbnb in Shenton Park consists of a mix of domestic (63%) and international guests, often arriving from nearby Perth, typically belonging to the Post-2000s (Gen Z/Alpha) group (50%), primarily speaking English or Chinese.
- Domestic travelers account for 63.4% of guests.
- Key international markets include Australia (63.4%) and Singapore (11.2%).
- Top languages spoken are English (61.9%) followed by Chinese (7.5%).
- A significant demographic segment is the Post-2000s (Gen Z/Alpha) group, representing 50% of guests.
Recommendations for Hosts
- Target domestic marketing efforts towards travelers from Perth and Melbourne.
- Tailor amenities and listing descriptions to appeal to the dominant Post-2000s (Gen Z/Alpha) demographic (e.g., highlight fast WiFi, smart home features, local guides).
- Highlight unique local experiences or amenities relevant to the primary guest profile.
- Consider seasonal promotions aligned with peak travel times for key origin markets.
Nearby Short-Term Rental Market Comparison
How does the Shenton Park Airbnb market stack up against its neighbors? Compare key performance metrics like average monthly revenue, ADR, and occupancy rates in surrounding areas to understand the broader regional STR landscape.
| Market | Active Properties | Monthly Revenue | Daily Rate | Avg. Occupancy |
|---|---|---|---|---|
| Cottesloe | 138 | $4,018 | $230.16 | 66% |
| Swanbourne | 10 | $3,608 | $326.95 | 49% |
| City of Mandurah | 29 | $2,989 | $218.84 | 46% |
| Shire Of Murray | 56 | $2,975 | $222.09 | 47% |
| Mosman Park | 49 | $2,967 | $195.80 | 64% |
| Mandurah | 387 | $2,963 | $241.70 | 48% |
| Dwellingup | 18 | $2,954 | $149.11 | 64% |
| South Fremantle | 74 | $2,896 | $177.02 | 61% |
| Shire Of Toodyay | 17 | $2,868 | $231.11 | 44% |
| North Fremantle | 29 | $2,821 | $189.18 | 62% |