Rockingham Airbnb Market Analysis 2025: Short Term Rental Data & Vacation Rental Statistics in Western Australia, Australia
Is Airbnb profitable in Rockingham in 2025? Explore comprehensive Airbnb analytics for Rockingham, Western Australia, Australia to uncover income potential. This 2025 STR market report for Rockingham, based on AirROI data from April 2024 to March 2025, reveals key trends in the niche market of 62 active listings.
Whether you're considering an Airbnb investment in Rockingham, optimizing your existing vacation rental, or exploring rental arbitrage opportunities, understanding the Rockingham Airbnb data is crucial. Navigating the high regulation landscape is key to maximizing your short term rental income potential. Let's dive into the specifics.
Key Rockingham Airbnb Performance Metrics Overview
Monthly Airbnb Revenue Variations & Income Potential in Rockingham (2025)
Understanding the monthly revenue variations for Airbnb listings in Rockingham is key to maximizing your short term rental income potential. Seasonality significantly impacts earnings. Our analysis, based on data from the past 12 months, shows that the peak revenue month for STRs in Rockingham is typically December, while March often presents the lowest earnings, highlighting opportunities for strategic pricing adjustments during shoulder and low seasons. Explore the typical Airbnb income in Rockingham across different performance tiers:
- Best-in-class properties (Top 10%) achieve $5,272+ monthly, often utilizing dynamic pricing and superior guest experiences.
- Strong performing properties (Top 25%) earn $3,443 or more, indicating effective management and desirable locations/amenities.
- Typical properties (Median) generate around $2,400 per month, representing the average market performance.
- Entry-level properties (Bottom 25%) see earnings around $1,306, often with potential for optimization.
Average Monthly Airbnb Earnings Trend in Rockingham
Rockingham Airbnb Occupancy Rate Trends (2025)
Maximize your bookings by understanding the Rockingham STR occupancy trends. Seasonal demand shifts significantly influence how often properties are booked. Typically, Aprilsees the highest demand (peak season occupancy), while March experiences the lowest (low season). Effective strategies, like adjusting minimum stays or offering promotions, can boost occupancy during slower periods. Here's how different property tiers perform in Rockingham:
- Best-in-class properties (Top 10%) achieve 91%+ occupancy, indicating high desirability and potentially optimized availability.
- Strong performing properties (Top 25%) maintain 81% or higher occupancy, suggesting good market fit and guest satisfaction.
- Typical properties (Median) have an occupancy rate around 57%.
- Entry-level properties (Bottom 25%) average 26% occupancy, potentially facing higher vacancy.
Average Monthly Occupancy Rate Trend in Rockingham
Average Daily Rate (ADR) Airbnb Trends in Rockingham (2025)
Effective short term rental pricing strategy in Rockingham involves understanding monthly ADR fluctuations. The Average Daily Rate (ADR) for Airbnb in Rockingham typically peaks in December and dips lowest during August. Leveraging Airbnb dynamic pricing tools or strategies based on this seasonality can significantly boost revenue. Here's a look at the typical nightly rates achieved:
- Best-in-class properties (Top 10%) command rates of $264+ per night, often due to premium features or locations.
- Strong performing properties (Top 25%) achieve nightly rates of $181 or more.
- Typical properties (Median) charge around $129 per night.
- Entry-level properties (Bottom 25%) earn around $97 per night.
Average Daily Rate (ADR) Trend by Month in Rockingham
Get Live Rockingham Market Intelligence 👇

Explore Real-time Analytics
Airbnb Seasonality Analysis & Trends in Rockingham (2025)
Peak Season (December, January, April)
- Revenue averages $3,311 per month
- Occupancy rates average 58.5%
- Daily rates average $161
Shoulder Season
- Revenue averages $2,738 per month
- Occupancy maintains around 52.9%
- Daily rates hold near $147
Low Season (February, March, July)
- Revenue drops to average $2,306 per month
- Occupancy decreases to average 51.2%
- Daily rates adjust to average $153
Seasonality Insights for Rockingham
- The Airbnb seasonality in Rockingham shows moderate seasonality with distinct peak and low periods. While the sections above show seasonal averages, it's also insightful to look at the extremes:
- During the high season, the absolute peak month showcases Rockingham's highest earning potential, with monthly revenues capable of climbing to $3,459, occupancy reaching a high of 61.6%, and ADRs peaking at $171.
- Conversely, the slowest single month of the year, typically falling within the low season, marks the market's lowest point. In this month, revenue might dip to $2,041, occupancy could drop to 42.6%, and ADRs may adjust down to $142.
- Understanding both the seasonal averages and these monthly peaks and troughs in revenue, occupancy, and ADR is crucial for maximizing your Airbnb profit potential in Rockingham.
Seasonal Strategies for Maximizing Profit
- Peak Season: Maximize revenue through premium pricing and potentially longer minimum stays. Ensure high availability.
- Low Season: Offer competitive pricing, special promotions (e.g., extended stay discounts), and flexible cancellation policies. Target off-season travelers like remote workers or budget-conscious guests.
- Shoulder Seasons: Implement dynamic pricing that balances peak and low rates. Target weekend travelers or specific events. Offer slightly more flexible terms than peak season.
- Regularly analyze your own performance against these Rockingham seasonality benchmarks and adjust your pricing and availability strategy accordingly.
Best Areas for Airbnb Investment in Rockingham (2025)
Exploring the top neighborhoods for short-term rentals in Rockingham? This section highlights key areas, outlining why they are attractive for hosts and guests, along with notable local attractions. Consider these locations based on your target guest profile and investment strategy.
| Neighborhood / Area | Why Host Here? (Target Guests & Appeal) | Key Attractions & Landmarks |
|---|---|---|
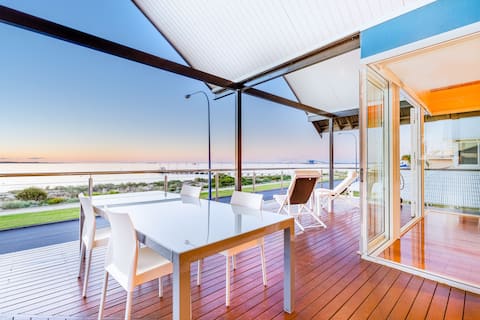
| Rockingham Foreshore | A beautiful coastal area famous for its stunning beaches, parks, and proximity to cafes and restaurants. Perfect for families and tourists looking for a seaside holiday experience. | Rockingham Beach, Penguin Island, Point Peron, The Foreshore Park, Café strip |
| Safety Bay | A quiet suburb known for its stunning beaches and family-friendly atmosphere. Great for water sports enthusiasts and families looking for a peaceful getaway. | Safety Bay Beach, Palm Beach, Lake Richmond, Water sports facilities |
| Warnbro | A suburban area with easy access to the beach and local amenities. Suitable for families and groups seeking a relaxed environment. | Warnbro Beach, Caution: Swimming Area, Local parks |
| Baldivis | A rapidly growing area with access to nature reserves and parks. Attractive for families and those looking for larger accommodations. | Baldivis Nature Reserve, The Living Stream, Local shopping centres |
| Rockingham City Centre | The vibrant central hub with shopping, dining, and entertainment options. Ideal for urban explorers and those seeking convenience. | Rockingham Shopping Centre, Local markets, Dining outlets, Entertainment venues |
| Port Kennedy | A beachfront suburb that offers a relaxed holiday vibe. Popular with visitors looking for beachfront accommodations and easy access to local attractions. | Port Kennedy Beach, Thompson's Lake, Golf courses |
| Kwinana | An emerging suburb with access to parks and outdoor activities. Excellent for budget-conscious travelers looking for proximity to Perth. | Kwinana Adventure Park, Local nature parks, Kwinana Marketplace |
| Hillman | A quiet inner suburb with a local vibe. Good for travelers looking for affordable options while still being close to larger attractions. | Local parks, Community services, Quick access to Rockingham and beyond |
Understanding Airbnb License Requirements & STR Laws in Rockingham (2025)
Yes, Rockingham, Western Australia, Australia enforces high STR regulations. Obtaining a license and ensuring compliance is almost certainly required according to current 2025 STR laws. Always verify the latest short term rental regulations and Airbnb license requirements directly with local government authorities for Rockingham to ensure full compliance before hosting.
(Source: AirROI data, 2025, based on 65% licensed listings)
Top Performing Airbnb Properties in Rockingham (2025)
Benchmark your potential! Explore examples of top-performing Airbnb properties in Rockinghambased on Trailing Twelve Month (TTM) revenue. Analyze their characteristics, revenue, occupancy rate, and ADR to understand what drives success in this market.
Bluehaven Beach Retreat - Beachfront Luxury
Entire Place • 7 bedrooms
Beach House, Lake House with Farm Style Garden
Entire Place • 5 bedrooms

Beachfront Luxury - Seagull (First Floor Condo)
Entire Place • 4 bedrooms
Island View Beach House - Premium Beach Front
Entire Place • 4 bedrooms

Holiday Home with Swimming Pool in Rockingham
Entire Place • 5 bedrooms

Beachfront Luxury - Starfish (Ground level Condo)
Entire Place • 3 bedrooms
Note: Performance varies based on location, size, amenities, seasonality, and management quality. Data reflects the past 12 months.
Top Performing Airbnb Hosts in Rockingham (2025)
Learn from the best! This table showcases top-performing Airbnb hosts in Rockingham based on the number of properties managed and estimated total revenue over the past year. Analyze their scale and performance metrics.
| Host Name | Properties | Grossing Revenue | Stay Reviews | Avg Rating |
|---|---|---|---|---|
| Tony | 3 | $262,195 | 191 | 4.95/5.0 |
| Karen | 1 | $68,991 | 113 | 4.96/5.0 |
| ChanTha | 2 | $68,131 | 140 | 4.83/5.0 |
| Ronnie | 1 | $66,050 | 98 | 4.77/5.0 |
| Chenfei | 1 | $64,127 | 16 | 4.69/5.0 |
| Natasha | 1 | $59,424 | 12 | 4.92/5.0 |
| Lisa-Marie | 1 | $40,873 | 50 | 4.84/5.0 |
| Marcella | 1 | $40,505 | 17 | 4.88/5.0 |
| Maria | 1 | $39,813 | 140 | 4.77/5.0 |
| Samuel | 3 | $39,684 | 92 | 4.74/5.0 |
Analyzing the strategies of top hosts, such as their property selection, pricing, and guest communication, can offer valuable lessons for optimizing your own Airbnb operations in Rockingham.
Dive Deeper: Advanced Rockingham STR Market Data (2025)
Ready to unlock more insights? AirROI provides access to advanced metrics and comprehensive Airbnb data for Rockingham. Explore detailed analytics beyond this report to refine your investment strategy, optimize pricing, and maximize your vacation rental profits.
Explore Advanced MetricsRockingham Short-Term Rental Market Composition (2025): Property & Room Types
Room Type Distribution
Property Type Distribution
Market Composition Insights for Rockingham
- The Rockingham Airbnb market composition is heavily skewed towards Entire Home/Apt listings, which make up 91.9% of the 62 active rentals. This indicates strong guest preference for privacy and space.
- Looking at the property type distribution in Rockingham, House properties are the most common (50%), reflecting the local real estate landscape.
- Houses represent a significant 50% portion, catering likely to families or larger groups.
- The presence of 6.5% Hotel/Boutique listings indicates integration with traditional hospitality.
- Smaller segments like others (combined 1.6%) offer potential for unique stay experiences.
Rockingham Airbnb Room Capacity Analysis (2025): Bedroom Distribution
Distribution of Listings by Number of Bedrooms
Room Capacity Insights for Rockingham
- The dominant room capacity in Rockingham is 2 bedrooms listings, making up 32.3% of the market. This suggests a strong demand for properties suitable for couples or solo travelers.
- Together, 2 bedrooms and 3 bedrooms properties represent 58.1% of the active Airbnb listings in Rockingham, indicating a high concentration in these sizes.
- A significant 43.5% of listings offer 3+ bedrooms, catering to larger groups and families seeking more space in Rockingham.
Rockingham Vacation Rental Guest Capacity Trends (2025)
Distribution of Listings by Guest Capacity
Guest Capacity Insights for Rockingham
- The most common guest capacity trend in Rockingham vacation rentals is listings accommodating 4 guests (24.2%). This suggests the primary traveler segment is likely small families or groups.
- Properties designed for 4 guests and 6 guests dominate the Rockingham STR market, accounting for 45.2% of listings.
- 38.7% of properties accommodate 6+ guests, serving the market segment for larger families or group travel in Rockingham.
- On average, properties in Rockingham are equipped to host 4.7 guests.
Rockingham Airbnb Booking Patterns (2025): Available vs. Booked Days
Available Days Distribution
Booked Days Distribution
Booking Pattern Insights for Rockingham
- The most common availability pattern in Rockingham falls within the 271-366 days range, representing 32.3% of listings. This suggests many properties have significant open periods on their calendars.
- Approximately 51.7% of listings show high availability (181+ days open annually), indicating potential for increased bookings or specific owner usage patterns.
- For booked days, the 181-270 days range is most frequent in Rockingham (27.4%), reflecting common guest stay durations or potential owner blocking patterns.
- A notable 48.4% of properties secure long booking periods (181+ days booked per year), highlighting successful long-term rental strategies or significant owner usage.
Rockingham Airbnb Minimum Stay Requirements Analysis
Distribution of Listings by Minimum Night Requirement
1 Night
3 listings
5.6% of total
2 Nights
15 listings
27.8% of total
3 Nights
5 listings
9.3% of total
4-6 Nights
9 listings
16.7% of total
7-29 Nights
7 listings
13% of total
30+ Nights
15 listings
27.8% of total
Key Insights
- The most prevalent minimum stay requirement in Rockingham is 2 Nights, adopted by 27.8% of listings. This highlights the market's preference for shorter, flexible bookings.
- A significant segment (27.8%) caters to monthly stays (30+ nights) in Rockingham, pointing to opportunities in the extended-stay market.
Recommendations
- Align with the market by considering a 2 Nights minimum stay, as 27.8% of Rockingham hosts use this setting.
- If feasible, allowing 1-night stays, especially midweek or during low season, could capture last-minute bookings, as only 5.6% currently do.
- Explore offering discounts for stays of 30+ nights to attract the 27.8% of the market seeking extended stays.
- Adjust minimum nights based on seasonality – potentially shorter during low season and longer during peak demand periods in Rockingham.
Rockingham Airbnb Cancellation Policy Trends Analysis (2025)
Flexible
13 listings
23.6% of total
Moderate
13 listings
23.6% of total
Firm
16 listings
29.1% of total
Strict
13 listings
23.6% of total
Cancellation Policy Insights for Rockingham
- The prevailing Airbnb cancellation policy trend in Rockingham is Firm, used by 29.1% of listings.
- A majority (52.7%) of hosts in Rockingham utilize Firm or Strict policies, indicating a market where hosts prioritize booking security.
Recommendations for Hosts
- Consider adopting a Firm policy to align with the 29.1% market standard in Rockingham.
- Regularly review your cancellation policy against competitors and market demand shifts in Rockingham.
Rockingham STR Booking Lead Time Analysis (2025)
Average Booking Lead Time by Month
Booking Lead Time Insights for Rockingham
- The overall average booking lead time for vacation rentals in Rockingham is 70 days.
- Guests book furthest in advance for stays during December (average 97 days), likely coinciding with peak travel demand or local events.
- The shortest booking windows occur for stays in August (average 47 days), indicating more last-minute travel plans during this time.
- Seasonally, Winter (92 days avg.) sees the longest lead times, while Summer (51 days avg.) has the shortest, reflecting typical travel planning cycles.
Recommendations for Hosts
- Use the overall average lead time (70 days) as a baseline for your pricing and availability strategy in Rockingham.
- For December stays, consider implementing length-of-stay discounts or slightly higher rates for bookings made less than 97 days out to capitalize on advance planning.
- Target marketing efforts for the Winter season well in advance (at least 92 days) to capture early planners.
- Monitor your own booking lead times against these Rockingham averages to identify opportunities for dynamic pricing adjustments.
Popular & Essential Airbnb Amenities in Rockingham (2025)
Amenity Prevalence
Amenity Insights for Rockingham
- Essential amenities in Rockingham that guests expect include: TV, Air conditioning, Kitchen, Heating, Wifi, Smoke alarm. Lacking these (any) could significantly impact bookings.
- Popular amenities like Free parking on premises, Washer, Dishes and silverware are common but not universal. Offering these can provide a competitive edge.
Recommendations for Hosts
- Ensure your listing includes all essential amenities for Rockingham: TV, Air conditioning, Kitchen, Heating, Wifi, Smoke alarm.
- Prioritize adding missing essentials: Air conditioning, Kitchen, Heating, Wifi, Smoke alarm.
- Consider adding popular differentiators like Free parking on premises or Washer to increase appeal.
- Highlight unique or less common amenities you offer (e.g., hot tub, dedicated workspace, EV charger) in your listing description and photos.
- Regularly check competitor amenities in Rockingham to stay competitive.
Rockingham Airbnb Guest Demographics & Profile Analysis (2025)
Guest Profile Summary for Rockingham
- The typical guest profile for Airbnb in Rockingham consists of primarily domestic travelers (75%), often arriving from nearby Perth, typically belonging to the Post-2000s (Gen Z/Alpha) group (50%), primarily speaking English or German.
- Domestic travelers account for 75.0% of guests.
- Key international markets include Australia (75%) and United Kingdom (7.9%).
- Top languages spoken are English (69%) followed by German (3.8%).
- A significant demographic segment is the Post-2000s (Gen Z/Alpha) group, representing 50% of guests.
Recommendations for Hosts
- Target domestic marketing efforts towards travelers from Perth and Western Australia.
- Tailor amenities and listing descriptions to appeal to the dominant Post-2000s (Gen Z/Alpha) demographic (e.g., highlight fast WiFi, smart home features, local guides).
- Highlight unique local experiences or amenities relevant to the primary guest profile.
- Consider seasonal promotions aligned with peak travel times for key origin markets.
Nearby Short-Term Rental Market Comparison
How does the Rockingham Airbnb market stack up against its neighbors? Compare key performance metrics like average monthly revenue, ADR, and occupancy rates in surrounding areas to understand the broader regional STR landscape.
| Market | Active Properties | Monthly Revenue | Daily Rate | Avg. Occupancy |
|---|---|---|---|---|
| Gracetown | 34 | $4,562 | $358.38 | 47% |
| Cottesloe | 138 | $4,018 | $230.16 | 66% |
| Margaret River | 410 | $3,882 | $218.78 | 61% |
| Gnarabup | 88 | $3,791 | $265.86 | 52% |
| Prevelly | 41 | $3,790 | $238.98 | 57% |
| Dunsborough | 446 | $3,762 | $289.15 | 48% |
| Yallingup | 238 | $3,754 | $334.67 | 46% |
| Peppermint Grove Beach | 35 | $3,750 | $326.50 | 39% |
| City Of Busselton | 535 | $3,637 | $301.10 | 44% |
| Swanbourne | 10 | $3,608 | $326.94 | 49% |