Rivervale Airbnb Market Analysis 2025: Short Term Rental Data & Vacation Rental Statistics in Western Australia, Australia
Is Airbnb profitable in Rivervale in 2025? Explore comprehensive Airbnb analytics for Rivervale, Western Australia, Australia to uncover income potential. This 2025 STR market report for Rivervale, based on AirROI data from April 2024 to March 2025, reveals key trends in the niche market of 54 active listings.
Whether you're considering an Airbnb investment in Rivervale, optimizing your existing vacation rental, or exploring rental arbitrage opportunities, understanding the Rivervale Airbnb data is crucial. Navigating the high regulation landscape is key to maximizing your short term rental income potential. Let's dive into the specifics.
Key Rivervale Airbnb Performance Metrics Overview
Monthly Airbnb Revenue Variations & Income Potential in Rivervale (2025)
Understanding the monthly revenue variations for Airbnb listings in Rivervale is key to maximizing your short term rental income potential. Seasonality significantly impacts earnings. Our analysis, based on data from the past 12 months, shows that the peak revenue month for STRs in Rivervale is typically December, while March often presents the lowest earnings, highlighting opportunities for strategic pricing adjustments during shoulder and low seasons. Explore the typical Airbnb income in Rivervale across different performance tiers:
- Best-in-class properties (Top 10%) achieve $4,787+ monthly, often utilizing dynamic pricing and superior guest experiences.
- Strong performing properties (Top 25%) earn $2,832 or more, indicating effective management and desirable locations/amenities.
- Typical properties (Median) generate around $1,900 per month, representing the average market performance.
- Entry-level properties (Bottom 25%) see earnings around $1,072, often with potential for optimization.
Average Monthly Airbnb Earnings Trend in Rivervale
Rivervale Airbnb Occupancy Rate Trends (2025)
Maximize your bookings by understanding the Rivervale STR occupancy trends. Seasonal demand shifts significantly influence how often properties are booked. Typically, Februarysees the highest demand (peak season occupancy), while June experiences the lowest (low season). Effective strategies, like adjusting minimum stays or offering promotions, can boost occupancy during slower periods. Here's how different property tiers perform in Rivervale:
- Best-in-class properties (Top 10%) achieve 91%+ occupancy, indicating high desirability and potentially optimized availability.
- Strong performing properties (Top 25%) maintain 83% or higher occupancy, suggesting good market fit and guest satisfaction.
- Typical properties (Median) have an occupancy rate around 62%.
- Entry-level properties (Bottom 25%) average 38% occupancy, potentially facing higher vacancy.
Average Monthly Occupancy Rate Trend in Rivervale
Average Daily Rate (ADR) Airbnb Trends in Rivervale (2025)
Effective short term rental pricing strategy in Rivervale involves understanding monthly ADR fluctuations. The Average Daily Rate (ADR) for Airbnb in Rivervale typically peaks in November and dips lowest during August. Leveraging Airbnb dynamic pricing tools or strategies based on this seasonality can significantly boost revenue. Here's a look at the typical nightly rates achieved:
- Best-in-class properties (Top 10%) command rates of $224+ per night, often due to premium features or locations.
- Strong performing properties (Top 25%) achieve nightly rates of $132 or more.
- Typical properties (Median) charge around $96 per night.
- Entry-level properties (Bottom 25%) earn around $72 per night.
Average Daily Rate (ADR) Trend by Month in Rivervale
Get Live Rivervale Market Intelligence 👇

Explore Real-time Analytics
Airbnb Seasonality Analysis & Trends in Rivervale (2025)
Peak Season (December, January, November)
- Revenue averages $2,636 per month
- Occupancy rates average 65.3%
- Daily rates average $129
Shoulder Season
- Revenue averages $2,345 per month
- Occupancy maintains around 58.4%
- Daily rates hold near $117
Low Season (March, July, August)
- Revenue drops to average $1,946 per month
- Occupancy decreases to average 53.6%
- Daily rates adjust to average $116
Seasonality Insights for Rivervale
- The Airbnb seasonality in Rivervale shows moderate seasonality with distinct peak and low periods. While the sections above show seasonal averages, it's also insightful to look at the extremes:
- During the high season, the absolute peak month showcases Rivervale's highest earning potential, with monthly revenues capable of climbing to $2,716, occupancy reaching a high of 69.1%, and ADRs peaking at $130.
- Conversely, the slowest single month of the year, typically falling within the low season, marks the market's lowest point. In this month, revenue might dip to $1,690, occupancy could drop to 48.6%, and ADRs may adjust down to $114.
- Understanding both the seasonal averages and these monthly peaks and troughs in revenue, occupancy, and ADR is crucial for maximizing your Airbnb profit potential in Rivervale.
Seasonal Strategies for Maximizing Profit
- Peak Season: Maximize revenue through premium pricing and potentially longer minimum stays. Ensure high availability.
- Low Season: Offer competitive pricing, special promotions (e.g., extended stay discounts), and flexible cancellation policies. Target off-season travelers like remote workers or budget-conscious guests.
- Shoulder Seasons: Implement dynamic pricing that balances peak and low rates. Target weekend travelers or specific events. Offer slightly more flexible terms than peak season.
- Regularly analyze your own performance against these Rivervale seasonality benchmarks and adjust your pricing and availability strategy accordingly.
Best Areas for Airbnb Investment in Rivervale (2025)
Exploring the top neighborhoods for short-term rentals in Rivervale? This section highlights key areas, outlining why they are attractive for hosts and guests, along with notable local attractions. Consider these locations based on your target guest profile and investment strategy.
| Neighborhood / Area | Why Host Here? (Target Guests & Appeal) | Key Attractions & Landmarks |
|---|---|---|
| Rivervale | Rivervale is a suburb situated close to the Swan River, providing a serene environment while being only minutes away from Perth's CBD. It's a popular choice for families and business travelers seeking convenient access to the city as well as recreational activities. | Perth Stadium, Crown Perth, Swan River, Burswood Park, Rivervale Skate Park, Burswood Parklands |
| Burswood | Burswood is known for its vibrant entertainment precinct, home to the Crown Perth casino and various bars and restaurants. It's appealing for tourists looking for nightlife and entertainment options. | Crown Perth, Perth Stadium, WACA Ground, Burswood Park, Swan River |
| Lathlain | Lathlain is a rapidly developing suburb that boasts proximity to the city and has seen significant investment in facilities and amenities, attracting both families and professionals. | Lathlain Park, Perth's Brewery District, Victoria Park, The Park Centre, Lathlain Community Centre |
| Maylands | Maylands is a trendy suburb along the Swan River with a mix of cafes, shops, and parks. It's popular among younger demographics and those looking for a vibrant community to live in or visit. | Maylands Peninsula Golf Course, Swan River, The Whatley Crescent café strip, Birdwood Square, Maylands Train Station |
| East Victoria Park | East Victoria Park offers a mix of suburban charm and urban convenience, with a bustling café strip and parks. It's close to public transport for easy access to Perth CBD. | Victoria Park Cafe Strip, St. Thomas' Church, East Victoria Park Shopping Centre, John McMillan Park, Dawn Park |
| Kensington | Kensington is a quaint suburb near the river, known for its community vibe. It attracts families and professionals looking for a peaceful environment close to the city. | Kensington Bushland, Lake Brearley, Jirdarup Park, Kensington Primary School, Wallace Park |
| South Perth | South Perth is directly across the river from the city, offering stunning views of the Perth skyline. It's a prime spot for tourists and weekend getaways with plenty of parks and attractions. | Perth Zoo, South Perth Foreshore, Mends Street Jetty, Old Mill, Windsor Park |
| Nollamara | Nollamara is a growing suburb with diverse cultural offerings and amenities. It's attracting investors seeking affordable properties in a family-friendly neighborhood, close to transport links. | Nollamara Shopping Centre, Des Penman Reserve, Pioneers Park, Koonung Park, Parks and community facilities |
Understanding Airbnb License Requirements & STR Laws in Rivervale (2025)
Yes, Rivervale, Western Australia, Australia enforces high STR regulations. Obtaining a license and ensuring compliance is almost certainly required according to current 2025 STR laws. Always verify the latest short term rental regulations and Airbnb license requirements directly with local government authorities for Rivervale to ensure full compliance before hosting.
(Source: AirROI data, 2025, based on 65% licensed listings)
Top Performing Airbnb Properties in Rivervale (2025)
Benchmark your potential! Explore examples of top-performing Airbnb properties in Rivervalebased on Trailing Twelve Month (TTM) revenue. Analyze their characteristics, revenue, occupancy rate, and ADR to understand what drives success in this market.
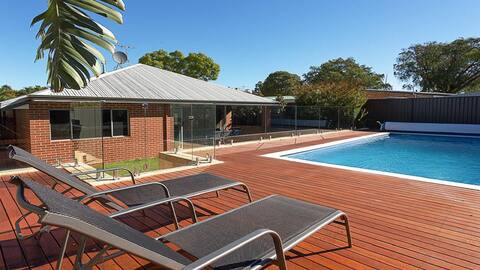
Rivervale Retreat: Spacious Family Living
Entire Place • 4 bedrooms
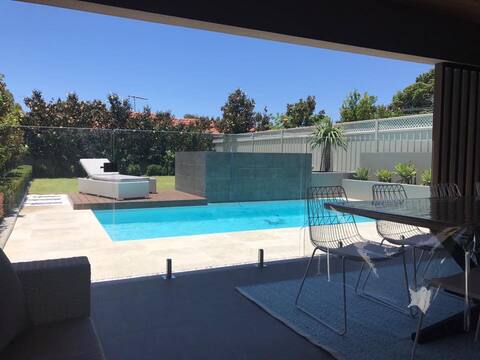
Executive luxury home with beautiful pool
Entire Place • 3 bedrooms
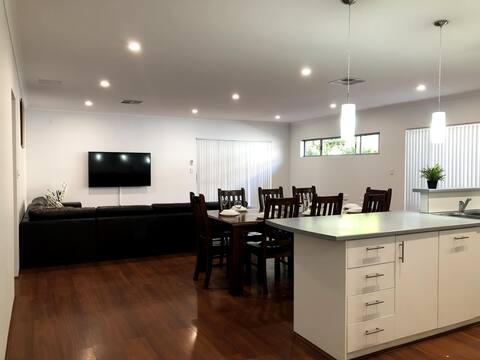
Burswood Delight Family House!
Entire Place • 4 bedrooms
Charming 4BR Picket Fenced House
Entire Place • 4 bedrooms
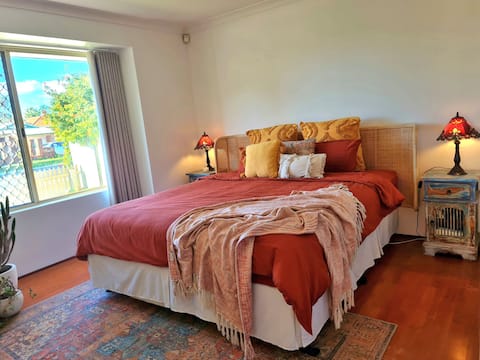
❤️ Location next to Casino/Airport/CBD/4X2.5house
Entire Place • 4 bedrooms
Rivervale Family Retreat-Optus,River,Shops,Crown
Entire Place • 3 bedrooms
Note: Performance varies based on location, size, amenities, seasonality, and management quality. Data reflects the past 12 months.
Top Performing Airbnb Hosts in Rivervale (2025)
Learn from the best! This table showcases top-performing Airbnb hosts in Rivervale based on the number of properties managed and estimated total revenue over the past year. Analyze their scale and performance metrics.
| Host Name | Properties | Grossing Revenue | Stay Reviews | Avg Rating |
|---|---|---|---|---|
| John | 16 | $288,389 | 446 | 4.17/5.0 |
| Phoebe | 6 | $177,567 | 449 | 4.57/5.0 |
| Aoife | 1 | $102,862 | 116 | 4.86/5.0 |
| Jonathan | 2 | $84,513 | 32 | 4.73/5.0 |
| Stacey | 1 | $82,798 | 123 | 4.87/5.0 |
| Shaylee | 1 | $65,747 | 147 | 4.79/5.0 |
| Jason | 1 | $59,095 | 277 | 4.83/5.0 |
| Rachel | 1 | $58,834 | 12 | 4.83/5.0 |
| Doug | 5 | $55,767 | 132 | 4.84/5.0 |
| Lena | 3 | $45,488 | 431 | 4.90/5.0 |
Analyzing the strategies of top hosts, such as their property selection, pricing, and guest communication, can offer valuable lessons for optimizing your own Airbnb operations in Rivervale.
Dive Deeper: Advanced Rivervale STR Market Data (2025)
Ready to unlock more insights? AirROI provides access to advanced metrics and comprehensive Airbnb data for Rivervale. Explore detailed analytics beyond this report to refine your investment strategy, optimize pricing, and maximize your vacation rental profits.
Explore Advanced MetricsRivervale Short-Term Rental Market Composition (2025): Property & Room Types
Room Type Distribution
Property Type Distribution
Market Composition Insights for Rivervale
- The Rivervale Airbnb market composition is heavily skewed towards Entire Home/Apt listings, which make up 74.1% of the 54 active rentals. This indicates strong guest preference for privacy and space.
- Looking at the property type distribution in Rivervale, Apartment/Condo properties are the most common (57.4%), reflecting the local real estate landscape.
- Houses represent a significant 37% portion, catering likely to families or larger groups.
- Smaller segments like hotel/boutique, others (combined 5.6%) offer potential for unique stay experiences.
Rivervale Airbnb Room Capacity Analysis (2025): Bedroom Distribution
Distribution of Listings by Number of Bedrooms
Room Capacity Insights for Rivervale
- The dominant room capacity in Rivervale is 1 bedroom listings, making up 53.7% of the market. This suggests a strong demand for properties suitable for couples or solo travelers.
- Together, 1 bedroom and 4 bedrooms properties represent 63.0% of the active Airbnb listings in Rivervale, indicating a high concentration in these sizes.
- With over half the market (53.7%) consisting of studios or 1-bedroom units, Rivervale is particularly well-suited for individuals or couples.
Rivervale Vacation Rental Guest Capacity Trends (2025)
Distribution of Listings by Guest Capacity
Guest Capacity Insights for Rivervale
- The most common guest capacity trend in Rivervale vacation rentals is listings accommodating 2 guests (48.1%). This suggests the primary traveler segment is likely couples or solo travelers.
- Properties designed for 2 guests and 8+ guests dominate the Rivervale STR market, accounting for 59.2% of listings.
- A significant 50.0% of listings cater specifically to 1-2 guests, highlighting strong demand from couples and solo travelers in Rivervale.
- 16.7% of properties accommodate 6+ guests, serving the market segment for larger families or group travel in Rivervale.
- On average, properties in Rivervale are equipped to host 2.7 guests.
Rivervale Airbnb Booking Patterns (2025): Available vs. Booked Days
Available Days Distribution
Booked Days Distribution
Booking Pattern Insights for Rivervale
- The most common availability pattern in Rivervale falls within the 91-180 days range, representing 37% of listings. This suggests many properties have significant open periods on their calendars.
- Approximately 38.9% of listings show high availability (181+ days open annually), indicating potential for increased bookings or specific owner usage patterns.
- For booked days, the 181-270 days range is most frequent in Rivervale (38.9%), reflecting common guest stay durations or potential owner blocking patterns.
- A notable 64.8% of properties secure long booking periods (181+ days booked per year), highlighting successful long-term rental strategies or significant owner usage.
Rivervale Airbnb Minimum Stay Requirements Analysis
Distribution of Listings by Minimum Night Requirement
1 Night
6 listings
11.5% of total
2 Nights
6 listings
11.5% of total
3 Nights
11 listings
21.2% of total
4-6 Nights
5 listings
9.6% of total
7-29 Nights
17 listings
32.7% of total
30+ Nights
7 listings
13.5% of total
Key Insights
- The most prevalent minimum stay requirement in Rivervale is 7-29 Nights, adopted by 32.7% of listings. This highlights the market's preference for shorter, flexible bookings.
- A significant segment (13.5%) caters to monthly stays (30+ nights) in Rivervale, pointing to opportunities in the extended-stay market.
Recommendations
- Align with the market by considering a 7-29 Nights minimum stay, as 32.7% of Rivervale hosts use this setting.
- If feasible, allowing 1-night stays, especially midweek or during low season, could capture last-minute bookings, as only 11.5% currently do.
- Explore offering discounts for stays of 30+ nights to attract the 13.5% of the market seeking extended stays.
- Adjust minimum nights based on seasonality – potentially shorter during low season and longer during peak demand periods in Rivervale.
Rivervale Airbnb Cancellation Policy Trends Analysis (2025)
Flexible
8 listings
16.3% of total
Moderate
18 listings
36.7% of total
Firm
4 listings
8.2% of total
Strict
19 listings
38.8% of total
Cancellation Policy Insights for Rivervale
- The prevailing Airbnb cancellation policy trend in Rivervale is Strict, used by 38.8% of listings.
- There's a relatively balanced mix between guest-friendly (53.0%) and stricter (47.0%) policies, offering choices for different guest needs.
Recommendations for Hosts
- Consider adopting a Strict policy to align with the 38.8% market standard in Rivervale.
- With 38.8% using Strict terms, this is a viable option in Rivervale, particularly for high-value properties or during peak demand periods.
- Regularly review your cancellation policy against competitors and market demand shifts in Rivervale.
Rivervale STR Booking Lead Time Analysis (2025)
Average Booking Lead Time by Month
Booking Lead Time Insights for Rivervale
- The overall average booking lead time for vacation rentals in Rivervale is 29 days.
- Guests book furthest in advance for stays during January (average 44 days), likely coinciding with peak travel demand or local events.
- The shortest booking windows occur for stays in August (average 22 days), indicating more last-minute travel plans during this time.
- Seasonally, Winter (41 days avg.) sees the longest lead times, while Summer (25 days avg.) has the shortest, reflecting typical travel planning cycles.
Recommendations for Hosts
- Use the overall average lead time (29 days) as a baseline for your pricing and availability strategy in Rivervale.
- For January stays, consider implementing length-of-stay discounts or slightly higher rates for bookings made less than 44 days out to capitalize on advance planning.
- Target marketing efforts for the Winter season well in advance (at least 41 days) to capture early planners.
- Monitor your own booking lead times against these Rivervale averages to identify opportunities for dynamic pricing adjustments.
Popular & Essential Airbnb Amenities in Rivervale (2025)
Amenity Prevalence
Amenity Insights for Rivervale
- Essential amenities in Rivervale that guests expect include: Wifi, Smoke alarm, Air conditioning. Lacking these (any) could significantly impact bookings.
- Popular amenities like Iron, Hangers, Microwave are common but not universal. Offering these can provide a competitive edge.
Recommendations for Hosts
- Ensure your listing includes all essential amenities for Rivervale: Wifi, Smoke alarm, Air conditioning.
- Prioritize adding missing essentials: Smoke alarm, Air conditioning.
- Consider adding popular differentiators like Iron or Hangers to increase appeal.
- Highlight unique or less common amenities you offer (e.g., hot tub, dedicated workspace, EV charger) in your listing description and photos.
- Regularly check competitor amenities in Rivervale to stay competitive.
Rivervale Airbnb Guest Demographics & Profile Analysis (2025)
Guest Profile Summary for Rivervale
- The typical guest profile for Airbnb in Rivervale consists of primarily domestic travelers (66%), often arriving from nearby Perth, typically belonging to the Post-2000s (Gen Z/Alpha) group (50%), primarily speaking English or Chinese.
- Domestic travelers account for 66.3% of guests.
- Key international markets include Australia (66.3%) and Singapore (10.8%).
- Top languages spoken are English (67.2%) followed by Chinese (9.8%).
- A significant demographic segment is the Post-2000s (Gen Z/Alpha) group, representing 50% of guests.
Recommendations for Hosts
- Target domestic marketing efforts towards travelers from Perth and Geraldton.
- Tailor amenities and listing descriptions to appeal to the dominant Post-2000s (Gen Z/Alpha) demographic (e.g., highlight fast WiFi, smart home features, local guides).
- Highlight unique local experiences or amenities relevant to the primary guest profile.
- Consider seasonal promotions aligned with peak travel times for key origin markets.
Nearby Short-Term Rental Market Comparison
How does the Rivervale Airbnb market stack up against its neighbors? Compare key performance metrics like average monthly revenue, ADR, and occupancy rates in surrounding areas to understand the broader regional STR landscape.
| Market | Active Properties | Monthly Revenue | Daily Rate | Avg. Occupancy |
|---|---|---|---|---|
| Cottesloe | 138 | $4,018 | $230.16 | 66% |
| Swanbourne | 10 | $3,608 | $326.94 | 49% |
| City of Mandurah | 29 | $2,989 | $218.84 | 46% |
| Shire Of Murray | 56 | $2,975 | $222.09 | 47% |
| Mosman Park | 49 | $2,967 | $195.80 | 64% |
| Mandurah | 387 | $2,963 | $241.70 | 48% |
| Dwellingup | 18 | $2,954 | $149.11 | 64% |
| South Fremantle | 74 | $2,896 | $177.02 | 61% |
| Shire Of Toodyay | 17 | $2,868 | $231.11 | 44% |
| North Fremantle | 29 | $2,821 | $189.18 | 62% |