North Fremantle Airbnb Market Analysis 2025: Short Term Rental Data & Vacation Rental Statistics in Western Australia, Australia
Is Airbnb profitable in North Fremantle in 2025? Explore comprehensive Airbnb analytics for North Fremantle, Western Australia, Australia to uncover income potential. This 2025 STR market report for North Fremantle, based on AirROI data from April 2024 to March 2025, reveals key trends in the niche market of 29 active listings.
Whether you're considering an Airbnb investment in North Fremantle, optimizing your existing vacation rental, or exploring rental arbitrage opportunities, understanding the North Fremantle Airbnb data is crucial. Navigating the high regulation landscape is key to maximizing your short term rental income potential. Let's dive into the specifics.
Key North Fremantle Airbnb Performance Metrics Overview
Monthly Airbnb Revenue Variations & Income Potential in North Fremantle (2025)
Understanding the monthly revenue variations for Airbnb listings in North Fremantle is key to maximizing your short term rental income potential. Seasonality significantly impacts earnings. Our analysis, based on data from the past 12 months, shows that the peak revenue month for STRs in North Fremantle is typically December, while August often presents the lowest earnings, highlighting opportunities for strategic pricing adjustments during shoulder and low seasons. Explore the typical Airbnb income in North Fremantle across different performance tiers:
- Best-in-class properties (Top 10%) achieve $5,824+ monthly, often utilizing dynamic pricing and superior guest experiences.
- Strong performing properties (Top 25%) earn $4,410 or more, indicating effective management and desirable locations/amenities.
- Typical properties (Median) generate around $3,152 per month, representing the average market performance.
- Entry-level properties (Bottom 25%) see earnings around $2,096, often with potential for optimization.
Average Monthly Airbnb Earnings Trend in North Fremantle
North Fremantle Airbnb Occupancy Rate Trends (2025)
Maximize your bookings by understanding the North Fremantle STR occupancy trends. Seasonal demand shifts significantly influence how often properties are booked. Typically, Decembersees the highest demand (peak season occupancy), while August experiences the lowest (low season). Effective strategies, like adjusting minimum stays or offering promotions, can boost occupancy during slower periods. Here's how different property tiers perform in North Fremantle:
- Best-in-class properties (Top 10%) achieve 92%+ occupancy, indicating high desirability and potentially optimized availability.
- Strong performing properties (Top 25%) maintain 85% or higher occupancy, suggesting good market fit and guest satisfaction.
- Typical properties (Median) have an occupancy rate around 73%.
- Entry-level properties (Bottom 25%) average 40% occupancy, potentially facing higher vacancy.
Average Monthly Occupancy Rate Trend in North Fremantle
Average Daily Rate (ADR) Airbnb Trends in North Fremantle (2025)
Effective short term rental pricing strategy in North Fremantle involves understanding monthly ADR fluctuations. The Average Daily Rate (ADR) for Airbnb in North Fremantle typically peaks in December and dips lowest during July. Leveraging Airbnb dynamic pricing tools or strategies based on this seasonality can significantly boost revenue. Here's a look at the typical nightly rates achieved:
- Best-in-class properties (Top 10%) command rates of $384+ per night, often due to premium features or locations.
- Strong performing properties (Top 25%) achieve nightly rates of $226 or more.
- Typical properties (Median) charge around $155 per night.
- Entry-level properties (Bottom 25%) earn around $115 per night.
Average Daily Rate (ADR) Trend by Month in North Fremantle
Get Live North Fremantle Market Intelligence 👇

Explore Real-time Analytics
Airbnb Seasonality Analysis & Trends in North Fremantle (2025)
Peak Season (December, January, February)
- Revenue averages $4,064 per month
- Occupancy rates average 68.9%
- Daily rates average $230
Shoulder Season
- Revenue averages $3,490 per month
- Occupancy maintains around 62.8%
- Daily rates hold near $200
Low Season (July, August, September)
- Revenue drops to average $2,665 per month
- Occupancy decreases to average 57.5%
- Daily rates adjust to average $185
Seasonality Insights for North Fremantle
- The Airbnb seasonality in North Fremantle shows moderate seasonality with distinct peak and low periods. While the sections above show seasonal averages, it's also insightful to look at the extremes:
- During the high season, the absolute peak month showcases North Fremantle's highest earning potential, with monthly revenues capable of climbing to $4,521, occupancy reaching a high of 73.6%, and ADRs peaking at $236.
- Conversely, the slowest single month of the year, typically falling within the low season, marks the market's lowest point. In this month, revenue might dip to $2,415, occupancy could drop to 51.3%, and ADRs may adjust down to $184.
- Understanding both the seasonal averages and these monthly peaks and troughs in revenue, occupancy, and ADR is crucial for maximizing your Airbnb profit potential in North Fremantle.
Seasonal Strategies for Maximizing Profit
- Peak Season: Maximize revenue through premium pricing and potentially longer minimum stays. Ensure high availability.
- Low Season: Offer competitive pricing, special promotions (e.g., extended stay discounts), and flexible cancellation policies. Target off-season travelers like remote workers or budget-conscious guests.
- Shoulder Seasons: Implement dynamic pricing that balances peak and low rates. Target weekend travelers or specific events. Offer slightly more flexible terms than peak season.
- Regularly analyze your own performance against these North Fremantle seasonality benchmarks and adjust your pricing and availability strategy accordingly.
Best Areas for Airbnb Investment in North Fremantle (2025)
Exploring the top neighborhoods for short-term rentals in North Fremantle? This section highlights key areas, outlining why they are attractive for hosts and guests, along with notable local attractions. Consider these locations based on your target guest profile and investment strategy.
| Neighborhood / Area | Why Host Here? (Target Guests & Appeal) | Key Attractions & Landmarks |
|---|---|---|
| North Fremantle Beach | Beautiful beach area that attracts tourists looking for sun, surf and sand. Perfect for water sports and relaxation, with a laid-back atmosphere. | North Fremantle Beach, Leighton Beach, Cottesloe Beach, Fremantle Markets, Fremantle Prison |
| Fremantle Harbour | Bustling harbor area known for its vibrant food scene, local markets and cultural experiences. Popular among foodies and history buffs. | Fremantle Fishing Boat Harbour, Little Creatures Brewery, Fremantle Maritime Museum, The Wharf, Fremantle Markets |
| Kardinya Park | Residential area with easy access to parks and shopping centers. Attractive for families and longer-term stays. | Kardinya Park Shopping Centre, Parks and Recreation Areas, Public Transport Links |
| Swan River Foreshore | Scenic area along the river, perfect for outdoor activities and scenic views. Ideal for nature-loving guests. | Swan River, Bicycle paths, Picnic areas, Fishing spots |
| South Beach | A quiet beach area that offers a peaceful retreat while being close to Fremantle's vibrancy. Great for relaxing getaways. | South Beach, Bathers Beach, Parks and picnic spots, Local cafes |
| Fremantle Arts Centre | Cultural hub with art exhibitions and events. Attracts visitors interested in local arts and culture. | Fremantle Arts Centre, Art galleries, Live concerts, Cultural events |
| Henley Beach | A family-friendly beach area known for its calm waters and facilities. Ideal for hosting family vacations or group retreats. | Henley Beach, Playgrounds, Picnic areas, Water sports |
| Fremantle City Centre | The heart of Fremantle with shops, restaurants, and nightlife. Always bustling with activity and a must-see for visitors. | Fremantle Markets, Shopping streets, Restaurants and bars, Historical buildings |
Understanding Airbnb License Requirements & STR Laws in North Fremantle (2025)
Yes, North Fremantle, Western Australia, Australia enforces high STR regulations. Obtaining a license and ensuring compliance is almost certainly required according to current 2025 STR laws. Always verify the latest short term rental regulations and Airbnb license requirements directly with local government authorities for North Fremantle to ensure full compliance before hosting.
(Source: AirROI data, 2025, based on 62% licensed listings)
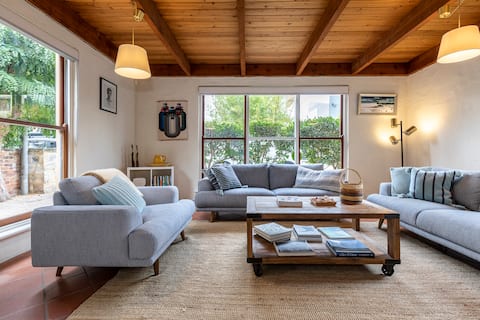
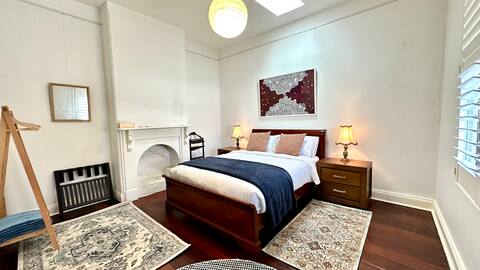
Top Performing Airbnb Properties in North Fremantle (2025)
Benchmark your potential! Explore examples of top-performing Airbnb properties in North Fremantlebased on Trailing Twelve Month (TTM) revenue. Analyze their characteristics, revenue, occupancy rate, and ADR to understand what drives success in this market.
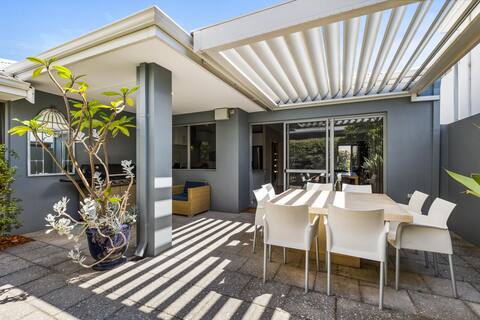
Sandy Toes Villa
Entire Place • 3 bedrooms
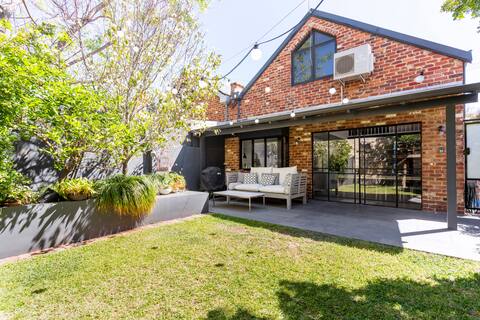
North Fremantle loft house, walk to beach
Entire Place • 2 bedrooms
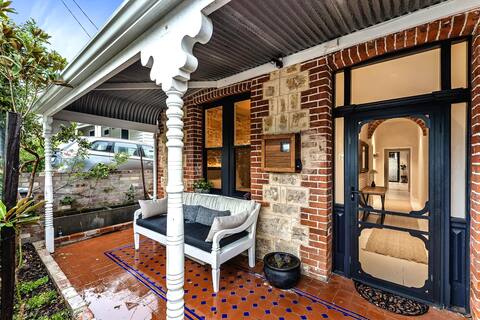
North Fremantle Cottage
Entire Place • 2 bedrooms
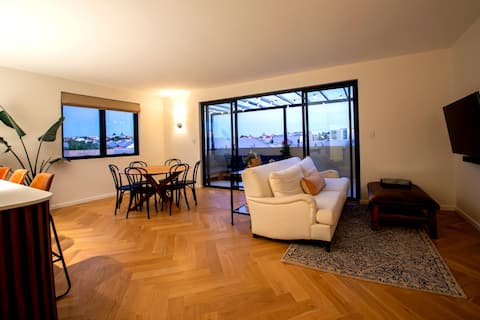
Explore Fremantle from North Bank Apartment
Entire Place • 2 bedrooms
Style and Comfort near River and Pristine Beaches
Entire Place • 1 bedroom
Charming Ironmonger's Cottage & Rooftop Oasis
Entire Place • 2 bedrooms
Note: Performance varies based on location, size, amenities, seasonality, and management quality. Data reflects the past 12 months.
Top Performing Airbnb Hosts in North Fremantle (2025)
Learn from the best! This table showcases top-performing Airbnb hosts in North Fremantle based on the number of properties managed and estimated total revenue over the past year. Analyze their scale and performance metrics.
| Host Name | Properties | Grossing Revenue | Stay Reviews | Avg Rating |
|---|---|---|---|---|
| Justine & Lan | 2 | $93,502 | 95 | 4.83/5.0 |
| Rachele Space BnB | 1 | $77,487 | 11 | 4.91/5.0 |
| Rachel | 1 | $61,064 | 118 | 4.91/5.0 |
| Tessa | 1 | $56,048 | 45 | 4.87/5.0 |
| Antonia | 1 | $51,701 | 281 | 4.75/5.0 |
| David | 1 | $51,433 | 28 | 4.93/5.0 |
| Sarah | 1 | $47,727 | 23 | 4.65/5.0 |
| Ellie | 1 | $47,146 | 74 | 5.00/5.0 |
| Pier Twenty One | 2 | $38,417 | 121 | 4.51/5.0 |
| Wendy | 1 | $35,965 | 160 | 4.94/5.0 |
Analyzing the strategies of top hosts, such as their property selection, pricing, and guest communication, can offer valuable lessons for optimizing your own Airbnb operations in North Fremantle.
Dive Deeper: Advanced North Fremantle STR Market Data (2025)
Ready to unlock more insights? AirROI provides access to advanced metrics and comprehensive Airbnb data for North Fremantle. Explore detailed analytics beyond this report to refine your investment strategy, optimize pricing, and maximize your vacation rental profits.
Explore Advanced MetricsNorth Fremantle Short-Term Rental Market Composition (2025): Property & Room Types
Room Type Distribution
Property Type Distribution
Market Composition Insights for North Fremantle
- The North Fremantle Airbnb market composition is heavily skewed towards Entire Home/Apt listings, which make up 93.1% of the 29 active rentals. This indicates strong guest preference for privacy and space.
- Looking at the property type distribution in North Fremantle, House properties are the most common (48.3%), reflecting the local real estate landscape.
- Houses represent a significant 48.3% portion, catering likely to families or larger groups.
- The presence of 6.9% Hotel/Boutique listings indicates integration with traditional hospitality.
North Fremantle Airbnb Room Capacity Analysis (2025): Bedroom Distribution
Distribution of Listings by Number of Bedrooms
Room Capacity Insights for North Fremantle
- The dominant room capacity in North Fremantle is 1 bedroom listings, making up 41.4% of the market. This suggests a strong demand for properties suitable for couples or solo travelers.
- Together, 1 bedroom and 2 bedrooms properties represent 79.3% of the active Airbnb listings in North Fremantle, indicating a high concentration in these sizes.
North Fremantle Vacation Rental Guest Capacity Trends (2025)
Distribution of Listings by Guest Capacity
Guest Capacity Insights for North Fremantle
- The most common guest capacity trend in North Fremantle vacation rentals is listings accommodating 2 guests (41.4%). This suggests the primary traveler segment is likely couples or solo travelers.
- Properties designed for 2 guests and 4 guests dominate the North Fremantle STR market, accounting for 75.9% of listings.
- A significant 41.4% of listings cater specifically to 1-2 guests, highlighting strong demand from couples and solo travelers in North Fremantle.
- 13.8% of properties accommodate 6+ guests, serving the market segment for larger families or group travel in North Fremantle.
- On average, properties in North Fremantle are equipped to host 3.6 guests.
North Fremantle Airbnb Booking Patterns (2025): Available vs. Booked Days
Available Days Distribution
Booked Days Distribution
Booking Pattern Insights for North Fremantle
- The most common availability pattern in North Fremantle falls within the 31-90 days range, representing 34.5% of listings. This suggests many properties have significant open periods on their calendars.
- Approximately 34.5% of listings show high availability (181+ days open annually), indicating potential for increased bookings or specific owner usage patterns.
- For booked days, the 271-366 days range is most frequent in North Fremantle (37.9%), reflecting common guest stay durations or potential owner blocking patterns.
- A notable 65.5% of properties secure long booking periods (181+ days booked per year), highlighting successful long-term rental strategies or significant owner usage.
North Fremantle Airbnb Minimum Stay Requirements Analysis
Distribution of Listings by Minimum Night Requirement
1 Night
2 listings
7.4% of total
2 Nights
1 listings
3.7% of total
3 Nights
4 listings
14.8% of total
4-6 Nights
7 listings
25.9% of total
7-29 Nights
1 listings
3.7% of total
30+ Nights
12 listings
44.4% of total
Key Insights
- The most prevalent minimum stay requirement in North Fremantle is 30+ Nights, adopted by 44.4% of listings. This highlights the market's preference for longer commitments.
- Very short stays (1-2 nights) are less common (11.1%), suggesting hosts prefer slightly longer bookings to optimize turnover.
- A significant segment (44.4%) caters to monthly stays (30+ nights) in North Fremantle, pointing to opportunities in the extended-stay market.
Recommendations
- Align with the market by considering a 30+ Nights minimum stay, as 44.4% of North Fremantle hosts use this setting.
- If feasible, allowing 1-night stays, especially midweek or during low season, could capture last-minute bookings, as only 7.4% currently do.
- Explore offering discounts for stays of 30+ nights to attract the 44.4% of the market seeking extended stays.
- Adjust minimum nights based on seasonality – potentially shorter during low season and longer during peak demand periods in North Fremantle.
North Fremantle Airbnb Cancellation Policy Trends Analysis (2025)
Super Strict 60 Days
1 listings
3.6% of total
Flexible
6 listings
21.4% of total
Moderate
6 listings
21.4% of total
Firm
6 listings
21.4% of total
Strict
9 listings
32.1% of total
Cancellation Policy Insights for North Fremantle
- The prevailing Airbnb cancellation policy trend in North Fremantle is Strict, used by 32.1% of listings.
- A majority (53.5%) of hosts in North Fremantle utilize Firm or Strict policies, indicating a market where hosts prioritize booking security.
Recommendations for Hosts
- Consider adopting a Strict policy to align with the 32.1% market standard in North Fremantle.
- With 32.1% using Strict terms, this is a viable option in North Fremantle, particularly for high-value properties or during peak demand periods.
- Regularly review your cancellation policy against competitors and market demand shifts in North Fremantle.
North Fremantle STR Booking Lead Time Analysis (2025)
Average Booking Lead Time by Month
Booking Lead Time Insights for North Fremantle
- The overall average booking lead time for vacation rentals in North Fremantle is 41 days.
- Guests book furthest in advance for stays during December (average 62 days), likely coinciding with peak travel demand or local events.
- The shortest booking windows occur for stays in August (average 29 days), indicating more last-minute travel plans during this time.
- Seasonally, Winter (57 days avg.) sees the longest lead times, while Summer (33 days avg.) has the shortest, reflecting typical travel planning cycles.
Recommendations for Hosts
- Use the overall average lead time (41 days) as a baseline for your pricing and availability strategy in North Fremantle.
- For December stays, consider implementing length-of-stay discounts or slightly higher rates for bookings made less than 62 days out to capitalize on advance planning.
- Target marketing efforts for the Winter season well in advance (at least 57 days) to capture early planners.
- Monitor your own booking lead times against these North Fremantle averages to identify opportunities for dynamic pricing adjustments.
Popular & Essential Airbnb Amenities in North Fremantle (2025)
Amenity Prevalence
Amenity Insights for North Fremantle
- Essential amenities in North Fremantle that guests expect include: Wifi, Smoke alarm, Dishes and silverware, TV, Washer, Microwave, Hot water, Hangers, Iron, Bed linens. Lacking these (any) could significantly impact bookings.
Recommendations for Hosts
- Ensure your listing includes all essential amenities for North Fremantle: Wifi, Smoke alarm, Dishes and silverware, TV, Washer, Microwave, Hot water, Hangers, Iron, Bed linens.
- Prioritize adding missing essentials: Washer, Microwave, Hot water, Hangers, Iron, Bed linens.
- Highlight unique or less common amenities you offer (e.g., hot tub, dedicated workspace, EV charger) in your listing description and photos.
- Regularly check competitor amenities in North Fremantle to stay competitive.
North Fremantle Airbnb Guest Demographics & Profile Analysis (2025)
Guest Profile Summary for North Fremantle
- The typical guest profile for Airbnb in North Fremantle consists of primarily domestic travelers (69%), often arriving from nearby Perth, typically belonging to the Post-2000s (Gen Z/Alpha) group (50%), primarily speaking English or Chinese.
- Domestic travelers account for 68.5% of guests.
- Key international markets include Australia (68.5%) and United Kingdom (8.1%).
- Top languages spoken are English (61.8%) followed by Chinese (7.6%).
- A significant demographic segment is the Post-2000s (Gen Z/Alpha) group, representing 50% of guests.
Recommendations for Hosts
- Target domestic marketing efforts towards travelers from Perth and Melbourne.
- Tailor amenities and listing descriptions to appeal to the dominant Post-2000s (Gen Z/Alpha) demographic (e.g., highlight fast WiFi, smart home features, local guides).
- Highlight unique local experiences or amenities relevant to the primary guest profile.
- Consider seasonal promotions aligned with peak travel times for key origin markets.
Nearby Short-Term Rental Market Comparison
How does the North Fremantle Airbnb market stack up against its neighbors? Compare key performance metrics like average monthly revenue, ADR, and occupancy rates in surrounding areas to understand the broader regional STR landscape.
| Market | Active Properties | Monthly Revenue | Daily Rate | Avg. Occupancy |
|---|---|---|---|---|
| Gracetown | 34 | $4,562 | $358.38 | 47% |
| Cottesloe | 138 | $4,018 | $230.16 | 66% |
| Margaret River | 410 | $3,882 | $218.78 | 61% |
| Gnarabup | 88 | $3,791 | $265.86 | 52% |
| Prevelly | 41 | $3,790 | $238.98 | 57% |
| Dunsborough | 446 | $3,762 | $289.15 | 48% |
| Yallingup | 238 | $3,754 | $334.67 | 46% |
| Peppermint Grove Beach | 35 | $3,750 | $326.50 | 39% |
| City Of Busselton | 535 | $3,637 | $301.10 | 44% |
| Swanbourne | 10 | $3,608 | $326.95 | 49% |