Merredin Airbnb Market Analysis 2025: Short Term Rental Data & Vacation Rental Statistics in Western Australia, Australia
Is Airbnb profitable in Merredin in 2025? Explore comprehensive Airbnb analytics for Merredin, Western Australia, Australia to uncover income potential. This 2025 STR market report for Merredin, based on AirROI data from April 2024 to March 2025, reveals key trends in the niche market of 23 active listings.
Whether you're considering an Airbnb investment in Merredin, optimizing your existing vacation rental, or exploring rental arbitrage opportunities, understanding the Merredin Airbnb data is crucial. Navigating the high regulation landscape is key to maximizing your short term rental income potential. Let's dive into the specifics.
Key Merredin Airbnb Performance Metrics Overview
Monthly Airbnb Revenue Variations & Income Potential in Merredin (2025)
Understanding the monthly revenue variations for Airbnb listings in Merredin is key to maximizing your short term rental income potential. Seasonality significantly impacts earnings. Our analysis, based on data from the past 12 months, shows that the peak revenue month for STRs in Merredin is typically May, while February often presents the lowest earnings, highlighting opportunities for strategic pricing adjustments during shoulder and low seasons. Explore the typical Airbnb income in Merredin across different performance tiers:
- Best-in-class properties (Top 10%) achieve $2,754+ monthly, often utilizing dynamic pricing and superior guest experiences.
- Strong performing properties (Top 25%) earn $2,034 or more, indicating effective management and desirable locations/amenities.
- Typical properties (Median) generate around $1,209 per month, representing the average market performance.
- Entry-level properties (Bottom 25%) see earnings around $643, often with potential for optimization.
Average Monthly Airbnb Earnings Trend in Merredin
Merredin Airbnb Occupancy Rate Trends (2025)
Maximize your bookings by understanding the Merredin STR occupancy trends. Seasonal demand shifts significantly influence how often properties are booked. Typically, Maysees the highest demand (peak season occupancy), while November experiences the lowest (low season). Effective strategies, like adjusting minimum stays or offering promotions, can boost occupancy during slower periods. Here's how different property tiers perform in Merredin:
- Best-in-class properties (Top 10%) achieve 79%+ occupancy, indicating high desirability and potentially optimized availability.
- Strong performing properties (Top 25%) maintain 60% or higher occupancy, suggesting good market fit and guest satisfaction.
- Typical properties (Median) have an occupancy rate around 37%.
- Entry-level properties (Bottom 25%) average 17% occupancy, potentially facing higher vacancy.
Average Monthly Occupancy Rate Trend in Merredin
Average Daily Rate (ADR) Airbnb Trends in Merredin (2025)
Effective short term rental pricing strategy in Merredin involves understanding monthly ADR fluctuations. The Average Daily Rate (ADR) for Airbnb in Merredin typically peaks in November and dips lowest during March. Leveraging Airbnb dynamic pricing tools or strategies based on this seasonality can significantly boost revenue. Here's a look at the typical nightly rates achieved:
- Best-in-class properties (Top 10%) command rates of $134+ per night, often due to premium features or locations.
- Strong performing properties (Top 25%) achieve nightly rates of $117 or more.
- Typical properties (Median) charge around $104 per night.
- Entry-level properties (Bottom 25%) earn around $95 per night.
Average Daily Rate (ADR) Trend by Month in Merredin
Get Live Merredin Market Intelligence 👇

Explore Real-time Analytics
Airbnb Seasonality Analysis & Trends in Merredin (2025)
Peak Season (May, April, August)
- Revenue averages $2,051 per month
- Occupancy rates average 55.2%
- Daily rates average $108
Shoulder Season
- Revenue averages $1,345 per month
- Occupancy maintains around 38.0%
- Daily rates hold near $108
Low Season (February, March, November)
- Revenue drops to average $858 per month
- Occupancy decreases to average 27.6%
- Daily rates adjust to average $107
Seasonality Insights for Merredin
- The Airbnb seasonality in Merredin shows highly seasonal trends requiring careful strategy. While the sections above show seasonal averages, it's also insightful to look at the extremes:
- During the high season, the absolute peak month showcases Merredin's highest earning potential, with monthly revenues capable of climbing to $2,324, occupancy reaching a high of 56.2%, and ADRs peaking at $111.
- Conversely, the slowest single month of the year, typically falling within the low season, marks the market's lowest point. In this month, revenue might dip to $809, occupancy could drop to 26.9%, and ADRs may adjust down to $105.
- Understanding both the seasonal averages and these monthly peaks and troughs in revenue, occupancy, and ADR is crucial for maximizing your Airbnb profit potential in Merredin.
Seasonal Strategies for Maximizing Profit
- Peak Season: Maximize revenue through premium pricing and potentially longer minimum stays. Ensure high availability.
- Low Season: Offer competitive pricing, special promotions (e.g., extended stay discounts), and flexible cancellation policies. Target off-season travelers like remote workers or budget-conscious guests.
- Shoulder Seasons: Implement dynamic pricing that balances peak and low rates. Target weekend travelers or specific events. Offer slightly more flexible terms than peak season.
- Regularly analyze your own performance against these Merredin seasonality benchmarks and adjust your pricing and availability strategy accordingly.
Best Areas for Airbnb Investment in Merredin (2025)
Exploring the top neighborhoods for short-term rentals in Merredin? This section highlights key areas, outlining why they are attractive for hosts and guests, along with notable local attractions. Consider these locations based on your target guest profile and investment strategy.
| Neighborhood / Area | Why Host Here? (Target Guests & Appeal) | Key Attractions & Landmarks |
|---|---|---|
| Merredin Central | The heart of Merredin with easy access to local shops, cafes, and essential amenities. A great choice for travelers who want to experience local culture and convenience. | Merredin Heritage Centre, Merredin Peak, local parks, shopping centers, cafes and restaurants |
| Railway Precinct | A historic area that showcases Merredin's railway heritage. It's popular with train enthusiasts and those looking for a quiet, scenic stay. | Merredin Railway Station, old railway workshops, historical buildings, views of the train tracks, local museum |
| Cemetery Hill | A quiet and serene location offering wonderful views of the surrounding countryside. It's great for travelers looking for tranquility and nature. | Cemetery Hill lookout, nature walks, wildflower trails, scenic drives |
| Merredin Agricultural Region | Known for its rich agricultural landscape, this area attracts visitors interested in farming experiences and rural life. | local farms, agricultural shows, food tasting at local vendors, outdoor markets |
| Ballardong Country | Rich in Aboriginal history and cultural significance, this area provides a unique opportunity for visitors to learn about the local Indigenous culture. | cultural experiences, Native title history, local art exhibitions, guided eco-tours |
| Eastern Goldfields Highway | A key route for travelers heading to the Goldfields. Ideal for those passing through and looking for a comfortable stopover. | roadside parks, geraldton attractions, local diners, rest areas, historic landmarks |
| Lake Merredin | A beautiful natural environment perfect for outdoor activities like fishing and picnicking. A great place for families and nature lovers. | fishing spots, picnic areas, walking trails, bird watching, scenic views |
| Merredin Sports Complex | Fit for those who are interested in sports and recreation. Ideal for families attending sporting events or those who enjoy active vacations. | local sports events, playgrounds, fitness facilities, walking tracks |
Understanding Airbnb License Requirements & STR Laws in Merredin (2025)
Yes, Merredin, Western Australia, Australia enforces high STR regulations. Obtaining a license and ensuring compliance is almost certainly required according to current 2025 STR laws. Always verify the latest short term rental regulations and Airbnb license requirements directly with local government authorities for Merredin to ensure full compliance before hosting.
(Source: AirROI data, 2025, based on 30% licensed listings)
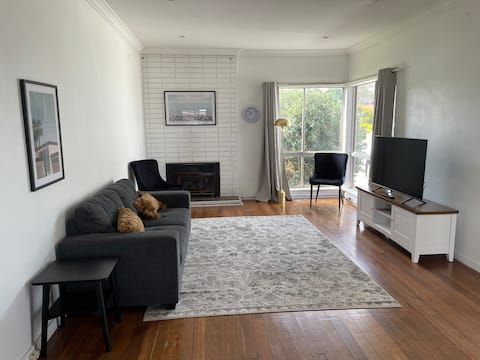
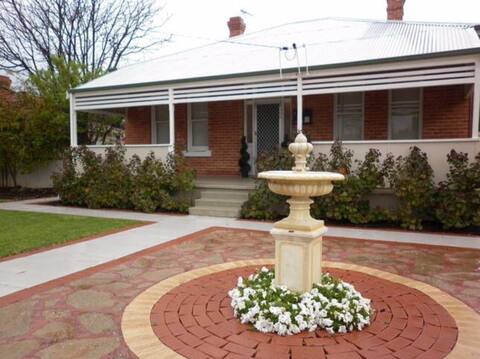
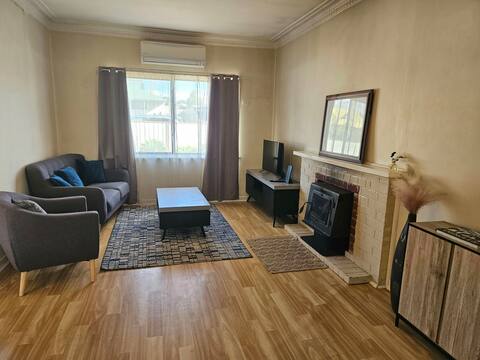
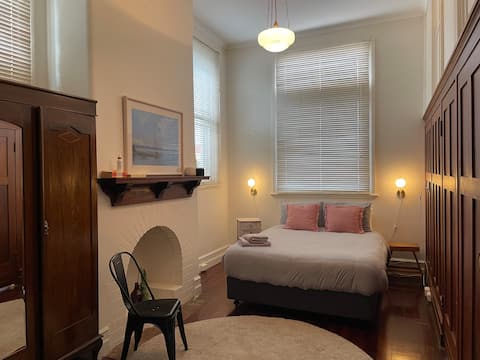
Top Performing Airbnb Properties in Merredin (2025)
Benchmark your potential! Explore examples of top-performing Airbnb properties in Merredinbased on Trailing Twelve Month (TTM) revenue. Analyze their characteristics, revenue, occupancy rate, and ADR to understand what drives success in this market.

*Newly furnished brick home in quiet area of town*
Entire Place • 4 bedrooms
Corporate 3 bedroom residence
Entire Place • 3 bedrooms
Heritage House - Free WIFI & Foxtel & Netflix
Entire Place • 3 bedrooms
Cosy home in Merredin
Entire Place • 2 bedrooms
Art Deco heritage 2 bedroom suite in Merredin CBD
Entire Place • 2 bedrooms
Comfortable Family Friendly Home
Entire Place • 3 bedrooms
Note: Performance varies based on location, size, amenities, seasonality, and management quality. Data reflects the past 12 months.
Top Performing Airbnb Hosts in Merredin (2025)
Learn from the best! This table showcases top-performing Airbnb hosts in Merredin based on the number of properties managed and estimated total revenue over the past year. Analyze their scale and performance metrics.
| Host Name | Properties | Grossing Revenue | Stay Reviews | Avg Rating |
|---|---|---|---|---|
| Olivia | 2 | $46,862 | 41 | 4.84/5.0 |
| Blake | 9 | $44,625 | 75 | 2.93/5.0 |
| Robert | 1 | $29,923 | 67 | 4.87/5.0 |
| Cassina | 2 | $28,036 | 154 | 4.21/5.0 |
| Vicki | 1 | $22,038 | 98 | 4.82/5.0 |
| Emma | 1 | $19,708 | 51 | 4.80/5.0 |
| Peter | 4 | $16,547 | 20 | 2.07/5.0 |
| Cherie | 1 | $13,540 | 6 | 4.83/5.0 |
| Brendon | 1 | $1,523 | 11 | 4.55/5.0 |
| Host #432094416 | 1 | $957 | 3 | 5.00/5.0 |
Analyzing the strategies of top hosts, such as their property selection, pricing, and guest communication, can offer valuable lessons for optimizing your own Airbnb operations in Merredin.
Dive Deeper: Advanced Merredin STR Market Data (2025)
Ready to unlock more insights? AirROI provides access to advanced metrics and comprehensive Airbnb data for Merredin. Explore detailed analytics beyond this report to refine your investment strategy, optimize pricing, and maximize your vacation rental profits.
Explore Advanced MetricsMerredin Short-Term Rental Market Composition (2025): Property & Room Types
Room Type Distribution
Property Type Distribution
Market Composition Insights for Merredin
- The Merredin Airbnb market composition is heavily skewed towards Entire Home/Apt listings, which make up 82.6% of the 23 active rentals. This indicates strong guest preference for privacy and space.
- Looking at the property type distribution in Merredin, House properties are the most common (69.6%), reflecting the local real estate landscape.
- Houses represent a significant 69.6% portion, catering likely to families or larger groups.
- The presence of 21.7% Hotel/Boutique listings indicates integration with traditional hospitality.
- Smaller segments like apartment/condo, outdoor/unique (combined 8.6%) offer potential for unique stay experiences.
Merredin Airbnb Room Capacity Analysis (2025): Bedroom Distribution
Distribution of Listings by Number of Bedrooms
Room Capacity Insights for Merredin
- The dominant room capacity in Merredin is 3 bedrooms listings, making up 43.5% of the market. This suggests a strong demand for properties suitable for families or small groups.
- Together, 3 bedrooms and 2 bedrooms properties represent 69.6% of the active Airbnb listings in Merredin, indicating a high concentration in these sizes.
- A significant 56.5% of listings offer 3+ bedrooms, catering to larger groups and families seeking more space in Merredin.
Merredin Vacation Rental Guest Capacity Trends (2025)
Distribution of Listings by Guest Capacity
Guest Capacity Insights for Merredin
- The most common guest capacity trend in Merredin vacation rentals is listings accommodating 6 guests (30.4%). This suggests the primary traveler segment is likely larger groups.
- Properties designed for 6 guests and 4 guests dominate the Merredin STR market, accounting for 52.1% of listings.
- 56.5% of properties accommodate 6+ guests, serving the market segment for larger families or group travel in Merredin.
- On average, properties in Merredin are equipped to host 5.2 guests.
Merredin Airbnb Booking Patterns (2025): Available vs. Booked Days
Available Days Distribution
Booked Days Distribution
Booking Pattern Insights for Merredin
- The most common availability pattern in Merredin falls within the 271-366 days range, representing 60.9% of listings. This suggests many properties have significant open periods on their calendars.
- Approximately 87.0% of listings show high availability (181+ days open annually), indicating potential for increased bookings or specific owner usage patterns.
- For booked days, the 31-90 days range is most frequent in Merredin (30.4%), reflecting common guest stay durations or potential owner blocking patterns.
- A notable 17.4% of properties secure long booking periods (181+ days booked per year), highlighting successful long-term rental strategies or significant owner usage.
Merredin Airbnb Minimum Stay Requirements Analysis
Distribution of Listings by Minimum Night Requirement
1 Night
13 listings
59.1% of total
2 Nights
3 listings
13.6% of total
3 Nights
1 listings
4.5% of total
7-29 Nights
1 listings
4.5% of total
30+ Nights
4 listings
18.2% of total
Key Insights
- The most prevalent minimum stay requirement in Merredin is 1 Night, adopted by 59.1% of listings. This highlights the market's preference for shorter, flexible bookings.
- A strong majority (72.7%) of the Merredin Airbnb data shows acceptance of very short stays (1-2 nights), indicating a dynamic, high-turnover market.
- A significant segment (18.2%) caters to monthly stays (30+ nights) in Merredin, pointing to opportunities in the extended-stay market.
Recommendations
- Align with the market by considering a 1 Night minimum stay, as 59.1% of Merredin hosts use this setting.
- Explore offering discounts for stays of 30+ nights to attract the 18.2% of the market seeking extended stays.
- Adjust minimum nights based on seasonality – potentially shorter during low season and longer during peak demand periods in Merredin.
Merredin Airbnb Cancellation Policy Trends Analysis (2025)
Flexible
3 listings
17.6% of total
Moderate
7 listings
41.2% of total
Firm
3 listings
17.6% of total
Strict
4 listings
23.5% of total
Cancellation Policy Insights for Merredin
- The prevailing Airbnb cancellation policy trend in Merredin is Moderate, used by 41.2% of listings.
- There's a relatively balanced mix between guest-friendly (58.8%) and stricter (41.1%) policies, offering choices for different guest needs.
Recommendations for Hosts
- Consider adopting a Moderate policy to align with the 41.2% market standard in Merredin.
- Regularly review your cancellation policy against competitors and market demand shifts in Merredin.
Merredin STR Booking Lead Time Analysis (2025)
Average Booking Lead Time by Month
Booking Lead Time Insights for Merredin
- The overall average booking lead time for vacation rentals in Merredin is 32 days.
- Guests book furthest in advance for stays during June (average 64 days), likely coinciding with peak travel demand or local events.
- The shortest booking windows occur for stays in August (average 20 days), indicating more last-minute travel plans during this time.
- Seasonally, Spring (45 days avg.) sees the longest lead times, while Fall (30 days avg.) has the shortest, reflecting typical travel planning cycles.
Recommendations for Hosts
- Use the overall average lead time (32 days) as a baseline for your pricing and availability strategy in Merredin.
- For June stays, consider implementing length-of-stay discounts or slightly higher rates for bookings made less than 64 days out to capitalize on advance planning.
- Target marketing efforts for the Spring season well in advance (at least 45 days) to capture early planners.
- Monitor your own booking lead times against these Merredin averages to identify opportunities for dynamic pricing adjustments.
Popular & Essential Airbnb Amenities in Merredin (2025)
Amenity Prevalence
Amenity Insights for Merredin
- Essential amenities in Merredin that guests expect include: Air conditioning, TV, Free parking on premises, Washer. Lacking these (any) could significantly impact bookings.
- Popular amenities like Smoke alarm, Kitchen, Essentials are common but not universal. Offering these can provide a competitive edge.
- Warning: Wifi is not universally provided but is considered essential globally. Ensure reliable Wifi is offered.
Recommendations for Hosts
- Ensure your listing includes all essential amenities for Merredin: Air conditioning, TV, Free parking on premises, Washer.
- Prioritize adding missing essentials: Washer.
- Consider adding popular differentiators like Smoke alarm or Kitchen to increase appeal.
- Highlight unique or less common amenities you offer (e.g., hot tub, dedicated workspace, EV charger) in your listing description and photos.
- Regularly check competitor amenities in Merredin to stay competitive.
Merredin Airbnb Guest Demographics & Profile Analysis (2025)
Guest Profile Summary for Merredin
- The typical guest profile for Airbnb in Merredin consists of primarily domestic travelers (90%), often arriving from nearby Perth, typically belonging to the Post-2000s (Gen Z/Alpha) group (50%), primarily speaking English or French.
- Domestic travelers account for 89.8% of guests.
- Key international markets include Australia (89.8%) and United Kingdom (3.9%).
- Top languages spoken are English (74.1%) followed by French (5.2%).
- A significant demographic segment is the Post-2000s (Gen Z/Alpha) group, representing 50% of guests.
Recommendations for Hosts
- Target domestic marketing efforts towards travelers from Perth and Kalgoorlie - Boulder.
- Tailor amenities and listing descriptions to appeal to the dominant Post-2000s (Gen Z/Alpha) demographic (e.g., highlight fast WiFi, smart home features, local guides).
- Highlight unique local experiences or amenities relevant to the primary guest profile.
- Consider seasonal promotions aligned with peak travel times for key origin markets.
Nearby Short-Term Rental Market Comparison
How does the Merredin Airbnb market stack up against its neighbors? Compare key performance metrics like average monthly revenue, ADR, and occupancy rates in surrounding areas to understand the broader regional STR landscape.