Exmouth Airbnb Market Analysis 2025: Short Term Rental Data & Vacation Rental Statistics in Western Australia, Australia
Is Airbnb profitable in Exmouth in 2025? Explore comprehensive Airbnb analytics for Exmouth, Western Australia, Australia to uncover income potential. This 2025 STR market report for Exmouth, based on AirROI data from April 2024 to March 2025, reveals key trends in the niche market of 130 active listings.
Whether you're considering an Airbnb investment in Exmouth, optimizing your existing vacation rental, or exploring rental arbitrage opportunities, understanding the Exmouth Airbnb data is crucial. Navigating the high regulation landscape is key to maximizing your short term rental income potential. Let's dive into the specifics.
Key Exmouth Airbnb Performance Metrics Overview
Monthly Airbnb Revenue Variations & Income Potential in Exmouth (2025)
Understanding the monthly revenue variations for Airbnb listings in Exmouth is key to maximizing your short term rental income potential. Seasonality significantly impacts earnings. Our analysis, based on data from the past 12 months, shows that the peak revenue month for STRs in Exmouth is typically July, while February often presents the lowest earnings, highlighting opportunities for strategic pricing adjustments during shoulder and low seasons. Explore the typical Airbnb income in Exmouth across different performance tiers:
- Best-in-class properties (Top 10%) achieve $9,671+ monthly, often utilizing dynamic pricing and superior guest experiences.
- Strong performing properties (Top 25%) earn $6,371 or more, indicating effective management and desirable locations/amenities.
- Typical properties (Median) generate around $3,844 per month, representing the average market performance.
- Entry-level properties (Bottom 25%) see earnings around $1,990, often with potential for optimization.
Average Monthly Airbnb Earnings Trend in Exmouth
Exmouth Airbnb Occupancy Rate Trends (2025)
Maximize your bookings by understanding the Exmouth STR occupancy trends. Seasonal demand shifts significantly influence how often properties are booked. Typically, Julysees the highest demand (peak season occupancy), while February experiences the lowest (low season). Effective strategies, like adjusting minimum stays or offering promotions, can boost occupancy during slower periods. Here's how different property tiers perform in Exmouth:
- Best-in-class properties (Top 10%) achieve 84%+ occupancy, indicating high desirability and potentially optimized availability.
- Strong performing properties (Top 25%) maintain 68% or higher occupancy, suggesting good market fit and guest satisfaction.
- Typical properties (Median) have an occupancy rate around 47%.
- Entry-level properties (Bottom 25%) average 28% occupancy, potentially facing higher vacancy.
Average Monthly Occupancy Rate Trend in Exmouth
Average Daily Rate (ADR) Airbnb Trends in Exmouth (2025)
Effective short term rental pricing strategy in Exmouth involves understanding monthly ADR fluctuations. The Average Daily Rate (ADR) for Airbnb in Exmouth typically peaks in July and dips lowest during February. Leveraging Airbnb dynamic pricing tools or strategies based on this seasonality can significantly boost revenue. Here's a look at the typical nightly rates achieved:
- Best-in-class properties (Top 10%) command rates of $495+ per night, often due to premium features or locations.
- Strong performing properties (Top 25%) achieve nightly rates of $377 or more.
- Typical properties (Median) charge around $279 per night.
- Entry-level properties (Bottom 25%) earn around $201 per night.
Average Daily Rate (ADR) Trend by Month in Exmouth
Get Live Exmouth Market Intelligence 👇

Explore Real-time Analytics
Airbnb Seasonality Analysis & Trends in Exmouth (2025)
Peak Season (July, June, May)
- Revenue averages $6,667 per month
- Occupancy rates average 64.6%
- Daily rates average $326
Shoulder Season
- Revenue averages $4,678 per month
- Occupancy maintains around 48.7%
- Daily rates hold near $314
Low Season (February, March, November)
- Revenue drops to average $2,644 per month
- Occupancy decreases to average 31.3%
- Daily rates adjust to average $285
Seasonality Insights for Exmouth
- The Airbnb seasonality in Exmouth shows highly seasonal trends requiring careful strategy. While the sections above show seasonal averages, it's also insightful to look at the extremes:
- During the high season, the absolute peak month showcases Exmouth's highest earning potential, with monthly revenues capable of climbing to $7,384, occupancy reaching a high of 76.3%, and ADRs peaking at $328.
- Conversely, the slowest single month of the year, typically falling within the low season, marks the market's lowest point. In this month, revenue might dip to $2,219, occupancy could drop to 28.4%, and ADRs may adjust down to $275.
- Understanding both the seasonal averages and these monthly peaks and troughs in revenue, occupancy, and ADR is crucial for maximizing your Airbnb profit potential in Exmouth.
Seasonal Strategies for Maximizing Profit
- Peak Season: Maximize revenue through premium pricing and potentially longer minimum stays. Ensure high availability.
- Low Season: Offer competitive pricing, special promotions (e.g., extended stay discounts), and flexible cancellation policies. Target off-season travelers like remote workers or budget-conscious guests.
- Shoulder Seasons: Implement dynamic pricing that balances peak and low rates. Target weekend travelers or specific events. Offer slightly more flexible terms than peak season.
- Regularly analyze your own performance against these Exmouth seasonality benchmarks and adjust your pricing and availability strategy accordingly.
Best Areas for Airbnb Investment in Exmouth (2025)
Exploring the top neighborhoods for short-term rentals in Exmouth? This section highlights key areas, outlining why they are attractive for hosts and guests, along with notable local attractions. Consider these locations based on your target guest profile and investment strategy.
| Neighborhood / Area | Why Host Here? (Target Guests & Appeal) | Key Attractions & Landmarks |
|---|---|---|
| Town Beach | Exmouth's main beach area, popular for its beautiful waters and proximity to restaurants and shops. Ideal for tourists looking to enjoy seaside activities. | Town Beach, Exmouth Marina, Exmouth Golf Club, The Ningaloo Centre |
| Ningaloo Reef | Famous for its stunning coral reefs and marine life, perfect for snorkeling and diving enthusiasts. A prime location for tourists attracted to nature and adventure. | Ningaloo Reef, Turquoise Bay, Oyster Stacks, Snorkeling excursions, Fishing tours |
| Cape Range National Park | A stunning national park offering breathtaking landscapes, hiking trails, and wildlife observation. A popular area for nature lovers and outdoor enthusiasts. | Cape Range National Park, Bundegi Beach, Yardie Creek, Wildlife spotting |
| Exmouth Township | The central hub of Exmouth with shops, cafes, and community activities. Great for guests looking for convenience and local experiences. | Shops and cafes, Exmouth Markets, The Ningaloo Centre, Local events |
| Learmonth | Close to the airport and a gateway for travelers. Provides easy access to Exmouth and surrounding attractions, making it convenient for short stays. | Learmonth Airport, Pilgrim's Rest, Shark Bay |
| Mettam's Pool | A family-friendly area known for its calm waters and recreational facilities. Ideal for families and casual visitors looking for a relaxed beach day. | Mettam's Pool, Picnic areas, Shallow waters for kids |
| Ningaloo Lighthouse | Rich in history and offering majestic views of the coast. An interesting location for guests looking for a unique stay with ocean views. | Ningaloo Lighthouse, Historic lighthouse, Beach access |
| Exmouth Gulf | A scenic area known for its beautiful sunsets and outdoor activities such as fishing and boating. Popular with tourists looking for a tranquil getaway. | Exmouth Gulf excursions, Sunset viewing spots, Fishing opportunities |
Understanding Airbnb License Requirements & STR Laws in Exmouth (2025)
Yes, Exmouth, Western Australia, Australia enforces high STR regulations. Obtaining a license and ensuring compliance is almost certainly required according to current 2025 STR laws. Always verify the latest short term rental regulations and Airbnb license requirements directly with local government authorities for Exmouth to ensure full compliance before hosting.
(Source: AirROI data, 2025, based on 78% licensed listings)
Top Performing Airbnb Properties in Exmouth (2025)
Benchmark your potential! Explore examples of top-performing Airbnb properties in Exmouthbased on Trailing Twelve Month (TTM) revenue. Analyze their characteristics, revenue, occupancy rate, and ADR to understand what drives success in this market.

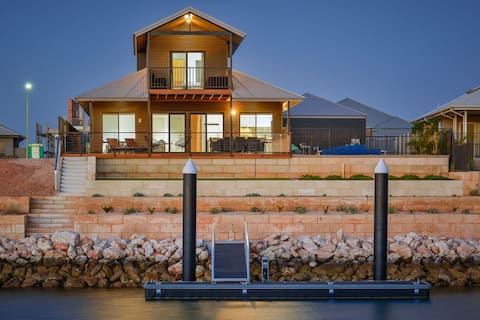
Gecko - On the Marina with Pool & Private Jetty
Entire Place • 4 bedrooms

34 Gnulli Court
Entire Place • 5 bedrooms

Kingfisher - The holiday home with everything
Entire Place • 4 bedrooms
Desert Rose -Jetty, Pool, WiFi and Foxtel
Entire Place • 4 bedrooms
Marlin is the perfect holiday base.
Entire Place • 4 bedrooms

Hooked - You'll be Hooked on this Beauty
Entire Place • 4 bedrooms
Note: Performance varies based on location, size, amenities, seasonality, and management quality. Data reflects the past 12 months.
Top Performing Airbnb Hosts in Exmouth (2025)
Learn from the best! This table showcases top-performing Airbnb hosts in Exmouth based on the number of properties managed and estimated total revenue over the past year. Analyze their scale and performance metrics.
| Host Name | Properties | Grossing Revenue | Stay Reviews | Avg Rating |
|---|---|---|---|---|
| Helen | 27 | $1,602,576 | 686 | 4.61/5.0 |
| Exmouth Holidays | 38 | $1,169,651 | 452 | 4.05/5.0 |
| Lynn | 3 | $263,106 | 108 | 4.61/5.0 |
| Fran | 1 | $151,018 | 40 | 4.93/5.0 |
| Jana | 2 | $145,418 | 220 | 4.83/5.0 |
| Kate | 2 | $127,789 | 27 | 4.97/5.0 |
| Yuniyati | 3 | $107,626 | 13 | 4.52/5.0 |
| Sascha | 4 | $99,570 | 91 | 5.00/5.0 |
| Melanie | 1 | $98,757 | 22 | 4.77/5.0 |
| Rozzi | 1 | $97,540 | 21 | 4.95/5.0 |
Analyzing the strategies of top hosts, such as their property selection, pricing, and guest communication, can offer valuable lessons for optimizing your own Airbnb operations in Exmouth.
Dive Deeper: Advanced Exmouth STR Market Data (2025)
Ready to unlock more insights? AirROI provides access to advanced metrics and comprehensive Airbnb data for Exmouth. Explore detailed analytics beyond this report to refine your investment strategy, optimize pricing, and maximize your vacation rental profits.
Explore Advanced MetricsExmouth Short-Term Rental Market Composition (2025): Property & Room Types
Room Type Distribution
Property Type Distribution
Market Composition Insights for Exmouth
- The Exmouth Airbnb market composition is heavily skewed towards Entire Home/Apt listings, which make up 88.5% of the 130 active rentals. This indicates strong guest preference for privacy and space.
- Looking at the property type distribution in Exmouth, House properties are the most common (90%), reflecting the local real estate landscape.
- Houses represent a significant 90% portion, catering likely to families or larger groups.
- Smaller segments like hotel/boutique, outdoor/unique, apartment/condo (combined 9.9%) offer potential for unique stay experiences.
Exmouth Airbnb Room Capacity Analysis (2025): Bedroom Distribution
Distribution of Listings by Number of Bedrooms
Room Capacity Insights for Exmouth
- The dominant room capacity in Exmouth is 3 bedrooms listings, making up 33.1% of the market. This suggests a strong demand for properties suitable for families or small groups.
- Together, 3 bedrooms and 4 bedrooms properties represent 57.7% of the active Airbnb listings in Exmouth, indicating a high concentration in these sizes.
- A significant 61.5% of listings offer 3+ bedrooms, catering to larger groups and families seeking more space in Exmouth.
Exmouth Vacation Rental Guest Capacity Trends (2025)
Distribution of Listings by Guest Capacity
Guest Capacity Insights for Exmouth
- The most common guest capacity trend in Exmouth vacation rentals is listings accommodating 8+ guests (36.2%). This suggests the primary traveler segment is likely larger groups.
- Properties designed for 8+ guests and 6 guests dominate the Exmouth STR market, accounting for 60.0% of listings.
- 62.3% of properties accommodate 6+ guests, serving the market segment for larger families or group travel in Exmouth.
- On average, properties in Exmouth are equipped to host 5.4 guests.
Exmouth Airbnb Booking Patterns (2025): Available vs. Booked Days
Available Days Distribution
Booked Days Distribution
Booking Pattern Insights for Exmouth
- The most common availability pattern in Exmouth falls within the 181-270 days range, representing 37.7% of listings. This suggests many properties have significant open periods on their calendars.
- Approximately 69.2% of listings show high availability (181+ days open annually), indicating potential for increased bookings or specific owner usage patterns.
- For booked days, the 91-180 days range is most frequent in Exmouth (40%), reflecting common guest stay durations or potential owner blocking patterns.
- A notable 31.5% of properties secure long booking periods (181+ days booked per year), highlighting successful long-term rental strategies or significant owner usage.
Exmouth Airbnb Minimum Stay Requirements Analysis
Distribution of Listings by Minimum Night Requirement
1 Night
3 listings
2.5% of total
2 Nights
21 listings
17.2% of total
3 Nights
41 listings
33.6% of total
4-6 Nights
19 listings
15.6% of total
7-29 Nights
4 listings
3.3% of total
30+ Nights
34 listings
27.9% of total
Key Insights
- The most prevalent minimum stay requirement in Exmouth is 3 Nights, adopted by 33.6% of listings. This highlights the market's preference for longer commitments.
- Very short stays (1-2 nights) are less common (19.7%), suggesting hosts prefer slightly longer bookings to optimize turnover.
- A significant segment (27.9%) caters to monthly stays (30+ nights) in Exmouth, pointing to opportunities in the extended-stay market.
Recommendations
- Align with the market by considering a 3 Nights minimum stay, as 33.6% of Exmouth hosts use this setting.
- If feasible, allowing 1-night stays, especially midweek or during low season, could capture last-minute bookings, as only 2.5% currently do.
- Explore offering discounts for stays of 30+ nights to attract the 27.9% of the market seeking extended stays.
- Adjust minimum nights based on seasonality – potentially shorter during low season and longer during peak demand periods in Exmouth.
Exmouth Airbnb Cancellation Policy Trends Analysis (2025)
Super Strict 60 Days
63 listings
51.2% of total
Super Strict 30 Days
1 listings
0.8% of total
Flexible
5 listings
4.1% of total
Moderate
5 listings
4.1% of total
Firm
26 listings
21.1% of total
Strict
23 listings
18.7% of total
Cancellation Policy Insights for Exmouth
- The prevailing Airbnb cancellation policy trend in Exmouth is Super Strict 60 Days, used by 51.2% of listings.
- There's a relatively balanced mix between guest-friendly (8.2%) and stricter (39.8%) policies, offering choices for different guest needs.
Recommendations for Hosts
- Consider adopting a Super Strict 60 Days policy to align with the 51.2% market standard in Exmouth.
- Regularly review your cancellation policy against competitors and market demand shifts in Exmouth.
Exmouth STR Booking Lead Time Analysis (2025)
Average Booking Lead Time by Month
Booking Lead Time Insights for Exmouth
- The overall average booking lead time for vacation rentals in Exmouth is 100 days.
- Guests book furthest in advance for stays during July (average 156 days), likely coinciding with peak travel demand or local events.
- The shortest booking windows occur for stays in February (average 68 days), indicating more last-minute travel plans during this time.
- Seasonally, Summer (126 days avg.) sees the longest lead times, while Winter (81 days avg.) has the shortest, reflecting typical travel planning cycles.
Recommendations for Hosts
- Use the overall average lead time (100 days) as a baseline for your pricing and availability strategy in Exmouth.
- For July stays, consider implementing length-of-stay discounts or slightly higher rates for bookings made less than 156 days out to capitalize on advance planning.
- Target marketing efforts for the Summer season well in advance (at least 126 days) to capture early planners.
- Monitor your own booking lead times against these Exmouth averages to identify opportunities for dynamic pricing adjustments.
Popular & Essential Airbnb Amenities in Exmouth (2025)
Amenity Prevalence
Amenity Insights for Exmouth
- Essential amenities in Exmouth that guests expect include: Air conditioning. Lacking these (this) could significantly impact bookings.
- Popular amenities like Washer, Bed linens, TV are common but not universal. Offering these can provide a competitive edge.
- Warning: Wifi is not universally provided but is considered essential globally. Ensure reliable Wifi is offered.
Recommendations for Hosts
- Ensure your listing includes all essential amenities for Exmouth: Air conditioning.
- Consider adding popular differentiators like Washer or Bed linens to increase appeal.
- Highlight unique or less common amenities you offer (e.g., hot tub, dedicated workspace, EV charger) in your listing description and photos.
- Regularly check competitor amenities in Exmouth to stay competitive.
Exmouth Airbnb Guest Demographics & Profile Analysis (2025)
Guest Profile Summary for Exmouth
- The typical guest profile for Airbnb in Exmouth consists of primarily domestic travelers (76%), often arriving from nearby Perth, typically belonging to the Post-2000s (Gen Z/Alpha) group (50%), primarily speaking English or German.
- Domestic travelers account for 75.6% of guests.
- Key international markets include Australia (75.6%) and United Kingdom (6.8%).
- Top languages spoken are English (67.6%) followed by German (6.8%).
- A significant demographic segment is the Post-2000s (Gen Z/Alpha) group, representing 50% of guests.
Recommendations for Hosts
- Target domestic marketing efforts towards travelers from Perth and Karratha.
- Tailor amenities and listing descriptions to appeal to the dominant Post-2000s (Gen Z/Alpha) demographic (e.g., highlight fast WiFi, smart home features, local guides).
- Highlight unique local experiences or amenities relevant to the primary guest profile.
- Consider seasonal promotions aligned with peak travel times for key origin markets.