East Victoria Park Airbnb Market Analysis 2025: Short Term Rental Data & Vacation Rental Statistics in Western Australia, Australia
Is Airbnb profitable in East Victoria Park in 2025? Explore comprehensive Airbnb analytics for East Victoria Park, Western Australia, Australia to uncover income potential. This 2025 STR market report for East Victoria Park, based on AirROI data from April 2024 to March 2025, reveals key trends in the niche market of 52 active listings.
Whether you're considering an Airbnb investment in East Victoria Park, optimizing your existing vacation rental, or exploring rental arbitrage opportunities, understanding the East Victoria Park Airbnb data is crucial. Navigating the high regulation landscape is key to maximizing your short term rental income potential. Let's dive into the specifics.
Key East Victoria Park Airbnb Performance Metrics Overview
Monthly Airbnb Revenue Variations & Income Potential in East Victoria Park (2025)
Understanding the monthly revenue variations for Airbnb listings in East Victoria Park is key to maximizing your short term rental income potential. Seasonality significantly impacts earnings. Our analysis, based on data from the past 12 months, shows that the peak revenue month for STRs in East Victoria Park is typically December, while August often presents the lowest earnings, highlighting opportunities for strategic pricing adjustments during shoulder and low seasons. Explore the typical Airbnb income in East Victoria Park across different performance tiers:
- Best-in-class properties (Top 10%) achieve $5,601+ monthly, often utilizing dynamic pricing and superior guest experiences.
- Strong performing properties (Top 25%) earn $4,081 or more, indicating effective management and desirable locations/amenities.
- Typical properties (Median) generate around $2,615 per month, representing the average market performance.
- Entry-level properties (Bottom 25%) see earnings around $1,137, often with potential for optimization.
Average Monthly Airbnb Earnings Trend in East Victoria Park
East Victoria Park Airbnb Occupancy Rate Trends (2025)
Maximize your bookings by understanding the East Victoria Park STR occupancy trends. Seasonal demand shifts significantly influence how often properties are booked. Typically, Novembersees the highest demand (peak season occupancy), while May experiences the lowest (low season). Effective strategies, like adjusting minimum stays or offering promotions, can boost occupancy during slower periods. Here's how different property tiers perform in East Victoria Park:
- Best-in-class properties (Top 10%) achieve 92%+ occupancy, indicating high desirability and potentially optimized availability.
- Strong performing properties (Top 25%) maintain 85% or higher occupancy, suggesting good market fit and guest satisfaction.
- Typical properties (Median) have an occupancy rate around 69%.
- Entry-level properties (Bottom 25%) average 41% occupancy, potentially facing higher vacancy.
Average Monthly Occupancy Rate Trend in East Victoria Park
Average Daily Rate (ADR) Airbnb Trends in East Victoria Park (2025)
Effective short term rental pricing strategy in East Victoria Park involves understanding monthly ADR fluctuations. The Average Daily Rate (ADR) for Airbnb in East Victoria Park typically peaks in December and dips lowest during August. Leveraging Airbnb dynamic pricing tools or strategies based on this seasonality can significantly boost revenue. Here's a look at the typical nightly rates achieved:
- Best-in-class properties (Top 10%) command rates of $223+ per night, often due to premium features or locations.
- Strong performing properties (Top 25%) achieve nightly rates of $166 or more.
- Typical properties (Median) charge around $108 per night.
- Entry-level properties (Bottom 25%) earn around $56 per night.
Average Daily Rate (ADR) Trend by Month in East Victoria Park
Get Live East Victoria Park Market Intelligence 👇

Explore Real-time Analytics
Airbnb Seasonality Analysis & Trends in East Victoria Park (2025)
Peak Season (December, November, January)
- Revenue averages $3,253 per month
- Occupancy rates average 63.1%
- Daily rates average $136
Shoulder Season
- Revenue averages $2,787 per month
- Occupancy maintains around 63.1%
- Daily rates hold near $117
Low Season (July, August, October)
- Revenue drops to average $2,506 per month
- Occupancy decreases to average 61.8%
- Daily rates adjust to average $111
Seasonality Insights for East Victoria Park
- The Airbnb seasonality in East Victoria Park shows moderate seasonality with distinct peak and low periods. While the sections above show seasonal averages, it's also insightful to look at the extremes:
- During the high season, the absolute peak month showcases East Victoria Park's highest earning potential, with monthly revenues capable of climbing to $3,519, occupancy reaching a high of 70.1%, and ADRs peaking at $142.
- Conversely, the slowest single month of the year, typically falling within the low season, marks the market's lowest point. In this month, revenue might dip to $2,413, occupancy could drop to 56.7%, and ADRs may adjust down to $110.
- Understanding both the seasonal averages and these monthly peaks and troughs in revenue, occupancy, and ADR is crucial for maximizing your Airbnb profit potential in East Victoria Park.
Seasonal Strategies for Maximizing Profit
- Peak Season: Maximize revenue through premium pricing and potentially longer minimum stays. Ensure high availability.
- Low Season: Offer competitive pricing, special promotions (e.g., extended stay discounts), and flexible cancellation policies. Target off-season travelers like remote workers or budget-conscious guests.
- Shoulder Seasons: Implement dynamic pricing that balances peak and low rates. Target weekend travelers or specific events. Offer slightly more flexible terms than peak season.
- Regularly analyze your own performance against these East Victoria Park seasonality benchmarks and adjust your pricing and availability strategy accordingly.
Best Areas for Airbnb Investment in East Victoria Park (2025)
Exploring the top neighborhoods for short-term rentals in East Victoria Park? This section highlights key areas, outlining why they are attractive for hosts and guests, along with notable local attractions. Consider these locations based on your target guest profile and investment strategy.
| Neighborhood / Area | Why Host Here? (Target Guests & Appeal) | Key Attractions & Landmarks |
|---|---|---|
| East Victoria Park | A vibrant suburb close to Perth city, known for its cafes, restaurants, and parks. It provides a mix of urban and suburban living, making it attractive for both tourists and long-term renters. | McCallum Park, The Balmoral Hotel, Victoria Park Farmers Market, Crown Perth, Perth Golf Centre, Echo Park |
| Burswood | An entertainment precinct with the Crown Casino and Optus Stadium, ideal for guests visiting for events and gaming. The area also features beautiful river views and parklands. | Crown Perth, Optus Stadium, Victoria Park Foreshore, Burswood Park, The Camfield, Perth Zoo |
| South Perth | A picturesque suburb across the river from Perth's CBD, known for its stunning views of the skyline and proximity to recreational areas. Popular with tourists and families. | South Perth Esplanade, Perth Zoo, Mends Street Jetty, Sir James Mitchell Park, The Old Mill, Jazz by the Bay |
| Nollamara | A growing suburb with affordable housing options, attracting families and individuals looking for proximity to the city. It offers various local amenities and parks. | Nollamara Park, Downs Park, Duncan Reserve, Karrinyup Shopping Centre, Mirrabooka Square |
| Tuart Hill | A suburban area with easy access to Perth city, known for its community vibe and parks. It's becoming popular for hosts targeting budget-conscious travelers. | Tuart Hill Community Centre, Parks and Recreation Facilities, Stirling Central Shopping Centre, Mirrabooka Shopping Centre |
| Mount Lawley | A trendy suburb known for its nightlife, cafes, and close proximity to the CBD. It's a prime location for young travelers looking for vibrant experiences. | Beaufort Street, Hyde Park, The Astor Theatre, Local bars and restaurants, Mount Lawley Golf Club |
| Maylands | An up-and-coming area with a mix of culture and nature, located near the Swan River. It's attractive for families and tourists looking for nature activities and local cafes. | Maylands Peninsula Golf Course, Swan River, Maylands Historical Society, Local Art Galleries, Cafes and Restaurants along 8th Avenue |
| Claremont | A high-end suburb known for its shopping center and proximity to the Swan River. Ideal for guests looking for a luxurious stay with access to fine dining and boutique shopping. | Claremont Quarter, Lake Claremont, Claremont Showground, Local parks and gardens, Swanbourne Beach |
Understanding Airbnb License Requirements & STR Laws in East Victoria Park (2025)
Yes, East Victoria Park, Western Australia, Australia enforces high STR regulations. Obtaining a license and ensuring compliance is almost certainly required according to current 2025 STR laws. Always verify the latest short term rental regulations and Airbnb license requirements directly with local government authorities for East Victoria Park to ensure full compliance before hosting.
(Source: AirROI data, 2025, based on 65% licensed listings)
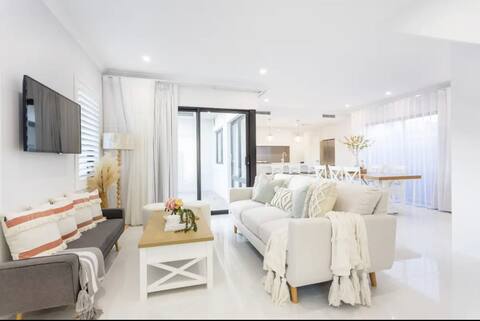
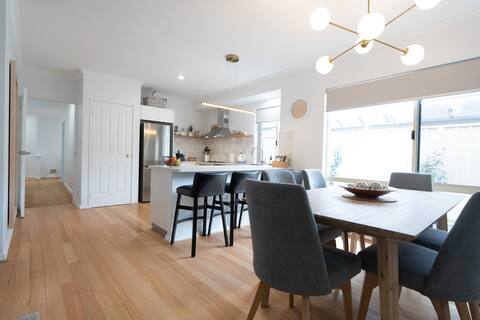
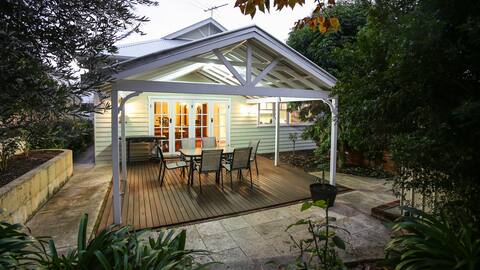
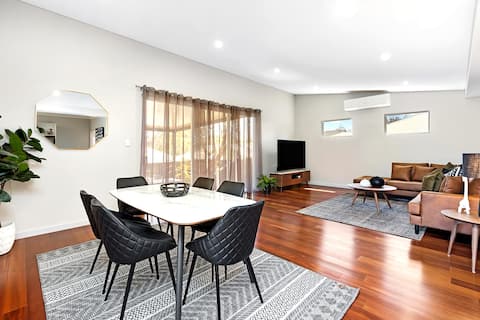
Top Performing Airbnb Properties in East Victoria Park (2025)
Benchmark your potential! Explore examples of top-performing Airbnb properties in East Victoria Parkbased on Trailing Twelve Month (TTM) revenue. Analyze their characteristics, revenue, occupancy rate, and ADR to understand what drives success in this market.
East Vic Park Lux New Home
Entire Place • 4 bedrooms

3 Unique Modern Vic Park Home sleeps 8
Entire Place • 4 bedrooms
“Hidden Gem”
Entire Place • 3 bedrooms
Exec 4 bedroom house central Perth
Entire Place • 4 bedrooms
Westminster Cottage! Near Albany Hwy Cafe Strip!
Entire Place • 3 bedrooms
Cafe Strip Home | Alfresco | 3BR
Entire Place • 3 bedrooms
Note: Performance varies based on location, size, amenities, seasonality, and management quality. Data reflects the past 12 months.
Top Performing Airbnb Hosts in East Victoria Park (2025)
Learn from the best! This table showcases top-performing Airbnb hosts in East Victoria Park based on the number of properties managed and estimated total revenue over the past year. Analyze their scale and performance metrics.
| Host Name | Properties | Grossing Revenue | Stay Reviews | Avg Rating |
|---|---|---|---|---|
| Jason | 4 | $163,253 | 608 | 4.78/5.0 |
| Phoebe | 2 | $91,242 | 87 | 4.71/5.0 |
| Mira | 1 | $71,485 | 27 | 4.78/5.0 |
| Szczepan | 1 | $69,710 | 92 | 5.00/5.0 |
| Magnus | 2 | $62,284 | 111 | 4.73/5.0 |
| Sue | 1 | $61,411 | 148 | 4.99/5.0 |
| Let Go | 1 | $60,839 | 48 | 4.54/5.0 |
| Aoife | 1 | $59,679 | 14 | 4.93/5.0 |
| Vikki | 1 | $58,115 | 26 | 5.00/5.0 |
| Matt | 1 | $46,870 | 56 | 4.89/5.0 |
Analyzing the strategies of top hosts, such as their property selection, pricing, and guest communication, can offer valuable lessons for optimizing your own Airbnb operations in East Victoria Park.
Dive Deeper: Advanced East Victoria Park STR Market Data (2025)
Ready to unlock more insights? AirROI provides access to advanced metrics and comprehensive Airbnb data for East Victoria Park. Explore detailed analytics beyond this report to refine your investment strategy, optimize pricing, and maximize your vacation rental profits.
Explore Advanced MetricsEast Victoria Park Short-Term Rental Market Composition (2025): Property & Room Types
Room Type Distribution
Property Type Distribution
Market Composition Insights for East Victoria Park
- The East Victoria Park Airbnb market composition is heavily skewed towards Entire Home/Apt listings, which make up 65.4% of the 52 active rentals. This indicates strong guest preference for privacy and space.
- However, a notable 32.7% share for Private Rooms suggests opportunities for budget-conscious travelers or hosts renting out spare rooms.
- Looking at the property type distribution in East Victoria Park, House properties are the most common (71.2%), reflecting the local real estate landscape.
- Houses represent a significant 71.2% portion, catering likely to families or larger groups.
- Smaller segments like hotel/boutique, others (combined 5.7%) offer potential for unique stay experiences.
East Victoria Park Airbnb Room Capacity Analysis (2025): Bedroom Distribution
Distribution of Listings by Number of Bedrooms
Room Capacity Insights for East Victoria Park
- The dominant room capacity in East Victoria Park is 1 bedroom listings, making up 36.5% of the market. This suggests a strong demand for properties suitable for couples or solo travelers.
- Together, 1 bedroom and 2 bedrooms properties represent 57.7% of the active Airbnb listings in East Victoria Park, indicating a high concentration in these sizes.
- A significant 23.1% of listings offer 3+ bedrooms, catering to larger groups and families seeking more space in East Victoria Park.
East Victoria Park Vacation Rental Guest Capacity Trends (2025)
Distribution of Listings by Guest Capacity
Guest Capacity Insights for East Victoria Park
- The most common guest capacity trend in East Victoria Park vacation rentals is listings accommodating 4 guests (21.2%). This suggests the primary traveler segment is likely small families or groups.
- Properties designed for 4 guests and 1 guest dominate the East Victoria Park STR market, accounting for 38.5% of listings.
- 21.1% of properties accommodate 6+ guests, serving the market segment for larger families or group travel in East Victoria Park.
- On average, properties in East Victoria Park are equipped to host 3.2 guests.
East Victoria Park Airbnb Booking Patterns (2025): Available vs. Booked Days
Available Days Distribution
Booked Days Distribution
Booking Pattern Insights for East Victoria Park
- The most common availability pattern in East Victoria Park falls within the 91-180 days range, representing 36.5% of listings. This suggests many properties have significant open periods on their calendars.
- Approximately 36.5% of listings show high availability (181+ days open annually), indicating potential for increased bookings or specific owner usage patterns.
- For booked days, the 181-270 days range is most frequent in East Victoria Park (38.5%), reflecting common guest stay durations or potential owner blocking patterns.
- A notable 67.3% of properties secure long booking periods (181+ days booked per year), highlighting successful long-term rental strategies or significant owner usage.
East Victoria Park Airbnb Minimum Stay Requirements Analysis
Distribution of Listings by Minimum Night Requirement
1 Night
7 listings
15.9% of total
2 Nights
8 listings
18.2% of total
3 Nights
5 listings
11.4% of total
4-6 Nights
11 listings
25% of total
7-29 Nights
2 listings
4.5% of total
30+ Nights
11 listings
25% of total
Key Insights
- The most prevalent minimum stay requirement in East Victoria Park is 4-6 Nights, adopted by 25% of listings. This highlights the market's preference for longer commitments.
- A significant segment (25%) caters to monthly stays (30+ nights) in East Victoria Park, pointing to opportunities in the extended-stay market.
Recommendations
- Align with the market by considering a 4-6 Nights minimum stay, as 25% of East Victoria Park hosts use this setting.
- If feasible, allowing 1-night stays, especially midweek or during low season, could capture last-minute bookings, as only 15.9% currently do.
- Explore offering discounts for stays of 30+ nights to attract the 25% of the market seeking extended stays.
- Adjust minimum nights based on seasonality – potentially shorter during low season and longer during peak demand periods in East Victoria Park.
East Victoria Park Airbnb Cancellation Policy Trends Analysis (2025)
Flexible
7 listings
15.6% of total
Moderate
19 listings
42.2% of total
Firm
5 listings
11.1% of total
Strict
14 listings
31.1% of total
Cancellation Policy Insights for East Victoria Park
- The prevailing Airbnb cancellation policy trend in East Victoria Park is Moderate, used by 42.2% of listings.
- There's a relatively balanced mix between guest-friendly (57.8%) and stricter (42.2%) policies, offering choices for different guest needs.
Recommendations for Hosts
- Consider adopting a Moderate policy to align with the 42.2% market standard in East Victoria Park.
- With 31.1% using Strict terms, this is a viable option in East Victoria Park, particularly for high-value properties or during peak demand periods.
- Regularly review your cancellation policy against competitors and market demand shifts in East Victoria Park.
East Victoria Park STR Booking Lead Time Analysis (2025)
Average Booking Lead Time by Month
Booking Lead Time Insights for East Victoria Park
- The overall average booking lead time for vacation rentals in East Victoria Park is 56 days.
- Guests book furthest in advance for stays during July (average 78 days), likely coinciding with peak travel demand or local events.
- The shortest booking windows occur for stays in February (average 45 days), indicating more last-minute travel plans during this time.
- Seasonally, Summer (68 days avg.) sees the longest lead times, while Fall (47 days avg.) has the shortest, reflecting typical travel planning cycles.
Recommendations for Hosts
- Use the overall average lead time (56 days) as a baseline for your pricing and availability strategy in East Victoria Park.
- For July stays, consider implementing length-of-stay discounts or slightly higher rates for bookings made less than 78 days out to capitalize on advance planning.
- Target marketing efforts for the Summer season well in advance (at least 68 days) to capture early planners.
- Monitor your own booking lead times against these East Victoria Park averages to identify opportunities for dynamic pricing adjustments.
Popular & Essential Airbnb Amenities in East Victoria Park (2025)
Amenity Prevalence
Amenity Insights for East Victoria Park
- Essential amenities in East Victoria Park that guests expect include: Wifi, TV, Air conditioning. Lacking these (any) could significantly impact bookings.
- Popular amenities like Kitchen, Smoke alarm, Washer are common but not universal. Offering these can provide a competitive edge.
Recommendations for Hosts
- Ensure your listing includes all essential amenities for East Victoria Park: Wifi, TV, Air conditioning.
- Prioritize adding missing essentials: TV, Air conditioning.
- Consider adding popular differentiators like Kitchen or Smoke alarm to increase appeal.
- Highlight unique or less common amenities you offer (e.g., hot tub, dedicated workspace, EV charger) in your listing description and photos.
- Regularly check competitor amenities in East Victoria Park to stay competitive.
East Victoria Park Airbnb Guest Demographics & Profile Analysis (2025)
Guest Profile Summary for East Victoria Park
- The typical guest profile for Airbnb in East Victoria Park consists of a mix of domestic (59%) and international guests, often arriving from nearby Perth, typically belonging to the Post-2000s (Gen Z/Alpha) group (50%), primarily speaking English or Chinese.
- Domestic travelers account for 59.4% of guests.
- Key international markets include Australia (59.4%) and Singapore (16.7%).
- Top languages spoken are English (58.8%) followed by Chinese (9.8%).
- A significant demographic segment is the Post-2000s (Gen Z/Alpha) group, representing 50% of guests.
Recommendations for Hosts
- Balance marketing efforts between domestic and international channels based on the guest mix.
- Tailor amenities and listing descriptions to appeal to the dominant Post-2000s (Gen Z/Alpha) demographic (e.g., highlight fast WiFi, smart home features, local guides).
- Highlight unique local experiences or amenities relevant to the primary guest profile.
- Consider seasonal promotions aligned with peak travel times for key origin markets.
Nearby Short-Term Rental Market Comparison
How does the East Victoria Park Airbnb market stack up against its neighbors? Compare key performance metrics like average monthly revenue, ADR, and occupancy rates in surrounding areas to understand the broader regional STR landscape.
| Market | Active Properties | Monthly Revenue | Daily Rate | Avg. Occupancy |
|---|---|---|---|---|
| Cottesloe | 138 | $4,018 | $230.16 | 66% |
| Swanbourne | 10 | $3,608 | $326.94 | 49% |
| City of Mandurah | 29 | $2,989 | $218.84 | 46% |
| Shire Of Murray | 56 | $2,975 | $222.09 | 47% |
| Mosman Park | 49 | $2,967 | $195.80 | 64% |
| Mandurah | 387 | $2,963 | $241.70 | 48% |
| Dwellingup | 18 | $2,954 | $149.11 | 64% |
| South Fremantle | 74 | $2,896 | $177.02 | 61% |
| Shire Of Toodyay | 17 | $2,868 | $231.11 | 44% |
| North Fremantle | 29 | $2,821 | $189.18 | 62% |