Cowaramup Airbnb Market Analysis 2025: Short Term Rental Data & Vacation Rental Statistics in Western Australia, Australia
Is Airbnb profitable in Cowaramup in 2025? Explore comprehensive Airbnb analytics for Cowaramup, Western Australia, Australia to uncover income potential. This 2025 STR market report for Cowaramup, based on AirROI data from April 2024 to March 2025, reveals key trends in the niche market of 46 active listings.
Whether you're considering an Airbnb investment in Cowaramup, optimizing your existing vacation rental, or exploring rental arbitrage opportunities, understanding the Cowaramup Airbnb data is crucial. Navigating the high regulation landscape is key to maximizing your short term rental income potential. Let's dive into the specifics.
Key Cowaramup Airbnb Performance Metrics Overview
Monthly Airbnb Revenue Variations & Income Potential in Cowaramup (2025)
Understanding the monthly revenue variations for Airbnb listings in Cowaramup is key to maximizing your short term rental income potential. Seasonality significantly impacts earnings. Our analysis, based on data from the past 12 months, shows that the peak revenue month for STRs in Cowaramup is typically December, while February often presents the lowest earnings, highlighting opportunities for strategic pricing adjustments during shoulder and low seasons. Explore the typical Airbnb income in Cowaramup across different performance tiers:
- Best-in-class properties (Top 10%) achieve $8,016+ monthly, often utilizing dynamic pricing and superior guest experiences.
- Strong performing properties (Top 25%) earn $5,062 or more, indicating effective management and desirable locations/amenities.
- Typical properties (Median) generate around $2,981 per month, representing the average market performance.
- Entry-level properties (Bottom 25%) see earnings around $1,560, often with potential for optimization.
Average Monthly Airbnb Earnings Trend in Cowaramup
Cowaramup Airbnb Occupancy Rate Trends (2025)
Maximize your bookings by understanding the Cowaramup STR occupancy trends. Seasonal demand shifts significantly influence how often properties are booked. Typically, Aprilsees the highest demand (peak season occupancy), while August experiences the lowest (low season). Effective strategies, like adjusting minimum stays or offering promotions, can boost occupancy during slower periods. Here's how different property tiers perform in Cowaramup:
- Best-in-class properties (Top 10%) achieve 87%+ occupancy, indicating high desirability and potentially optimized availability.
- Strong performing properties (Top 25%) maintain 78% or higher occupancy, suggesting good market fit and guest satisfaction.
- Typical properties (Median) have an occupancy rate around 57%.
- Entry-level properties (Bottom 25%) average 36% occupancy, potentially facing higher vacancy.
Average Monthly Occupancy Rate Trend in Cowaramup
Average Daily Rate (ADR) Airbnb Trends in Cowaramup (2025)
Effective short term rental pricing strategy in Cowaramup involves understanding monthly ADR fluctuations. The Average Daily Rate (ADR) for Airbnb in Cowaramup typically peaks in January and dips lowest during May. Leveraging Airbnb dynamic pricing tools or strategies based on this seasonality can significantly boost revenue. Here's a look at the typical nightly rates achieved:
- Best-in-class properties (Top 10%) command rates of $414+ per night, often due to premium features or locations.
- Strong performing properties (Top 25%) achieve nightly rates of $252 or more.
- Typical properties (Median) charge around $170 per night.
- Entry-level properties (Bottom 25%) earn around $125 per night.
Average Daily Rate (ADR) Trend by Month in Cowaramup
Get Live Cowaramup Market Intelligence 👇

Explore Real-time Analytics
Airbnb Seasonality Analysis & Trends in Cowaramup (2025)
Peak Season (December, January, June)
- Revenue averages $4,384 per month
- Occupancy rates average 58.4%
- Daily rates average $223
Shoulder Season
- Revenue averages $3,721 per month
- Occupancy maintains around 56.1%
- Daily rates hold near $204
Low Season (February, March, August)
- Revenue drops to average $3,116 per month
- Occupancy decreases to average 49.3%
- Daily rates adjust to average $210
Seasonality Insights for Cowaramup
- The Airbnb seasonality in Cowaramup shows moderate seasonality with distinct peak and low periods. While the sections above show seasonal averages, it's also insightful to look at the extremes:
- During the high season, the absolute peak month showcases Cowaramup's highest earning potential, with monthly revenues capable of climbing to $4,673, occupancy reaching a high of 63.6%, and ADRs peaking at $235.
- Conversely, the slowest single month of the year, typically falling within the low season, marks the market's lowest point. In this month, revenue might dip to $2,894, occupancy could drop to 48.1%, and ADRs may adjust down to $197.
- Understanding both the seasonal averages and these monthly peaks and troughs in revenue, occupancy, and ADR is crucial for maximizing your Airbnb profit potential in Cowaramup.
Seasonal Strategies for Maximizing Profit
- Peak Season: Maximize revenue through premium pricing and potentially longer minimum stays. Ensure high availability.
- Low Season: Offer competitive pricing, special promotions (e.g., extended stay discounts), and flexible cancellation policies. Target off-season travelers like remote workers or budget-conscious guests.
- Shoulder Seasons: Implement dynamic pricing that balances peak and low rates. Target weekend travelers or specific events. Offer slightly more flexible terms than peak season.
- Regularly analyze your own performance against these Cowaramup seasonality benchmarks and adjust your pricing and availability strategy accordingly.
Best Areas for Airbnb Investment in Cowaramup (2025)
Exploring the top neighborhoods for short-term rentals in Cowaramup? This section highlights key areas, outlining why they are attractive for hosts and guests, along with notable local attractions. Consider these locations based on your target guest profile and investment strategy.
| Neighborhood / Area | Why Host Here? (Target Guests & Appeal) | Key Attractions & Landmarks |
|---|---|---|
| Cowaramup Town Center | The heart of Cowaramup, offering convenient access to local shops, restaurants, and attractions. It's a charming area ideal for guests who want to experience the rural atmosphere. | Cowaramup Beer Company, Cowaramup Village Market, Margaret River Chocolate Company, Local wineries, Bussell Highway |
| Margaret River Region | Famous for its stunning vineyards and breathtaking landscapes, this area attracts wine lovers and nature enthusiasts. Guests can enjoy wine tasting tours and outdoor activities. | Vasse Felix Winery, Leeuwin Estate, Margaret River Discovery Co., Beautiful beaches, Boranup Karri Forest |
| Gracetown | A picturesque beachside village located a short drive from Cowaramup. Popular among surfers and beachgoers, making it ideal for those seeking relaxation and outdoor adventures. | Gracetown Beach, Surfing spots, Breathtaking coastal views, Hiking trails, Fishing spots |
| Prevelly | A stunning beach area north of Margaret River, known for its surf breaks and stunning sunsets. It's a draw for tourists and backpackers looking for a beach getaway. | Prevelly Beach, Surfers Point, River mouth, Margaret River main surf breaks, Whale watching spots |
| Nannup | A charming town surrounded by forests and rolling hills, Nannup provides an escape into nature. It's great for guests who enjoy hiking and exploring local flora and fauna. | Nannup Heritage Park, Balingup-Nannup Heritage Trail, Nannup Flower and Garden Festival, Local markets, Horse riding adventures |
| Dunsborough | A popular destination known for its beautiful beaches and family-friendly environment. Dunsborough attracts families and outdoor enthusiasts seeking a coastal holiday. | Dunsborough Beach, Meelup Regional Park, Cape Naturaliste Lighthouse, Dining and shopping options, Nature trails |
| Yallingup | Beautiful coastal town with fabulous beaches and a mix of art galleries and wineries. Ideal for tourists seeking a blend of relaxation and culture. | Yallingup Beach, Ngilgi Cave, Yallingup Sculpture Park, Local wineries, Galleries |
| Busselton | Home to the famous Busselton Jetty, this town has great attractions and easy access to sandy beaches, making it a favorite for families and tourists alike. | Busselton Jetty, Underwater Observatory, Busselton Museum, Beaches, Parks and recreational areas |
Understanding Airbnb License Requirements & STR Laws in Cowaramup (2025)
Yes, Cowaramup, Western Australia, Australia enforces high STR regulations. Obtaining a license and ensuring compliance is almost certainly required according to current 2025 STR laws. Always verify the latest short term rental regulations and Airbnb license requirements directly with local government authorities for Cowaramup to ensure full compliance before hosting.
(Source: AirROI data, 2025, based on 78% licensed listings)
Top Performing Airbnb Properties in Cowaramup (2025)
Benchmark your potential! Explore examples of top-performing Airbnb properties in Cowaramupbased on Trailing Twelve Month (TTM) revenue. Analyze their characteristics, revenue, occupancy rate, and ADR to understand what drives success in this market.
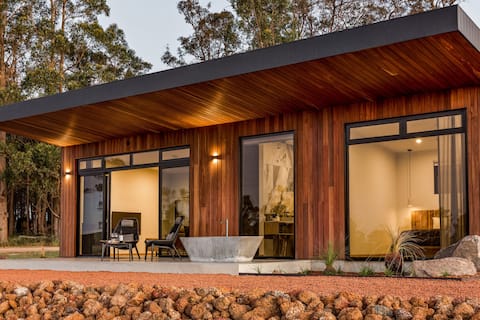
8 Paddocks Chalets, Cowaramup
Entire Place • 1 bedroom

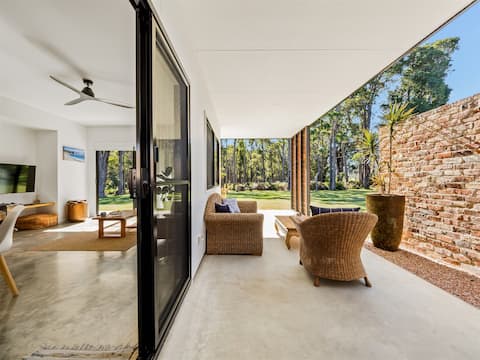
8 Paddocks Chalets, Cowaramup
Entire Place • 1 bedroom

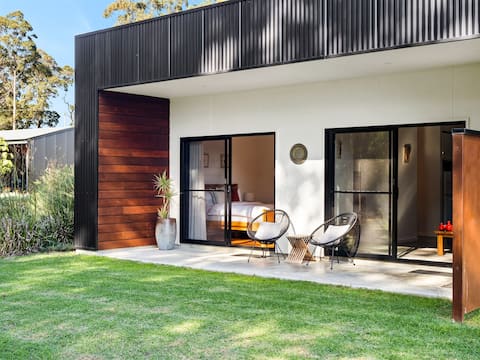
8 Paddocks Chalets, Cowaramup
Entire Place • 1 bedroom
King Chalets (x2) exemption - tourist development
Entire Place • 1 bedroom

8Paddocks Cottage, Cowaramup Margaret River Region
Entire Place • 2 bedrooms
Queen Chalet forest vista (exemption-tourist dev)
Entire Place • 1 bedroom
Note: Performance varies based on location, size, amenities, seasonality, and management quality. Data reflects the past 12 months.
Top Performing Airbnb Hosts in Cowaramup (2025)
Learn from the best! This table showcases top-performing Airbnb hosts in Cowaramup based on the number of properties managed and estimated total revenue over the past year. Analyze their scale and performance metrics.
| Host Name | Properties | Grossing Revenue | Stay Reviews | Avg Rating |
|---|---|---|---|---|
| Kristie | 4 | $413,360 | 347 | 4.99/5.0 |
| Simone | 2 | $163,149 | 390 | 5.00/5.0 |
| Jos | 4 | $156,520 | 286 | 4.91/5.0 |
| John | 2 | $131,116 | 546 | 4.95/5.0 |
| Lara | 2 | $101,266 | 40 | 4.89/5.0 |
| Vanessa | 5 | $98,280 | 6 | 1.00/5.0 |
| Emma | 2 | $81,471 | 398 | 4.94/5.0 |
| Oliver | 1 | $69,182 | 70 | 5.00/5.0 |
| Wayne | 1 | $54,482 | 327 | 4.92/5.0 |
| Rachael & Andrew | 1 | $48,410 | 271 | 4.95/5.0 |
Analyzing the strategies of top hosts, such as their property selection, pricing, and guest communication, can offer valuable lessons for optimizing your own Airbnb operations in Cowaramup.
Dive Deeper: Advanced Cowaramup STR Market Data (2025)
Ready to unlock more insights? AirROI provides access to advanced metrics and comprehensive Airbnb data for Cowaramup. Explore detailed analytics beyond this report to refine your investment strategy, optimize pricing, and maximize your vacation rental profits.
Explore Advanced MetricsCowaramup Short-Term Rental Market Composition (2025): Property & Room Types
Room Type Distribution
Property Type Distribution
Market Composition Insights for Cowaramup
- The Cowaramup Airbnb market composition is heavily skewed towards Entire Home/Apt listings, which make up 84.8% of the 46 active rentals. This indicates strong guest preference for privacy and space.
- Looking at the property type distribution in Cowaramup, House properties are the most common (41.3%), reflecting the local real estate landscape.
- Houses represent a significant 41.3% portion, catering likely to families or larger groups.
- The presence of 10.9% Hotel/Boutique listings indicates integration with traditional hospitality.
Cowaramup Airbnb Room Capacity Analysis (2025): Bedroom Distribution
Distribution of Listings by Number of Bedrooms
Room Capacity Insights for Cowaramup
- The dominant room capacity in Cowaramup is 1 bedroom listings, making up 58.7% of the market. This suggests a strong demand for properties suitable for couples or solo travelers.
- Together, 1 bedroom and 2 bedrooms properties represent 82.6% of the active Airbnb listings in Cowaramup, indicating a high concentration in these sizes.
- With over half the market (58.7%) consisting of studios or 1-bedroom units, Cowaramup is particularly well-suited for individuals or couples.
Cowaramup Vacation Rental Guest Capacity Trends (2025)
Distribution of Listings by Guest Capacity
Guest Capacity Insights for Cowaramup
- The most common guest capacity trend in Cowaramup vacation rentals is listings accommodating 2 guests (56.5%). This suggests the primary traveler segment is likely couples or solo travelers.
- Properties designed for 2 guests and 4 guests dominate the Cowaramup STR market, accounting for 69.5% of listings.
- A significant 56.5% of listings cater specifically to 1-2 guests, highlighting strong demand from couples and solo travelers in Cowaramup.
- 17.4% of properties accommodate 6+ guests, serving the market segment for larger families or group travel in Cowaramup.
- On average, properties in Cowaramup are equipped to host 3.3 guests.
Cowaramup Airbnb Booking Patterns (2025): Available vs. Booked Days
Available Days Distribution
Booked Days Distribution
Booking Pattern Insights for Cowaramup
- The most common availability pattern in Cowaramup falls within the 91-180 days range, representing 32.6% of listings. This suggests many properties have significant open periods on their calendars.
- Approximately 43.5% of listings show high availability (181+ days open annually), indicating potential for increased bookings or specific owner usage patterns.
- For booked days, the 181-270 days range is most frequent in Cowaramup (30.4%), reflecting common guest stay durations or potential owner blocking patterns.
- A notable 58.7% of properties secure long booking periods (181+ days booked per year), highlighting successful long-term rental strategies or significant owner usage.
Cowaramup Airbnb Minimum Stay Requirements Analysis
Distribution of Listings by Minimum Night Requirement
1 Night
1 listings
2.2% of total
2 Nights
17 listings
37% of total
3 Nights
4 listings
8.7% of total
4-6 Nights
1 listings
2.2% of total
7-29 Nights
5 listings
10.9% of total
30+ Nights
18 listings
39.1% of total
Key Insights
- The most prevalent minimum stay requirement in Cowaramup is 30+ Nights, adopted by 39.1% of listings. This highlights the market's preference for longer commitments.
- A significant segment (39.1%) caters to monthly stays (30+ nights) in Cowaramup, pointing to opportunities in the extended-stay market.
Recommendations
- Align with the market by considering a 30+ Nights minimum stay, as 39.1% of Cowaramup hosts use this setting.
- If feasible, allowing 1-night stays, especially midweek or during low season, could capture last-minute bookings, as only 2.2% currently do.
- A 2-night minimum appears standard (37%). Consider this for weekends or peak periods.
- Explore offering discounts for stays of 30+ nights to attract the 39.1% of the market seeking extended stays.
- Adjust minimum nights based on seasonality – potentially shorter during low season and longer during peak demand periods in Cowaramup.
Cowaramup Airbnb Cancellation Policy Trends Analysis (2025)
Super Strict 30 Days
1 listings
2.4% of total
Flexible
3 listings
7.1% of total
Moderate
13 listings
31% of total
Firm
11 listings
26.2% of total
Strict
14 listings
33.3% of total
Cancellation Policy Insights for Cowaramup
- The prevailing Airbnb cancellation policy trend in Cowaramup is Strict, used by 33.3% of listings.
- A majority (59.5%) of hosts in Cowaramup utilize Firm or Strict policies, indicating a market where hosts prioritize booking security.
Recommendations for Hosts
- Consider adopting a Strict policy to align with the 33.3% market standard in Cowaramup.
- With 33.3% using Strict terms, this is a viable option in Cowaramup, particularly for high-value properties or during peak demand periods.
- Regularly review your cancellation policy against competitors and market demand shifts in Cowaramup.
Cowaramup STR Booking Lead Time Analysis (2025)
Average Booking Lead Time by Month
Booking Lead Time Insights for Cowaramup
- The overall average booking lead time for vacation rentals in Cowaramup is 60 days.
- Guests book furthest in advance for stays during December (average 94 days), likely coinciding with peak travel demand or local events.
- The shortest booking windows occur for stays in August (average 44 days), indicating more last-minute travel plans during this time.
- Seasonally, Winter (77 days avg.) sees the longest lead times, while Summer (50 days avg.) has the shortest, reflecting typical travel planning cycles.
Recommendations for Hosts
- Use the overall average lead time (60 days) as a baseline for your pricing and availability strategy in Cowaramup.
- For December stays, consider implementing length-of-stay discounts or slightly higher rates for bookings made less than 94 days out to capitalize on advance planning.
- Target marketing efforts for the Winter season well in advance (at least 77 days) to capture early planners.
- Monitor your own booking lead times against these Cowaramup averages to identify opportunities for dynamic pricing adjustments.
Popular & Essential Airbnb Amenities in Cowaramup (2025)
Amenity Prevalence
Amenity Insights for Cowaramup
- Essential amenities in Cowaramup that guests expect include: Free parking on premises, Essentials, Smoke alarm. Lacking these (any) could significantly impact bookings.
- Popular amenities like Hot water, Heating, Hangers are common but not universal. Offering these can provide a competitive edge.
Recommendations for Hosts
- Ensure your listing includes all essential amenities for Cowaramup: Free parking on premises, Essentials, Smoke alarm.
- Prioritize adding missing essentials: Free parking on premises, Essentials, Smoke alarm.
- Consider adding popular differentiators like Hot water or Heating to increase appeal.
- Highlight unique or less common amenities you offer (e.g., hot tub, dedicated workspace, EV charger) in your listing description and photos.
- Regularly check competitor amenities in Cowaramup to stay competitive.
Cowaramup Airbnb Guest Demographics & Profile Analysis (2025)
Guest Profile Summary for Cowaramup
- The typical guest profile for Airbnb in Cowaramup consists of primarily domestic travelers (82%), often arriving from nearby Perth, typically belonging to the Post-2000s (Gen Z/Alpha) group (50%), primarily speaking English or Chinese.
- Domestic travelers account for 82.1% of guests.
- Key international markets include Australia (82.1%) and Singapore (8.5%).
- Top languages spoken are English (66.7%) followed by Chinese (6.5%).
- A significant demographic segment is the Post-2000s (Gen Z/Alpha) group, representing 50% of guests.
Recommendations for Hosts
- Target domestic marketing efforts towards travelers from Perth and Western Australia.
- Tailor amenities and listing descriptions to appeal to the dominant Post-2000s (Gen Z/Alpha) demographic (e.g., highlight fast WiFi, smart home features, local guides).
- Highlight unique local experiences or amenities relevant to the primary guest profile.
- Consider seasonal promotions aligned with peak travel times for key origin markets.
Nearby Short-Term Rental Market Comparison
How does the Cowaramup Airbnb market stack up against its neighbors? Compare key performance metrics like average monthly revenue, ADR, and occupancy rates in surrounding areas to understand the broader regional STR landscape.
| Market | Active Properties | Monthly Revenue | Daily Rate | Avg. Occupancy |
|---|---|---|---|---|
| Gracetown | 34 | $4,562 | $358.38 | 47% |
| Margaret River | 410 | $3,882 | $218.78 | 61% |
| Shire Of Augusta Margaret River | 96 | $3,824 | $252.66 | 56% |
| Gnarabup | 88 | $3,791 | $265.86 | 52% |
| Prevelly | 41 | $3,790 | $238.98 | 57% |
| Dunsborough | 446 | $3,762 | $289.15 | 48% |
| Yallingup | 238 | $3,754 | $334.67 | 46% |
| Witchcliffe | 20 | $3,753 | $304.52 | 56% |
| Peppermint Grove Beach | 35 | $3,750 | $326.50 | 39% |
| City Of Busselton | 535 | $3,637 | $301.10 | 44% |