Como Airbnb Market Analysis 2025: Short Term Rental Data & Vacation Rental Statistics in Western Australia, Australia
Is Airbnb profitable in Como in 2025? Explore comprehensive Airbnb analytics for Como, Western Australia, Australia to uncover income potential. This 2025 STR market report for Como, based on AirROI data from April 2024 to March 2025, reveals key trends in the niche market of 25 active listings.
Whether you're considering an Airbnb investment in Como, optimizing your existing vacation rental, or exploring rental arbitrage opportunities, understanding the Como Airbnb data is crucial. Navigating the high regulation landscape is key to maximizing your short term rental income potential. Let's dive into the specifics.
Key Como Airbnb Performance Metrics Overview
Monthly Airbnb Revenue Variations & Income Potential in Como (2025)
Understanding the monthly revenue variations for Airbnb listings in Como is key to maximizing your short term rental income potential. Seasonality significantly impacts earnings. Our analysis, based on data from the past 12 months, shows that the peak revenue month for STRs in Como is typically December, while March often presents the lowest earnings, highlighting opportunities for strategic pricing adjustments during shoulder and low seasons. Explore the typical Airbnb income in Como across different performance tiers:
- Best-in-class properties (Top 10%) achieve $4,901+ monthly, often utilizing dynamic pricing and superior guest experiences.
- Strong performing properties (Top 25%) earn $4,085 or more, indicating effective management and desirable locations/amenities.
- Typical properties (Median) generate around $2,606 per month, representing the average market performance.
- Entry-level properties (Bottom 25%) see earnings around $1,364, often with potential for optimization.
Average Monthly Airbnb Earnings Trend in Como
Como Airbnb Occupancy Rate Trends (2025)
Maximize your bookings by understanding the Como STR occupancy trends. Seasonal demand shifts significantly influence how often properties are booked. Typically, Junesees the highest demand (peak season occupancy), while March experiences the lowest (low season). Effective strategies, like adjusting minimum stays or offering promotions, can boost occupancy during slower periods. Here's how different property tiers perform in Como:
- Best-in-class properties (Top 10%) achieve 92%+ occupancy, indicating high desirability and potentially optimized availability.
- Strong performing properties (Top 25%) maintain 82% or higher occupancy, suggesting good market fit and guest satisfaction.
- Typical properties (Median) have an occupancy rate around 63%.
- Entry-level properties (Bottom 25%) average 33% occupancy, potentially facing higher vacancy.
Average Monthly Occupancy Rate Trend in Como
Average Daily Rate (ADR) Airbnb Trends in Como (2025)
Effective short term rental pricing strategy in Como involves understanding monthly ADR fluctuations. The Average Daily Rate (ADR) for Airbnb in Como typically peaks in December and dips lowest during May. Leveraging Airbnb dynamic pricing tools or strategies based on this seasonality can significantly boost revenue. Here's a look at the typical nightly rates achieved:
- Best-in-class properties (Top 10%) command rates of $194+ per night, often due to premium features or locations.
- Strong performing properties (Top 25%) achieve nightly rates of $165 or more.
- Typical properties (Median) charge around $129 per night.
- Entry-level properties (Bottom 25%) earn around $86 per night.
Average Daily Rate (ADR) Trend by Month in Como
Get Live Como Market Intelligence 👇

Explore Real-time Analytics
Airbnb Seasonality Analysis & Trends in Como (2025)
Peak Season (December, June, May)
- Revenue averages $3,229 per month
- Occupancy rates average 63.2%
- Daily rates average $132
Shoulder Season
- Revenue averages $2,833 per month
- Occupancy maintains around 59.9%
- Daily rates hold near $133
Low Season (February, March, August)
- Revenue drops to average $2,504 per month
- Occupancy decreases to average 52.6%
- Daily rates adjust to average $134
Seasonality Insights for Como
- The Airbnb seasonality in Como shows moderate seasonality with distinct peak and low periods. While the sections above show seasonal averages, it's also insightful to look at the extremes:
- During the high season, the absolute peak month showcases Como's highest earning potential, with monthly revenues capable of climbing to $3,296, occupancy reaching a high of 66.4%, and ADRs peaking at $145.
- Conversely, the slowest single month of the year, typically falling within the low season, marks the market's lowest point. In this month, revenue might dip to $2,332, occupancy could drop to 48.4%, and ADRs may adjust down to $125.
- Understanding both the seasonal averages and these monthly peaks and troughs in revenue, occupancy, and ADR is crucial for maximizing your Airbnb profit potential in Como.
Seasonal Strategies for Maximizing Profit
- Peak Season: Maximize revenue through premium pricing and potentially longer minimum stays. Ensure high availability.
- Low Season: Offer competitive pricing, special promotions (e.g., extended stay discounts), and flexible cancellation policies. Target off-season travelers like remote workers or budget-conscious guests.
- Shoulder Seasons: Implement dynamic pricing that balances peak and low rates. Target weekend travelers or specific events. Offer slightly more flexible terms than peak season.
- Regularly analyze your own performance against these Como seasonality benchmarks and adjust your pricing and availability strategy accordingly.
Best Areas for Airbnb Investment in Como (2025)
Exploring the top neighborhoods for short-term rentals in Como? This section highlights key areas, outlining why they are attractive for hosts and guests, along with notable local attractions. Consider these locations based on your target guest profile and investment strategy.
| Neighborhood / Area | Why Host Here? (Target Guests & Appeal) | Key Attractions & Landmarks |
|---|---|---|
| Como Beach | Picturesque beach area popular with families and holidaymakers. Ideal for relaxing by the water and enjoying water sports. | Como Beach, South Perth Foreshore, Mends Street Jetty, Elizabeth Quay, Perth Zoo |
| Canning River Foreshore | Scenic riverside area great for outdoor activities like walking, cycling, and picnicking. Attracts nature lovers and families. | Canning River Regional Park, Hendy Country Park, Bicton Wetlands, Como Jet Ski |
| Como Market | Vibrant market area with shops and eateries. Perfect for locals and tourists looking to experience the local culture and cuisine. | Como Farmers Market, Tastes of Como, Local boutiques, Cafes and restaurants |
| Perth Mint | Historic site and popular attraction showcasing gold mining history. A unique experience for tourists exploring Western Australia's heritage. | The Perth Mint, Gold exhibitions, Historic building tours |
| Royal Perth Golf Club | Prestigious golf club offering stunning greens and facilities. Attracts golf enthusiasts and serves as a unique venue for visitors. | Royal Perth Golf Club, Golf tournaments, Club facilities |
| South Perth Zoo | One of Australia's oldest zoos set in beautiful gardens by the river, ideal for family outings and nature exploration. | Perth Zoo, Animal encounters, Scenic river views |
| McDougall Park | Tranquil park equipped with walking trails, playgrounds, and picnic spots. Great for families and nature lovers. | Playgrounds, Walking paths, Picnic areas |
| Waterford Plaza | Local shopping center with various retail options, dining, and entertainment. Convenient for families and short-term visitors. | Shopping stores, Cinema, Restaurants |
Understanding Airbnb License Requirements & STR Laws in Como (2025)
Yes, Como, Western Australia, Australia enforces high STR regulations. Obtaining a license and ensuring compliance is almost certainly required according to current 2025 STR laws. Always verify the latest short term rental regulations and Airbnb license requirements directly with local government authorities for Como to ensure full compliance before hosting.
(Source: AirROI data, 2025, based on 72% licensed listings)
Top Performing Airbnb Properties in Como (2025)
Benchmark your potential! Explore examples of top-performing Airbnb properties in Comobased on Trailing Twelve Month (TTM) revenue. Analyze their characteristics, revenue, occupancy rate, and ADR to understand what drives success in this market.

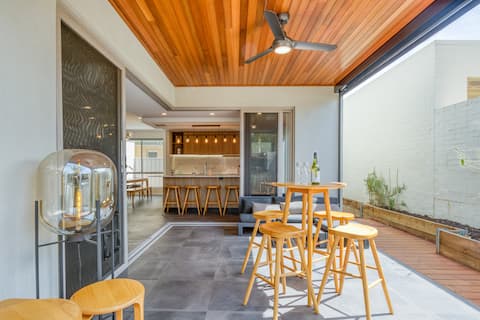
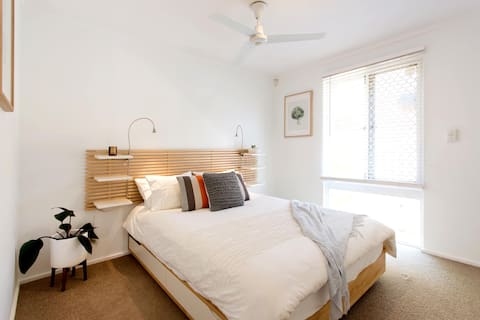
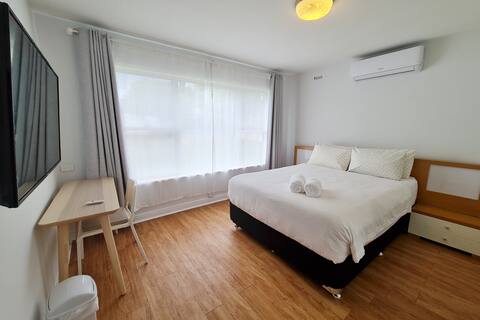
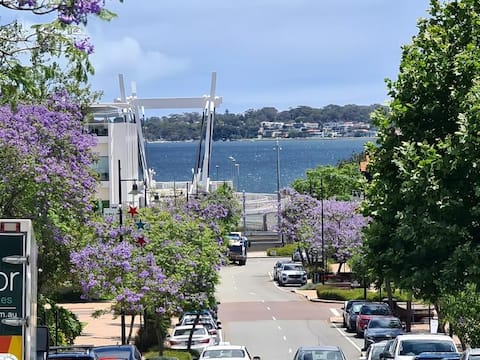
Modern Spacious 3X2 with Views
Entire Place • 3 bedrooms
Como Sora: A Breezy, Tranquil Oasis on the Coast
Entire Place • 4 bedrooms
Cottage of Plenty, Private Villa- South Perth/Como
Entire Place • 2 bedrooms
Quokka Inn Residences - Unit 1
Entire Place • 2 bedrooms
Home Away from Home 2
Entire Place • 3 bedrooms
Portrait Of A Lady
Entire Place • 2 bedrooms
Note: Performance varies based on location, size, amenities, seasonality, and management quality. Data reflects the past 12 months.
Top Performing Airbnb Hosts in Como (2025)
Learn from the best! This table showcases top-performing Airbnb hosts in Como based on the number of properties managed and estimated total revenue over the past year. Analyze their scale and performance metrics.
| Host Name | Properties | Grossing Revenue | Stay Reviews | Avg Rating |
|---|---|---|---|---|
| Laura | 4 | $139,426 | 143 | 4.54/5.0 |
| Lena | 1 | $65,530 | 99 | 4.89/5.0 |
| Host #99804294 | 1 | $62,057 | 62 | 4.97/5.0 |
| Carmel | 4 | $39,757 | 328 | 4.72/5.0 |
| Felipe | 1 | $39,294 | 265 | 4.88/5.0 |
| Jon | 1 | $38,751 | 49 | 4.88/5.0 |
| Tony & Mel | 1 | $37,822 | 8 | 4.63/5.0 |
| Chenfei | 1 | $34,273 | 41 | 4.61/5.0 |
| Kate | 2 | $30,815 | 131 | 2.47/5.0 |
| Executive Escapes | 1 | $30,406 | 16 | 4.19/5.0 |
Analyzing the strategies of top hosts, such as their property selection, pricing, and guest communication, can offer valuable lessons for optimizing your own Airbnb operations in Como.
Dive Deeper: Advanced Como STR Market Data (2025)
Ready to unlock more insights? AirROI provides access to advanced metrics and comprehensive Airbnb data for Como. Explore detailed analytics beyond this report to refine your investment strategy, optimize pricing, and maximize your vacation rental profits.
Explore Advanced MetricsComo Short-Term Rental Market Composition (2025): Property & Room Types
Room Type Distribution
Property Type Distribution
Market Composition Insights for Como
- The Como Airbnb market composition is heavily skewed towards Entire Home/Apt listings, which make up 72% of the 25 active rentals. This indicates strong guest preference for privacy and space.
- Looking at the property type distribution in Como, House properties are the most common (56%), reflecting the local real estate landscape.
- Houses represent a significant 56% portion, catering likely to families or larger groups.
- The presence of 8% Hotel/Boutique listings indicates integration with traditional hospitality.
Como Airbnb Room Capacity Analysis (2025): Bedroom Distribution
Distribution of Listings by Number of Bedrooms
Room Capacity Insights for Como
- The dominant room capacity in Como is 2 bedrooms listings, making up 44% of the market. This suggests a strong demand for properties suitable for couples or solo travelers.
- Together, 2 bedrooms and 3 bedrooms properties represent 68.0% of the active Airbnb listings in Como, indicating a high concentration in these sizes.
- A significant 28.0% of listings offer 3+ bedrooms, catering to larger groups and families seeking more space in Como.
Como Vacation Rental Guest Capacity Trends (2025)
Distribution of Listings by Guest Capacity
Guest Capacity Insights for Como
- The most common guest capacity trend in Como vacation rentals is listings accommodating 4 guests (28%). This suggests the primary traveler segment is likely small families or groups.
- Properties designed for 4 guests and 6 guests dominate the Como STR market, accounting for 52.0% of listings.
- 28.0% of properties accommodate 6+ guests, serving the market segment for larger families or group travel in Como.
- On average, properties in Como are equipped to host 3.7 guests.
Como Airbnb Booking Patterns (2025): Available vs. Booked Days
Available Days Distribution
Booked Days Distribution
Booking Pattern Insights for Como
- The most common availability pattern in Como falls within the 91-180 days range, representing 44% of listings. This suggests many properties have significant open periods on their calendars.
- Approximately 48.0% of listings show high availability (181+ days open annually), indicating potential for increased bookings or specific owner usage patterns.
- For booked days, the 181-270 days range is most frequent in Como (48%), reflecting common guest stay durations or potential owner blocking patterns.
- A notable 56.0% of properties secure long booking periods (181+ days booked per year), highlighting successful long-term rental strategies or significant owner usage.
Como Airbnb Minimum Stay Requirements Analysis
Distribution of Listings by Minimum Night Requirement
1 Night
1 listings
4.5% of total
2 Nights
6 listings
27.3% of total
3 Nights
5 listings
22.7% of total
4-6 Nights
2 listings
9.1% of total
7-29 Nights
2 listings
9.1% of total
30+ Nights
6 listings
27.3% of total
Key Insights
- The most prevalent minimum stay requirement in Como is 2 Nights, adopted by 27.3% of listings. This highlights the market's preference for shorter, flexible bookings.
- A significant segment (27.3%) caters to monthly stays (30+ nights) in Como, pointing to opportunities in the extended-stay market.
Recommendations
- Align with the market by considering a 2 Nights minimum stay, as 27.3% of Como hosts use this setting.
- If feasible, allowing 1-night stays, especially midweek or during low season, could capture last-minute bookings, as only 4.5% currently do.
- Explore offering discounts for stays of 30+ nights to attract the 27.3% of the market seeking extended stays.
- Adjust minimum nights based on seasonality – potentially shorter during low season and longer during peak demand periods in Como.
Como Airbnb Cancellation Policy Trends Analysis (2025)
Super Strict 60 Days
1 listings
4.8% of total
Super Strict 30 Days
2 listings
9.5% of total
Flexible
1 listings
4.8% of total
Moderate
3 listings
14.3% of total
Firm
4 listings
19% of total
Strict
10 listings
47.6% of total
Cancellation Policy Insights for Como
- The prevailing Airbnb cancellation policy trend in Como is Strict, used by 47.6% of listings.
- A majority (66.6%) of hosts in Como utilize Firm or Strict policies, indicating a market where hosts prioritize booking security.
Recommendations for Hosts
- Consider adopting a Strict policy to align with the 47.6% market standard in Como.
- With 47.6% using Strict terms, this is a viable option in Como, particularly for high-value properties or during peak demand periods.
- Regularly review your cancellation policy against competitors and market demand shifts in Como.
Como STR Booking Lead Time Analysis (2025)
Average Booking Lead Time by Month
Booking Lead Time Insights for Como
- The overall average booking lead time for vacation rentals in Como is 52 days.
- Guests book furthest in advance for stays during October (average 72 days), likely coinciding with peak travel demand or local events.
- The shortest booking windows occur for stays in February (average 27 days), indicating more last-minute travel plans during this time.
- Seasonally, Fall (63 days avg.) sees the longest lead times, while Winter (46 days avg.) has the shortest, reflecting typical travel planning cycles.
Recommendations for Hosts
- Use the overall average lead time (52 days) as a baseline for your pricing and availability strategy in Como.
- For October stays, consider implementing length-of-stay discounts or slightly higher rates for bookings made less than 72 days out to capitalize on advance planning.
- Target marketing efforts for the Fall season well in advance (at least 63 days) to capture early planners.
- Monitor your own booking lead times against these Como averages to identify opportunities for dynamic pricing adjustments.
Popular & Essential Airbnb Amenities in Como (2025)
Amenity Prevalence
Amenity Insights for Como
- Essential amenities in Como that guests expect include: TV, Hair dryer, Wifi. Lacking these (any) could significantly impact bookings.
- Popular amenities like Iron, Heating, Hot water are common but not universal. Offering these can provide a competitive edge.
Recommendations for Hosts
- Ensure your listing includes all essential amenities for Como: TV, Hair dryer, Wifi.
- Prioritize adding missing essentials: Wifi.
- Consider adding popular differentiators like Iron or Heating to increase appeal.
- Highlight unique or less common amenities you offer (e.g., hot tub, dedicated workspace, EV charger) in your listing description and photos.
- Regularly check competitor amenities in Como to stay competitive.
Como Airbnb Guest Demographics & Profile Analysis (2025)
Guest Profile Summary for Como
- The typical guest profile for Airbnb in Como consists of a mix of domestic (54%) and international guests, often arriving from nearby Melbourne, typically belonging to the Post-2000s (Gen Z/Alpha) group (50%), primarily speaking English or Chinese.
- Domestic travelers account for 53.6% of guests.
- Key international markets include Australia (53.6%) and Singapore (16.7%).
- Top languages spoken are English (55.2%) followed by Chinese (11%).
- A significant demographic segment is the Post-2000s (Gen Z/Alpha) group, representing 50% of guests.
Recommendations for Hosts
- Balance marketing efforts between domestic and international channels based on the guest mix.
- Tailor amenities and listing descriptions to appeal to the dominant Post-2000s (Gen Z/Alpha) demographic (e.g., highlight fast WiFi, smart home features, local guides).
- Highlight unique local experiences or amenities relevant to the primary guest profile.
- Consider seasonal promotions aligned with peak travel times for key origin markets.
Nearby Short-Term Rental Market Comparison
How does the Como Airbnb market stack up against its neighbors? Compare key performance metrics like average monthly revenue, ADR, and occupancy rates in surrounding areas to understand the broader regional STR landscape.
| Market | Active Properties | Monthly Revenue | Daily Rate | Avg. Occupancy |
|---|---|---|---|---|
| Cottesloe | 138 | $4,018 | $230.16 | 66% |
| Swanbourne | 10 | $3,608 | $326.94 | 49% |
| City of Mandurah | 29 | $2,989 | $218.84 | 46% |
| Shire Of Murray | 56 | $2,975 | $222.09 | 47% |
| Mosman Park | 49 | $2,967 | $195.80 | 64% |
| Mandurah | 387 | $2,963 | $241.70 | 48% |
| Dwellingup | 18 | $2,954 | $149.11 | 64% |
| South Fremantle | 74 | $2,896 | $177.02 | 61% |
| Shire Of Toodyay | 17 | $2,868 | $231.11 | 44% |
| North Fremantle | 29 | $2,821 | $189.18 | 62% |