City of Rockingham Airbnb Market Analysis 2025: Short Term Rental Data & Vacation Rental Statistics in Western Australia, Australia
Is Airbnb profitable in City of Rockingham in 2025? Explore comprehensive Airbnb analytics for City of Rockingham, Western Australia, Australia to uncover income potential. This 2025 STR market report for City of Rockingham, based on AirROI data from April 2024 to March 2025, reveals key trends in the niche market of 80 active listings.
Whether you're considering an Airbnb investment in City of Rockingham, optimizing your existing vacation rental, or exploring rental arbitrage opportunities, understanding the City of Rockingham Airbnb data is crucial. Navigating the high regulation landscape is key to maximizing your short term rental income potential. Let's dive into the specifics.
Key City of Rockingham Airbnb Performance Metrics Overview
Monthly Airbnb Revenue Variations & Income Potential in City of Rockingham (2025)
Understanding the monthly revenue variations for Airbnb listings in City of Rockingham is key to maximizing your short term rental income potential. Seasonality significantly impacts earnings. Our analysis, based on data from the past 12 months, shows that the peak revenue month for STRs in City of Rockingham is typically December, while August often presents the lowest earnings, highlighting opportunities for strategic pricing adjustments during shoulder and low seasons. Explore the typical Airbnb income in City of Rockingham across different performance tiers:
- Best-in-class properties (Top 10%) achieve $5,606+ monthly, often utilizing dynamic pricing and superior guest experiences.
- Strong performing properties (Top 25%) earn $3,513 or more, indicating effective management and desirable locations/amenities.
- Typical properties (Median) generate around $2,097 per month, representing the average market performance.
- Entry-level properties (Bottom 25%) see earnings around $1,333, often with potential for optimization.
Average Monthly Airbnb Earnings Trend in City of Rockingham
City of Rockingham Airbnb Occupancy Rate Trends (2025)
Maximize your bookings by understanding the City of Rockingham STR occupancy trends. Seasonal demand shifts significantly influence how often properties are booked. Typically, Decembersees the highest demand (peak season occupancy), while June experiences the lowest (low season). Effective strategies, like adjusting minimum stays or offering promotions, can boost occupancy during slower periods. Here's how different property tiers perform in City of Rockingham:
- Best-in-class properties (Top 10%) achieve 91%+ occupancy, indicating high desirability and potentially optimized availability.
- Strong performing properties (Top 25%) maintain 80% or higher occupancy, suggesting good market fit and guest satisfaction.
- Typical properties (Median) have an occupancy rate around 60%.
- Entry-level properties (Bottom 25%) average 34% occupancy, potentially facing higher vacancy.
Average Monthly Occupancy Rate Trend in City of Rockingham
Average Daily Rate (ADR) Airbnb Trends in City of Rockingham (2025)
Effective short term rental pricing strategy in City of Rockingham involves understanding monthly ADR fluctuations. The Average Daily Rate (ADR) for Airbnb in City of Rockingham typically peaks in December and dips lowest during August. Leveraging Airbnb dynamic pricing tools or strategies based on this seasonality can significantly boost revenue. Here's a look at the typical nightly rates achieved:
- Best-in-class properties (Top 10%) command rates of $262+ per night, often due to premium features or locations.
- Strong performing properties (Top 25%) achieve nightly rates of $188 or more.
- Typical properties (Median) charge around $120 per night.
- Entry-level properties (Bottom 25%) earn around $78 per night.
Average Daily Rate (ADR) Trend by Month in City of Rockingham
Get Live City of Rockingham Market Intelligence 👇

Explore Real-time Analytics
Airbnb Seasonality Analysis & Trends in City of Rockingham (2025)
Peak Season (December, April, May)
- Revenue averages $3,238 per month
- Occupancy rates average 57.3%
- Daily rates average $150
Shoulder Season
- Revenue averages $2,714 per month
- Occupancy maintains around 57.2%
- Daily rates hold near $148
Low Season (February, March, August)
- Revenue drops to average $2,258 per month
- Occupancy decreases to average 54.5%
- Daily rates adjust to average $147
Seasonality Insights for City of Rockingham
- The Airbnb seasonality in City of Rockingham shows moderate seasonality with distinct peak and low periods. While the sections above show seasonal averages, it's also insightful to look at the extremes:
- During the high season, the absolute peak month showcases City of Rockingham's highest earning potential, with monthly revenues capable of climbing to $3,687, occupancy reaching a high of 66.3%, and ADRs peaking at $165.
- Conversely, the slowest single month of the year, typically falling within the low season, marks the market's lowest point. In this month, revenue might dip to $2,142, occupancy could drop to 45.8%, and ADRs may adjust down to $140.
- Understanding both the seasonal averages and these monthly peaks and troughs in revenue, occupancy, and ADR is crucial for maximizing your Airbnb profit potential in City of Rockingham.
Seasonal Strategies for Maximizing Profit
- Peak Season: Maximize revenue through premium pricing and potentially longer minimum stays. Ensure high availability.
- Low Season: Offer competitive pricing, special promotions (e.g., extended stay discounts), and flexible cancellation policies. Target off-season travelers like remote workers or budget-conscious guests.
- Shoulder Seasons: Implement dynamic pricing that balances peak and low rates. Target weekend travelers or specific events. Offer slightly more flexible terms than peak season.
- Regularly analyze your own performance against these City of Rockingham seasonality benchmarks and adjust your pricing and availability strategy accordingly.
Best Areas for Airbnb Investment in City of Rockingham (2025)
Exploring the top neighborhoods for short-term rentals in City of Rockingham? This section highlights key areas, outlining why they are attractive for hosts and guests, along with notable local attractions. Consider these locations based on your target guest profile and investment strategy.
| Neighborhood / Area | Why Host Here? (Target Guests & Appeal) | Key Attractions & Landmarks |
|---|---|---|
| Rockingham Foreshore | A scenic coastal area popular for its sandy beaches, parks, and water activities. Ideal for tourists looking to enjoy the sun, surf, and local cafes with picturesque views. | Rockingham Beach, Palm Beach, Point Peron, Penguin Island, Safety Bay, The Foreshore Park |
| Safety Bay | Known for its family-friendly atmosphere and water sports, Safety Bay attracts visitors interested in windsurfing, kite surfing, and relaxing on the beach. | Safety Bay Beach, Penguin Island ferry, Wind and Water School, Safety Bay Yacht Club |
| Peron Point | A hotspot for fishing and water sports, Peron Point offers opportunities for adventure seekers and families alike, making it a good investment area. | Peron Point Beach, Diving and snorkeling spots, Fishing jetty, Kite surfing area |
| Cooloongup | A suburban area close to several recreational facilities, Cooloongup is appealing for families and visitors seeking a quieter retreat. | Cooloongup Community Centre, Local parks, Nature walks, Easy access to shops and cafes |
| East Rockingham | A growing residential area with proximity to commercial zones, suitable for those seeking longer-term stays in a peaceful environment. | Rockingham Shopping Centre, Local parks, Nearby schools, Community events |
| Kwinana | A rapidly developing area offering affordability and access to major transport routes, appealing to travelers and those seeking convenience. | Kwinana Marketplace, Kwinana Adventure Park, Local public transport links |
| Baldivis | An emerging suburb known for its families and parks, Baldivis is perfect for longer stays with amenities for all ages. | Baldivis Community Centre, Local vineyards and farms, Parks and nature reserves |
| Mandurah | Just a short drive from Rockingham, Mandurah boasts a vibrant waterway and beach lifestyle, attracting a wide range of visitors. | Mandurah Ocean Marina, Dolphin Quay, Silver Sands Beach, Mandurah Wave |
Understanding Airbnb License Requirements & STR Laws in City of Rockingham (2025)
Yes, City of Rockingham, Western Australia, Australia enforces high STR regulations. Obtaining a license and ensuring compliance is almost certainly required according to current 2025 STR laws. Always verify the latest short term rental regulations and Airbnb license requirements directly with local government authorities for City of Rockingham to ensure full compliance before hosting.
(Source: AirROI data, 2025, based on 69% licensed listings)
Top Performing Airbnb Properties in City of Rockingham (2025)
Benchmark your potential! Explore examples of top-performing Airbnb properties in City of Rockinghambased on Trailing Twelve Month (TTM) revenue. Analyze their characteristics, revenue, occupancy rate, and ADR to understand what drives success in this market.
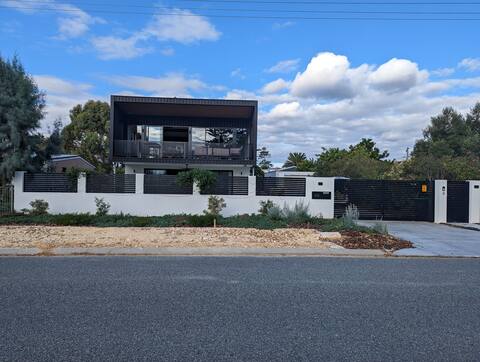
Beach Front Architectural Home
Entire Place • 6 bedrooms

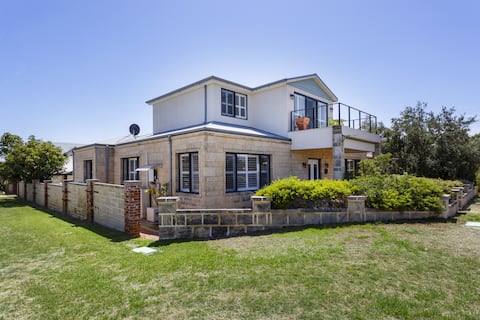
Rustic Beachfront Home / Villa near Perth Beach
Entire Place • 3 bedrooms
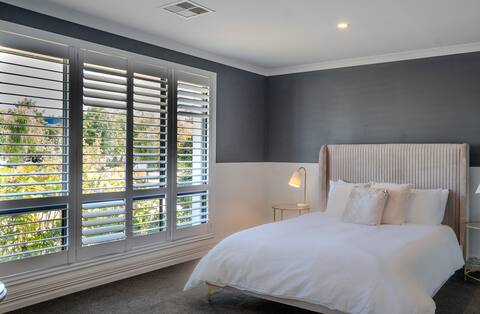
Dory's Beach House - Executive Escapes
Entire Place • 5 bedrooms

Slice of coastal bush paradise
Entire Place • 4 bedrooms
Casa DéHamptons in Baldivis
Entire Place • 4 bedrooms

Spacious Holiday Home with Pool
Entire Place • 4 bedrooms
Note: Performance varies based on location, size, amenities, seasonality, and management quality. Data reflects the past 12 months.
Top Performing Airbnb Hosts in City of Rockingham (2025)
Learn from the best! This table showcases top-performing Airbnb hosts in City of Rockingham based on the number of properties managed and estimated total revenue over the past year. Analyze their scale and performance metrics.
| Host Name | Properties | Grossing Revenue | Stay Reviews | Avg Rating |
|---|---|---|---|---|
| Yasmine | 4 | $160,244 | 156 | 4.84/5.0 |
| Executive Escapes | 4 | $157,142 | 21 | 4.45/5.0 |
| Stephanie | 1 | $138,162 | 19 | 4.53/5.0 |
| Elise | 1 | $79,187 | 16 | 4.81/5.0 |
| Brooke McIntosh | 1 | $61,611 | 7 | 4.86/5.0 |
| Air Coastal | 1 | $57,092 | 32 | 4.78/5.0 |
| Liz | 1 | $50,152 | 56 | 4.96/5.0 |
| Jade | 1 | $45,851 | 22 | 5.00/5.0 |
| Sarah | 1 | $45,106 | 33 | 4.79/5.0 |
| Locky | 1 | $43,726 | 29 | 4.97/5.0 |
Analyzing the strategies of top hosts, such as their property selection, pricing, and guest communication, can offer valuable lessons for optimizing your own Airbnb operations in City of Rockingham.
Dive Deeper: Advanced City of Rockingham STR Market Data (2025)
Ready to unlock more insights? AirROI provides access to advanced metrics and comprehensive Airbnb data for City of Rockingham. Explore detailed analytics beyond this report to refine your investment strategy, optimize pricing, and maximize your vacation rental profits.
Explore Advanced MetricsCity of Rockingham Short-Term Rental Market Composition (2025): Property & Room Types
Room Type Distribution
Property Type Distribution
Market Composition Insights for City of Rockingham
- The City of Rockingham Airbnb market composition is heavily skewed towards Entire Home/Apt listings, which make up 81.3% of the 80 active rentals. This indicates strong guest preference for privacy and space.
- Looking at the property type distribution in City of Rockingham, House properties are the most common (70%), reflecting the local real estate landscape.
- Houses represent a significant 70% portion, catering likely to families or larger groups.
- The presence of 12.5% Hotel/Boutique listings indicates integration with traditional hospitality.
City of Rockingham Airbnb Room Capacity Analysis (2025): Bedroom Distribution
Distribution of Listings by Number of Bedrooms
Room Capacity Insights for City of Rockingham
- The dominant room capacity in City of Rockingham is 2 bedrooms listings, making up 22.5% of the market. This suggests a strong demand for properties suitable for couples or solo travelers.
- Together, 2 bedrooms and 1 bedroom properties represent 43.8% of the active Airbnb listings in City of Rockingham, indicating a high concentration in these sizes.
- A significant 45.1% of listings offer 3+ bedrooms, catering to larger groups and families seeking more space in City of Rockingham.
City of Rockingham Vacation Rental Guest Capacity Trends (2025)
Distribution of Listings by Guest Capacity
Guest Capacity Insights for City of Rockingham
- The most common guest capacity trend in City of Rockingham vacation rentals is listings accommodating 8+ guests (22.5%). This suggests the primary traveler segment is likely larger groups.
- Properties designed for 8+ guests and 4 guests dominate the City of Rockingham STR market, accounting for 43.8% of listings.
- 42.6% of properties accommodate 6+ guests, serving the market segment for larger families or group travel in City of Rockingham.
- On average, properties in City of Rockingham are equipped to host 4.4 guests.
City of Rockingham Airbnb Booking Patterns (2025): Available vs. Booked Days
Available Days Distribution
Booked Days Distribution
Booking Pattern Insights for City of Rockingham
- The most common availability pattern in City of Rockingham falls within the 91-180 days range, representing 36.3% of listings. This suggests many properties have significant open periods on their calendars.
- Approximately 42.5% of listings show high availability (181+ days open annually), indicating potential for increased bookings or specific owner usage patterns.
- For booked days, the 181-270 days range is most frequent in City of Rockingham (36.3%), reflecting common guest stay durations or potential owner blocking patterns.
- A notable 57.6% of properties secure long booking periods (181+ days booked per year), highlighting successful long-term rental strategies or significant owner usage.
City of Rockingham Airbnb Minimum Stay Requirements Analysis
Distribution of Listings by Minimum Night Requirement
1 Night
13 listings
17.8% of total
2 Nights
16 listings
21.9% of total
3 Nights
14 listings
19.2% of total
4-6 Nights
11 listings
15.1% of total
7-29 Nights
3 listings
4.1% of total
30+ Nights
16 listings
21.9% of total
Key Insights
- The most prevalent minimum stay requirement in City of Rockingham is 2 Nights, adopted by 21.9% of listings. This highlights the market's preference for shorter, flexible bookings.
- A significant segment (21.9%) caters to monthly stays (30+ nights) in City of Rockingham, pointing to opportunities in the extended-stay market.
Recommendations
- Align with the market by considering a 2 Nights minimum stay, as 21.9% of City of Rockingham hosts use this setting.
- If feasible, allowing 1-night stays, especially midweek or during low season, could capture last-minute bookings, as only 17.8% currently do.
- Explore offering discounts for stays of 30+ nights to attract the 21.9% of the market seeking extended stays.
- Adjust minimum nights based on seasonality – potentially shorter during low season and longer during peak demand periods in City of Rockingham.
City of Rockingham Airbnb Cancellation Policy Trends Analysis (2025)
Super Strict 30 Days
4 listings
5.6% of total
Flexible
16 listings
22.5% of total
Moderate
25 listings
35.2% of total
Firm
12 listings
16.9% of total
Strict
14 listings
19.7% of total
Cancellation Policy Insights for City of Rockingham
- The prevailing Airbnb cancellation policy trend in City of Rockingham is Moderate, used by 35.2% of listings.
- There's a relatively balanced mix between guest-friendly (57.7%) and stricter (36.6%) policies, offering choices for different guest needs.
Recommendations for Hosts
- Consider adopting a Moderate policy to align with the 35.2% market standard in City of Rockingham.
- Regularly review your cancellation policy against competitors and market demand shifts in City of Rockingham.
City of Rockingham STR Booking Lead Time Analysis (2025)
Average Booking Lead Time by Month
Booking Lead Time Insights for City of Rockingham
- The overall average booking lead time for vacation rentals in City of Rockingham is 50 days.
- Guests book furthest in advance for stays during January (average 86 days), likely coinciding with peak travel demand or local events.
- The shortest booking windows occur for stays in July (average 37 days), indicating more last-minute travel plans during this time.
- Seasonally, Winter (77 days avg.) sees the longest lead times, while Summer (46 days avg.) has the shortest, reflecting typical travel planning cycles.
Recommendations for Hosts
- Use the overall average lead time (50 days) as a baseline for your pricing and availability strategy in City of Rockingham.
- For January stays, consider implementing length-of-stay discounts or slightly higher rates for bookings made less than 86 days out to capitalize on advance planning.
- Target marketing efforts for the Winter season well in advance (at least 77 days) to capture early planners.
- Monitor your own booking lead times against these City of Rockingham averages to identify opportunities for dynamic pricing adjustments.
Popular & Essential Airbnb Amenities in City of Rockingham (2025)
Amenity Prevalence
Amenity Insights for City of Rockingham
- Essential amenities in City of Rockingham that guests expect include: Free parking on premises, Smoke alarm. Lacking these (any) could significantly impact bookings.
- Popular amenities like Air conditioning, Kitchen, Heating are common but not universal. Offering these can provide a competitive edge.
- Warning: Wifi is not universally provided but is considered essential globally. Ensure reliable Wifi is offered.
Recommendations for Hosts
- Ensure your listing includes all essential amenities for City of Rockingham: Free parking on premises, Smoke alarm.
- Prioritize adding missing essentials: Free parking on premises, Smoke alarm.
- Consider adding popular differentiators like Air conditioning or Kitchen to increase appeal.
- Highlight unique or less common amenities you offer (e.g., hot tub, dedicated workspace, EV charger) in your listing description and photos.
- Regularly check competitor amenities in City of Rockingham to stay competitive.
City of Rockingham Airbnb Guest Demographics & Profile Analysis (2025)
Guest Profile Summary for City of Rockingham
- The typical guest profile for Airbnb in City of Rockingham consists of primarily domestic travelers (76%), often arriving from nearby Perth, typically belonging to the Post-2000s (Gen Z/Alpha) group (50%), primarily speaking English or Spanish.
- Domestic travelers account for 76.3% of guests.
- Key international markets include Australia (76.3%) and United Kingdom (5.5%).
- Top languages spoken are English (65.4%) followed by Spanish (4.4%).
- A significant demographic segment is the Post-2000s (Gen Z/Alpha) group, representing 50% of guests.
Recommendations for Hosts
- Target domestic marketing efforts towards travelers from Perth and Western Australia.
- Tailor amenities and listing descriptions to appeal to the dominant Post-2000s (Gen Z/Alpha) demographic (e.g., highlight fast WiFi, smart home features, local guides).
- Highlight unique local experiences or amenities relevant to the primary guest profile.
- Consider seasonal promotions aligned with peak travel times for key origin markets.
Nearby Short-Term Rental Market Comparison
How does the City of Rockingham Airbnb market stack up against its neighbors? Compare key performance metrics like average monthly revenue, ADR, and occupancy rates in surrounding areas to understand the broader regional STR landscape.
| Market | Active Properties | Monthly Revenue | Daily Rate | Avg. Occupancy |
|---|---|---|---|---|
| Gracetown | 34 | $4,562 | $358.38 | 47% |
| Cottesloe | 138 | $4,018 | $230.16 | 66% |
| Margaret River | 410 | $3,882 | $218.78 | 61% |
| Gnarabup | 88 | $3,791 | $265.86 | 52% |
| Prevelly | 41 | $3,790 | $238.98 | 57% |
| Dunsborough | 446 | $3,762 | $289.15 | 48% |
| Yallingup | 238 | $3,754 | $334.67 | 46% |
| Peppermint Grove Beach | 35 | $3,750 | $326.50 | 39% |
| City Of Busselton | 535 | $3,637 | $301.10 | 44% |
| Swanbourne | 10 | $3,608 | $326.95 | 49% |