City of Mandurah Airbnb Market Analysis 2025: Short Term Rental Data & Vacation Rental Statistics in Western Australia, Australia
Is Airbnb profitable in City of Mandurah in 2025? Explore comprehensive Airbnb analytics for City of Mandurah, Western Australia, Australia to uncover income potential. This 2025 STR market report for City of Mandurah, based on AirROI data from April 2024 to March 2025, reveals key trends in the niche market of 29 active listings.
Whether you're considering an Airbnb investment in City of Mandurah, optimizing your existing vacation rental, or exploring rental arbitrage opportunities, understanding the City of Mandurah Airbnb data is crucial. Navigating the high regulation landscape is key to maximizing your short term rental income potential. Let's dive into the specifics.
Key City of Mandurah Airbnb Performance Metrics Overview
Monthly Airbnb Revenue Variations & Income Potential in City of Mandurah (2025)
Understanding the monthly revenue variations for Airbnb listings in City of Mandurah is key to maximizing your short term rental income potential. Seasonality significantly impacts earnings. Our analysis, based on data from the past 12 months, shows that the peak revenue month for STRs in City of Mandurah is typically January, while August often presents the lowest earnings, highlighting opportunities for strategic pricing adjustments during shoulder and low seasons. Explore the typical Airbnb income in City of Mandurah across different performance tiers:
- Best-in-class properties (Top 10%) achieve $7,932+ monthly, often utilizing dynamic pricing and superior guest experiences.
- Strong performing properties (Top 25%) earn $4,923 or more, indicating effective management and desirable locations/amenities.
- Typical properties (Median) generate around $3,111 per month, representing the average market performance.
- Entry-level properties (Bottom 25%) see earnings around $1,730, often with potential for optimization.
Average Monthly Airbnb Earnings Trend in City of Mandurah
City of Mandurah Airbnb Occupancy Rate Trends (2025)
Maximize your bookings by understanding the City of Mandurah STR occupancy trends. Seasonal demand shifts significantly influence how often properties are booked. Typically, Januarysees the highest demand (peak season occupancy), while May experiences the lowest (low season). Effective strategies, like adjusting minimum stays or offering promotions, can boost occupancy during slower periods. Here's how different property tiers perform in City of Mandurah:
- Best-in-class properties (Top 10%) achieve 84%+ occupancy, indicating high desirability and potentially optimized availability.
- Strong performing properties (Top 25%) maintain 70% or higher occupancy, suggesting good market fit and guest satisfaction.
- Typical properties (Median) have an occupancy rate around 50%.
- Entry-level properties (Bottom 25%) average 30% occupancy, potentially facing higher vacancy.
Average Monthly Occupancy Rate Trend in City of Mandurah
Average Daily Rate (ADR) Airbnb Trends in City of Mandurah (2025)
Effective short term rental pricing strategy in City of Mandurah involves understanding monthly ADR fluctuations. The Average Daily Rate (ADR) for Airbnb in City of Mandurah typically peaks in December and dips lowest during August. Leveraging Airbnb dynamic pricing tools or strategies based on this seasonality can significantly boost revenue. Here's a look at the typical nightly rates achieved:
- Best-in-class properties (Top 10%) command rates of $420+ per night, often due to premium features or locations.
- Strong performing properties (Top 25%) achieve nightly rates of $264 or more.
- Typical properties (Median) charge around $171 per night.
- Entry-level properties (Bottom 25%) earn around $121 per night.
Average Daily Rate (ADR) Trend by Month in City of Mandurah
Get Live City of Mandurah Market Intelligence 👇

Explore Real-time Analytics
Airbnb Seasonality Analysis & Trends in City of Mandurah (2025)
Peak Season (January, December, April)
- Revenue averages $5,368 per month
- Occupancy rates average 61.0%
- Daily rates average $250
Shoulder Season
- Revenue averages $3,730 per month
- Occupancy maintains around 47.1%
- Daily rates hold near $217
Low Season (August, September, October)
- Revenue drops to average $2,690 per month
- Occupancy decreases to average 44.3%
- Daily rates adjust to average $198
Seasonality Insights for City of Mandurah
- The Airbnb seasonality in City of Mandurah shows highly seasonal trends requiring careful strategy. While the sections above show seasonal averages, it's also insightful to look at the extremes:
- During the high season, the absolute peak month showcases City of Mandurah's highest earning potential, with monthly revenues capable of climbing to $5,753, occupancy reaching a high of 66.9%, and ADRs peaking at $278.
- Conversely, the slowest single month of the year, typically falling within the low season, marks the market's lowest point. In this month, revenue might dip to $2,425, occupancy could drop to 39.4%, and ADRs may adjust down to $195.
- Understanding both the seasonal averages and these monthly peaks and troughs in revenue, occupancy, and ADR is crucial for maximizing your Airbnb profit potential in City of Mandurah.
Seasonal Strategies for Maximizing Profit
- Peak Season: Maximize revenue through premium pricing and potentially longer minimum stays. Ensure high availability.
- Low Season: Offer competitive pricing, special promotions (e.g., extended stay discounts), and flexible cancellation policies. Target off-season travelers like remote workers or budget-conscious guests.
- Shoulder Seasons: Implement dynamic pricing that balances peak and low rates. Target weekend travelers or specific events. Offer slightly more flexible terms than peak season.
- Regularly analyze your own performance against these City of Mandurah seasonality benchmarks and adjust your pricing and availability strategy accordingly.
Best Areas for Airbnb Investment in City of Mandurah (2025)
Exploring the top neighborhoods for short-term rentals in City of Mandurah? This section highlights key areas, outlining why they are attractive for hosts and guests, along with notable local attractions. Consider these locations based on your target guest profile and investment strategy.
| Neighborhood / Area | Why Host Here? (Target Guests & Appeal) | Key Attractions & Landmarks |
|---|---|---|
| Halls Head | Popular coastal suburb known for its stunning beaches and family-friendly atmosphere. Attracts tourists looking for a relaxing beach holiday with easy access to amenities and natural attractions. | Halls Head Beach, Mary Street Lagoon, Doddies Beach, Mathew Flinders Park, Halls Head Shopping Centre |
| Mandurah Marina | Vibrant waterfront area filled with dining, entertainment, and attractions. Ideal for tourists wanting a scenic experience with boat tours and lively nightlife options. | Mandurah Dolphin Cruises, Mandurah Ocean Marina, The Cut Golf Course, Cicerello's Mandurah, Mandurah Boardwalk |
| Pinnacles Drive | Scenic route leading to the famous Pinnacles Desert, attracting adventure seekers and nature lovers. Great for those who want an out-of-town experience with unique natural beauty. | Pinnacles Desert, Nambung National Park, Thirsty Point, Cervantes Village |
| Dawesville | Quieter coastal area known for its natural beauty and relaxed lifestyle. Perfect for families and retirees looking for a peaceful getaway near the beaches and estuary. | Suttons Beach, Dawesville Cut, Parkland areas, The Cut Golf Course |
| Falcon | A charming coastal community with beautiful beaches and a laid-back vibe. Attracts families and beach lovers looking for an affordable beach escape. | Falcon Bay Beach, Dawesville Channel, Coodanup Foreshore, Falcon Park |
| Lake Clifton | Known for its unique lake and natural attractions, perfect for eco-tourism and those seeking solitude in nature. Offers a tranquil environment close to nature reserves. | Lake Clifton, Thrombolites of Lake Clifton, Yalgorup National Park |
| Silver Sands | Beautiful beachside suburb ideal for those wanting easy beach access and proximity to local conveniences. Popular with families and tourists seeking sun and sand. | Silver Sands Beach, Mandurah Foreshore, Central Mandurah |
| Greenfields | Residential area attracting visitors looking for a more suburban experience while still having access to Mandurah’s attractions and amenities. | Parks and nature reserves, Mandurah Forum shopping center, local cafes and restaurants |
Understanding Airbnb License Requirements & STR Laws in City of Mandurah (2025)
Yes, City of Mandurah, Western Australia, Australia enforces high STR regulations. Obtaining a license and ensuring compliance is almost certainly required according to current 2025 STR laws. Always verify the latest short term rental regulations and Airbnb license requirements directly with local government authorities for City of Mandurah to ensure full compliance before hosting.
(Source: AirROI data, 2025, based on 62% licensed listings)
Top Performing Airbnb Properties in City of Mandurah (2025)
Benchmark your potential! Explore examples of top-performing Airbnb properties in City of Mandurahbased on Trailing Twelve Month (TTM) revenue. Analyze their characteristics, revenue, occupancy rate, and ADR to understand what drives success in this market.
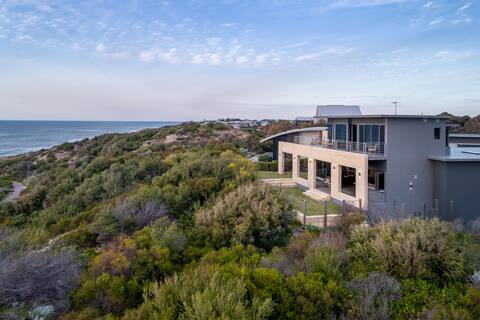
Oceanic I Private Properties
Entire Place • 3 bedrooms
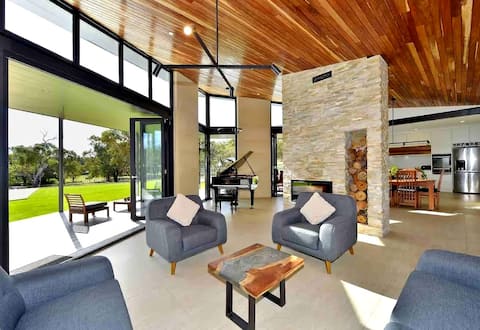
Gorgeous home with Infinity Pool & Fireplace
Entire Place • 5 bedrooms

Bush lake logfire sauna retreat Mandurah
Entire Place • 7 bedrooms
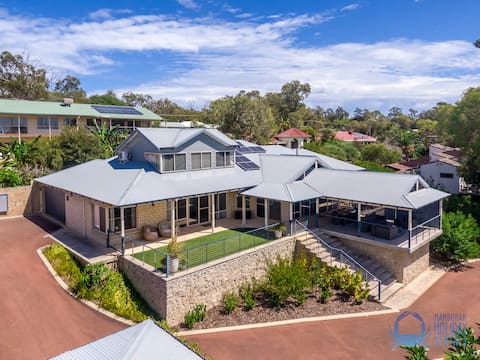
Rest & Recharge in Bouvard
Entire Place • 5 bedrooms
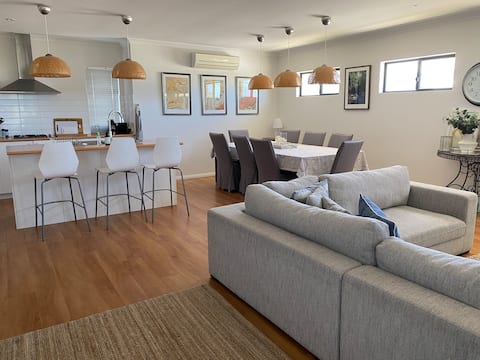
Beachfront Family Home
Entire Place • 4 bedrooms
Light & Bright Pet Friendly Beach Side Haven
Entire Place • 4 bedrooms
Note: Performance varies based on location, size, amenities, seasonality, and management quality. Data reflects the past 12 months.
Top Performing Airbnb Hosts in City of Mandurah (2025)
Learn from the best! This table showcases top-performing Airbnb hosts in City of Mandurah based on the number of properties managed and estimated total revenue over the past year. Analyze their scale and performance metrics.
| Host Name | Properties | Grossing Revenue | Stay Reviews | Avg Rating |
|---|---|---|---|---|
| Daniela | 4 | $172,983 | 115 | 4.67/5.0 |
| Shona | 2 | $117,804 | 12 | 4.75/5.0 |
| Host #117379039 | 1 | $117,728 | 0 | 0.00/5.0 |
| Miriam | 1 | $107,316 | 67 | 4.70/5.0 |
| Tom | 2 | $81,352 | 14 | 2.50/5.0 |
| Christie | 1 | $57,596 | 70 | 4.84/5.0 |
| Jana | 1 | $52,237 | 6 | 4.67/5.0 |
| Paul | 1 | $44,791 | 63 | 5.00/5.0 |
| Lundy | 1 | $35,880 | 49 | 4.78/5.0 |
| Jeanette | 1 | $33,549 | 15 | 4.93/5.0 |
Analyzing the strategies of top hosts, such as their property selection, pricing, and guest communication, can offer valuable lessons for optimizing your own Airbnb operations in City of Mandurah.
Dive Deeper: Advanced City of Mandurah STR Market Data (2025)
Ready to unlock more insights? AirROI provides access to advanced metrics and comprehensive Airbnb data for City of Mandurah. Explore detailed analytics beyond this report to refine your investment strategy, optimize pricing, and maximize your vacation rental profits.
Explore Advanced MetricsCity of Mandurah Short-Term Rental Market Composition (2025): Property & Room Types
Room Type Distribution
Property Type Distribution
Market Composition Insights for City of Mandurah
- The City of Mandurah Airbnb market composition is heavily skewed towards Entire Home/Apt listings, which make up 96.6% of the 29 active rentals. This indicates strong guest preference for privacy and space.
- Looking at the property type distribution in City of Mandurah, House properties are the most common (75.9%), reflecting the local real estate landscape.
- Houses represent a significant 75.9% portion, catering likely to families or larger groups.
- Smaller segments like apartment/condo, hotel/boutique (combined 6.8%) offer potential for unique stay experiences.
City of Mandurah Airbnb Room Capacity Analysis (2025): Bedroom Distribution
Distribution of Listings by Number of Bedrooms
Room Capacity Insights for City of Mandurah
- The dominant room capacity in City of Mandurah is 4 bedrooms listings, making up 37.9% of the market. This suggests a strong demand for properties suitable for families or small groups.
- Together, 4 bedrooms and 3 bedrooms properties represent 65.5% of the active Airbnb listings in City of Mandurah, indicating a high concentration in these sizes.
- A significant 82.7% of listings offer 3+ bedrooms, catering to larger groups and families seeking more space in City of Mandurah.
City of Mandurah Vacation Rental Guest Capacity Trends (2025)
Distribution of Listings by Guest Capacity
Guest Capacity Insights for City of Mandurah
- The most common guest capacity trend in City of Mandurah vacation rentals is listings accommodating 8+ guests (55.2%). This suggests the primary traveler segment is likely larger groups.
- Properties designed for 8+ guests and 6 guests dominate the City of Mandurah STR market, accounting for 75.9% of listings.
- 79.3% of properties accommodate 6+ guests, serving the market segment for larger families or group travel in City of Mandurah.
- On average, properties in City of Mandurah are equipped to host 6.4 guests.
City of Mandurah Airbnb Booking Patterns (2025): Available vs. Booked Days
Available Days Distribution
Booked Days Distribution
Booking Pattern Insights for City of Mandurah
- The most common availability pattern in City of Mandurah falls within the 91-180 days range, representing 41.4% of listings. This suggests many properties have significant open periods on their calendars.
- Approximately 55.1% of listings show high availability (181+ days open annually), indicating potential for increased bookings or specific owner usage patterns.
- For booked days, the 181-270 days range is most frequent in City of Mandurah (44.8%), reflecting common guest stay durations or potential owner blocking patterns.
- A notable 48.2% of properties secure long booking periods (181+ days booked per year), highlighting successful long-term rental strategies or significant owner usage.
City of Mandurah Airbnb Minimum Stay Requirements Analysis
Distribution of Listings by Minimum Night Requirement
2 Nights
12 listings
52.2% of total
3 Nights
1 listings
4.3% of total
30+ Nights
10 listings
43.5% of total
Key Insights
- The most prevalent minimum stay requirement in City of Mandurah is 2 Nights, adopted by 52.2% of listings. This highlights the market's preference for shorter, flexible bookings.
- A significant segment (43.5%) caters to monthly stays (30+ nights) in City of Mandurah, pointing to opportunities in the extended-stay market.
Recommendations
- Align with the market by considering a 2 Nights minimum stay, as 52.2% of City of Mandurah hosts use this setting.
- A 2-night minimum appears standard (52.2%). Consider this for weekends or peak periods.
- Explore offering discounts for stays of 30+ nights to attract the 43.5% of the market seeking extended stays.
- Adjust minimum nights based on seasonality – potentially shorter during low season and longer during peak demand periods in City of Mandurah.
City of Mandurah Airbnb Cancellation Policy Trends Analysis (2025)
Flexible
6 listings
26.1% of total
Moderate
7 listings
30.4% of total
Firm
1 listings
4.3% of total
Strict
9 listings
39.1% of total
Cancellation Policy Insights for City of Mandurah
- The prevailing Airbnb cancellation policy trend in City of Mandurah is Strict, used by 39.1% of listings.
- There's a relatively balanced mix between guest-friendly (56.5%) and stricter (43.4%) policies, offering choices for different guest needs.
Recommendations for Hosts
- Consider adopting a Strict policy to align with the 39.1% market standard in City of Mandurah.
- With 39.1% using Strict terms, this is a viable option in City of Mandurah, particularly for high-value properties or during peak demand periods.
- Regularly review your cancellation policy against competitors and market demand shifts in City of Mandurah.
City of Mandurah STR Booking Lead Time Analysis (2025)
Average Booking Lead Time by Month
Booking Lead Time Insights for City of Mandurah
- The overall average booking lead time for vacation rentals in City of Mandurah is 48 days.
- Guests book furthest in advance for stays during October (average 85 days), likely coinciding with peak travel demand or local events.
- The shortest booking windows occur for stays in August (average 25 days), indicating more last-minute travel plans during this time.
- Seasonally, Fall (65 days avg.) sees the longest lead times, while Summer (36 days avg.) has the shortest, reflecting typical travel planning cycles.
Recommendations for Hosts
- Use the overall average lead time (48 days) as a baseline for your pricing and availability strategy in City of Mandurah.
- For October stays, consider implementing length-of-stay discounts or slightly higher rates for bookings made less than 85 days out to capitalize on advance planning.
- Target marketing efforts for the Fall season well in advance (at least 65 days) to capture early planners.
- Monitor your own booking lead times against these City of Mandurah averages to identify opportunities for dynamic pricing adjustments.
Popular & Essential Airbnb Amenities in City of Mandurah (2025)
Amenity Prevalence
Amenity Insights for City of Mandurah
- Essential amenities in City of Mandurah that guests expect include: Free parking on premises, Heating, Kitchen, Refrigerator, Dishes and silverware, Washer. Lacking these (any) could significantly impact bookings.
- Popular amenities like Smoke alarm, TV, Essentials are common but not universal. Offering these can provide a competitive edge.
Recommendations for Hosts
- Ensure your listing includes all essential amenities for City of Mandurah: Free parking on premises, Heating, Kitchen, Refrigerator, Dishes and silverware, Washer.
- Prioritize adding missing essentials: Refrigerator, Dishes and silverware, Washer.
- Consider adding popular differentiators like Smoke alarm or TV to increase appeal.
- Highlight unique or less common amenities you offer (e.g., hot tub, dedicated workspace, EV charger) in your listing description and photos.
- Regularly check competitor amenities in City of Mandurah to stay competitive.
City of Mandurah Airbnb Guest Demographics & Profile Analysis (2025)
Guest Profile Summary for City of Mandurah
- The typical guest profile for Airbnb in City of Mandurah consists of primarily domestic travelers (92%), often arriving from nearby Perth, typically belonging to the Post-2000s (Gen Z/Alpha) group (50%), primarily speaking English or French.
- Domestic travelers account for 92.3% of guests.
- Key international markets include Australia (92.3%) and Singapore (2.6%).
- Top languages spoken are English (81.2%) followed by French (5.8%).
- A significant demographic segment is the Post-2000s (Gen Z/Alpha) group, representing 50% of guests.
Recommendations for Hosts
- Target domestic marketing efforts towards travelers from Perth and Western Australia.
- Tailor amenities and listing descriptions to appeal to the dominant Post-2000s (Gen Z/Alpha) demographic (e.g., highlight fast WiFi, smart home features, local guides).
- Highlight unique local experiences or amenities relevant to the primary guest profile.
- Consider seasonal promotions aligned with peak travel times for key origin markets.
Nearby Short-Term Rental Market Comparison
How does the City of Mandurah Airbnb market stack up against its neighbors? Compare key performance metrics like average monthly revenue, ADR, and occupancy rates in surrounding areas to understand the broader regional STR landscape.
| Market | Active Properties | Monthly Revenue | Daily Rate | Avg. Occupancy |
|---|---|---|---|---|
| Gracetown | 34 | $4,562 | $358.38 | 47% |
| Cottesloe | 138 | $4,018 | $230.16 | 66% |
| Margaret River | 410 | $3,882 | $218.78 | 61% |
| Gnarabup | 88 | $3,791 | $265.86 | 52% |
| Prevelly | 41 | $3,790 | $238.98 | 57% |
| Dunsborough | 446 | $3,762 | $289.15 | 48% |
| Yallingup | 238 | $3,754 | $334.67 | 46% |
| Peppermint Grove Beach | 35 | $3,750 | $326.50 | 39% |
| City Of Busselton | 535 | $3,637 | $301.10 | 44% |
| Swanbourne | 10 | $3,608 | $326.94 | 49% |