City Of Kalamunda Airbnb Market Analysis 2025: Short Term Rental Data & Vacation Rental Statistics in Western Australia, Australia
Is Airbnb profitable in City Of Kalamunda in 2025? Explore comprehensive Airbnb analytics for City Of Kalamunda, Western Australia, Australia to uncover income potential. This 2025 STR market report for City Of Kalamunda, based on AirROI data from April 2024 to March 2025, reveals key trends in the niche market of 60 active listings.
Whether you're considering an Airbnb investment in City Of Kalamunda, optimizing your existing vacation rental, or exploring rental arbitrage opportunities, understanding the City Of Kalamunda Airbnb data is crucial. Navigating the high regulation landscape is key to maximizing your short term rental income potential. Let's dive into the specifics.
Key City Of Kalamunda Airbnb Performance Metrics Overview
Monthly Airbnb Revenue Variations & Income Potential in City Of Kalamunda (2025)
Understanding the monthly revenue variations for Airbnb listings in City Of Kalamunda is key to maximizing your short term rental income potential. Seasonality significantly impacts earnings. Our analysis, based on data from the past 12 months, shows that the peak revenue month for STRs in City Of Kalamunda is typically December, while August often presents the lowest earnings, highlighting opportunities for strategic pricing adjustments during shoulder and low seasons. Explore the typical Airbnb income in City Of Kalamunda across different performance tiers:
- Best-in-class properties (Top 10%) achieve $5,219+ monthly, often utilizing dynamic pricing and superior guest experiences.
- Strong performing properties (Top 25%) earn $3,497 or more, indicating effective management and desirable locations/amenities.
- Typical properties (Median) generate around $1,993 per month, representing the average market performance.
- Entry-level properties (Bottom 25%) see earnings around $1,108, often with potential for optimization.
Average Monthly Airbnb Earnings Trend in City Of Kalamunda
City Of Kalamunda Airbnb Occupancy Rate Trends (2025)
Maximize your bookings by understanding the City Of Kalamunda STR occupancy trends. Seasonal demand shifts significantly influence how often properties are booked. Typically, Februarysees the highest demand (peak season occupancy), while May experiences the lowest (low season). Effective strategies, like adjusting minimum stays or offering promotions, can boost occupancy during slower periods. Here's how different property tiers perform in City Of Kalamunda:
- Best-in-class properties (Top 10%) achieve 91%+ occupancy, indicating high desirability and potentially optimized availability.
- Strong performing properties (Top 25%) maintain 79% or higher occupancy, suggesting good market fit and guest satisfaction.
- Typical properties (Median) have an occupancy rate around 56%.
- Entry-level properties (Bottom 25%) average 33% occupancy, potentially facing higher vacancy.
Average Monthly Occupancy Rate Trend in City Of Kalamunda
Average Daily Rate (ADR) Airbnb Trends in City Of Kalamunda (2025)
Effective short term rental pricing strategy in City Of Kalamunda involves understanding monthly ADR fluctuations. The Average Daily Rate (ADR) for Airbnb in City Of Kalamunda typically peaks in December and dips lowest during May. Leveraging Airbnb dynamic pricing tools or strategies based on this seasonality can significantly boost revenue. Here's a look at the typical nightly rates achieved:
- Best-in-class properties (Top 10%) command rates of $233+ per night, often due to premium features or locations.
- Strong performing properties (Top 25%) achieve nightly rates of $180 or more.
- Typical properties (Median) charge around $104 per night.
- Entry-level properties (Bottom 25%) earn around $58 per night.
Average Daily Rate (ADR) Trend by Month in City Of Kalamunda
Get Live City Of Kalamunda Market Intelligence 👇

Explore Real-time Analytics
Airbnb Seasonality Analysis & Trends in City Of Kalamunda (2025)
Peak Season (December, May, April)
- Revenue averages $3,044 per month
- Occupancy rates average 53.4%
- Daily rates average $134
Shoulder Season
- Revenue averages $2,685 per month
- Occupancy maintains around 55.0%
- Daily rates hold near $134
Low Season (February, August, October)
- Revenue drops to average $2,323 per month
- Occupancy decreases to average 54.9%
- Daily rates adjust to average $132
Seasonality Insights for City Of Kalamunda
- The Airbnb seasonality in City Of Kalamunda shows moderate seasonality with distinct peak and low periods. While the sections above show seasonal averages, it's also insightful to look at the extremes:
- During the high season, the absolute peak month showcases City Of Kalamunda's highest earning potential, with monthly revenues capable of climbing to $3,104, occupancy reaching a high of 59.3%, and ADRs peaking at $149.
- Conversely, the slowest single month of the year, typically falling within the low season, marks the market's lowest point. In this month, revenue might dip to $2,154, occupancy could drop to 49.3%, and ADRs may adjust down to $126.
- Understanding both the seasonal averages and these monthly peaks and troughs in revenue, occupancy, and ADR is crucial for maximizing your Airbnb profit potential in City Of Kalamunda.
Seasonal Strategies for Maximizing Profit
- Peak Season: Maximize revenue through premium pricing and potentially longer minimum stays. Ensure high availability.
- Low Season: Offer competitive pricing, special promotions (e.g., extended stay discounts), and flexible cancellation policies. Target off-season travelers like remote workers or budget-conscious guests.
- Shoulder Seasons: Implement dynamic pricing that balances peak and low rates. Target weekend travelers or specific events. Offer slightly more flexible terms than peak season.
- Regularly analyze your own performance against these City Of Kalamunda seasonality benchmarks and adjust your pricing and availability strategy accordingly.
Best Areas for Airbnb Investment in City Of Kalamunda (2025)
Exploring the top neighborhoods for short-term rentals in City Of Kalamunda? This section highlights key areas, outlining why they are attractive for hosts and guests, along with notable local attractions. Consider these locations based on your target guest profile and investment strategy.
| Neighborhood / Area | Why Host Here? (Target Guests & Appeal) | Key Attractions & Landmarks |
|---|---|---|
| Kalamunda Town Centre | The heart of Kalamunda, this area offers a mix of shops, cafes, and access to beautiful parks and nature reserves. Ideal for visitors looking for a vibrant community atmosphere with local eateries and services. | Kalamunda Markets, Kalamunda National Park, Zig Zag Scenic Drive, Kalamunda History Village, Bickley Valley wineries |
| Bickley Valley | Renowned for its picturesque vineyards and orchards, Bickley Valley and the surrounds are perfect for those seeking a relaxing getaway amongst nature and fine produce. | Bickley Valley Wine Trail, Masonmill Gardens, Cider and Ale Trail, Kalamunda Olive Oil Company, Pick Your Own fruits farms |
| Lesmurdie | A scenic area known for its stunning views of the Perth skyline and the Swan River, Lesmurdie is attractive for its natural beauty and tranquility. | Lesmurdie Falls National Park, Stirling Range National Park, Bickley Brook Conservation Park, Perth Hills Discovery Centre |
| Masonmill | Famous for its natural beauty and outdoor activities, Masonmill offers a peaceful retreat and is popular among families and nature lovers. | Masonmill Eco Park, Masonmill Gardens, Lesmurdie Falls, Mountain Biking tracks |
| Kalamunda National Park | This large national park features beautiful walking trails, picnic spots, and scenic views. It's perfect for tourists who enjoy outdoor activities and exploring nature. | Walking and bike trails, Picnic areas, Scenic lookouts, Wildlife viewing |
| Gooseberry Hill | A charming suburb known for its elevated position and stunning views, popular among tourists looking for peaceful surroundings and nature. | Gooseberry Hill National Park, Walyunga National Park, Lookout Points, Parks and play areas |
| Lesmurdie Falls | A stunning waterfall and natural area that attracts visitors for its beauty and hiking trails, great for tourists who enjoy nature and photography. | Lesmurdie Falls, Walking trails, Scenic lookout, Picnic spots |
| Horticultural Heartland | Known for its rich agriculture, visitors can enjoy farm stays and experiences in the heart of Kalamunda's agricultural activities, perfect for families and food lovers. | Farm Tours, Fruit Picking Experiences, Local Produce Stalls, Agricultural Festivals |
Understanding Airbnb License Requirements & STR Laws in City Of Kalamunda (2025)
Yes, City Of Kalamunda, Western Australia, Australia enforces high STR regulations. Obtaining a license and ensuring compliance is almost certainly required according to current 2025 STR laws. Always verify the latest short term rental regulations and Airbnb license requirements directly with local government authorities for City Of Kalamunda to ensure full compliance before hosting.
(Source: AirROI data, 2025, based on 70% licensed listings)
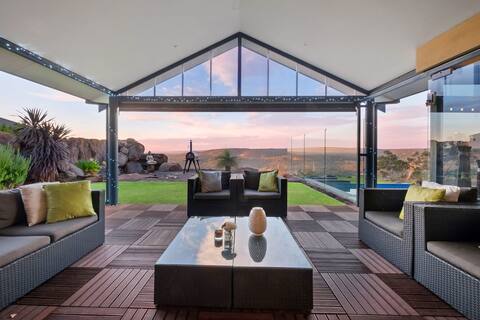
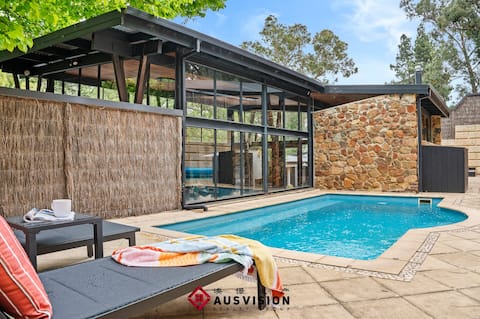
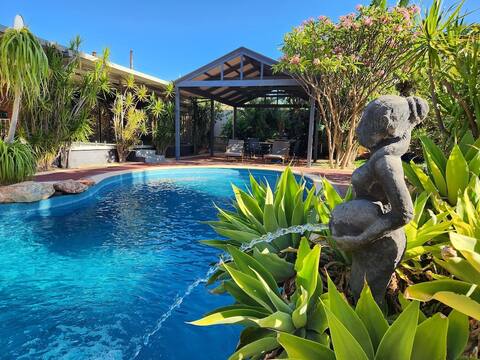
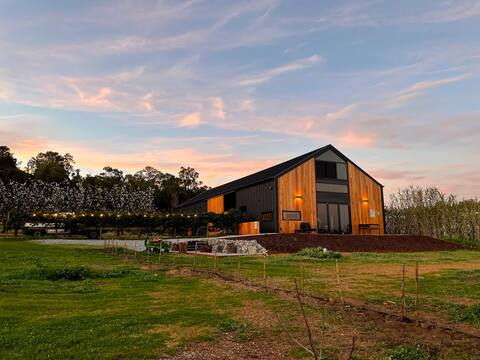
Top Performing Airbnb Properties in City Of Kalamunda (2025)
Benchmark your potential! Explore examples of top-performing Airbnb properties in City Of Kalamundabased on Trailing Twelve Month (TTM) revenue. Analyze their characteristics, revenue, occupancy rate, and ADR to understand what drives success in this market.
Nestled in nature, with amazing panoramic views
Entire Place • 4 bedrooms
The New Marri Retreat-Perth Hill
Entire Place • 4 bedrooms
Tranquil Gumnut Cottage, close to Airport.
Entire Place • 2 bedrooms
*Luxury rustic farmstay in the gum and plum trees*
Entire Place • 1 bedroom

thespaceperth
Entire Place • 2 bedrooms

Lascelles Lookout - A Haven On The Hill
Entire Place • 4 bedrooms
Note: Performance varies based on location, size, amenities, seasonality, and management quality. Data reflects the past 12 months.
Top Performing Airbnb Hosts in City Of Kalamunda (2025)
Learn from the best! This table showcases top-performing Airbnb hosts in City Of Kalamunda based on the number of properties managed and estimated total revenue over the past year. Analyze their scale and performance metrics.
| Host Name | Properties | Grossing Revenue | Stay Reviews | Avg Rating |
|---|---|---|---|---|
| Gavin | 1 | $153,995 | 112 | 4.81/5.0 |
| Pete & Julia | 6 | $112,099 | 65 | 4.96/5.0 |
| Peter | 2 | $109,247 | 275 | 4.96/5.0 |
| Lucy | 1 | $89,124 | 22 | 5.00/5.0 |
| Domenico | 1 | $63,348 | 99 | 4.99/5.0 |
| Ben | 1 | $59,105 | 127 | 4.90/5.0 |
| Lee | 1 | $58,323 | 54 | 4.96/5.0 |
| Stevie | 1 | $57,803 | 47 | 4.96/5.0 |
| Yohrren | 4 | $45,927 | 156 | 4.75/5.0 |
| Cathy | 1 | $41,539 | 127 | 4.92/5.0 |
Analyzing the strategies of top hosts, such as their property selection, pricing, and guest communication, can offer valuable lessons for optimizing your own Airbnb operations in City Of Kalamunda.
Dive Deeper: Advanced City Of Kalamunda STR Market Data (2025)
Ready to unlock more insights? AirROI provides access to advanced metrics and comprehensive Airbnb data for City Of Kalamunda. Explore detailed analytics beyond this report to refine your investment strategy, optimize pricing, and maximize your vacation rental profits.
Explore Advanced MetricsCity Of Kalamunda Short-Term Rental Market Composition (2025): Property & Room Types
Room Type Distribution
Property Type Distribution
Market Composition Insights for City Of Kalamunda
- The City Of Kalamunda Airbnb market composition is heavily skewed towards Entire Home/Apt listings, which make up 66.7% of the 60 active rentals. This indicates strong guest preference for privacy and space.
- However, a notable 33.3% share for Private Rooms suggests opportunities for budget-conscious travelers or hosts renting out spare rooms.
- Looking at the property type distribution in City Of Kalamunda, House properties are the most common (63.3%), reflecting the local real estate landscape.
- Houses represent a significant 63.3% portion, catering likely to families or larger groups.
- The presence of 8.3% Hotel/Boutique listings indicates integration with traditional hospitality.
- Smaller segments like apartment/condo (combined 1.7%) offer potential for unique stay experiences.
City Of Kalamunda Airbnb Room Capacity Analysis (2025): Bedroom Distribution
Distribution of Listings by Number of Bedrooms
Room Capacity Insights for City Of Kalamunda
- The dominant room capacity in City Of Kalamunda is 1 bedroom listings, making up 35% of the market. This suggests a strong demand for properties suitable for couples or solo travelers.
- Together, 1 bedroom and 3 bedrooms properties represent 53.3% of the active Airbnb listings in City Of Kalamunda, indicating a high concentration in these sizes.
- A significant 26.6% of listings offer 3+ bedrooms, catering to larger groups and families seeking more space in City Of Kalamunda.
City Of Kalamunda Vacation Rental Guest Capacity Trends (2025)
Distribution of Listings by Guest Capacity
Guest Capacity Insights for City Of Kalamunda
- The most common guest capacity trend in City Of Kalamunda vacation rentals is listings accommodating 2 guests (31.7%). This suggests the primary traveler segment is likely couples or solo travelers.
- Properties designed for 2 guests and 5 guests dominate the City Of Kalamunda STR market, accounting for 50.0% of listings.
- 16.7% of properties accommodate 6+ guests, serving the market segment for larger families or group travel in City Of Kalamunda.
- On average, properties in City Of Kalamunda are equipped to host 2.9 guests.
City Of Kalamunda Airbnb Booking Patterns (2025): Available vs. Booked Days
Available Days Distribution
Booked Days Distribution
Booking Pattern Insights for City Of Kalamunda
- The most common availability pattern in City Of Kalamunda falls within the 91-180 days range, representing 30% of listings. This suggests many properties have significant open periods on their calendars.
- Approximately 43.4% of listings show high availability (181+ days open annually), indicating potential for increased bookings or specific owner usage patterns.
- For booked days, the 271-366 days range is most frequent in City Of Kalamunda (30%), reflecting common guest stay durations or potential owner blocking patterns.
- A notable 56.7% of properties secure long booking periods (181+ days booked per year), highlighting successful long-term rental strategies or significant owner usage.
City Of Kalamunda Airbnb Minimum Stay Requirements Analysis
Distribution of Listings by Minimum Night Requirement
1 Night
17 listings
29.3% of total
2 Nights
12 listings
20.7% of total
3 Nights
11 listings
19% of total
4-6 Nights
1 listings
1.7% of total
7-29 Nights
1 listings
1.7% of total
30+ Nights
16 listings
27.6% of total
Key Insights
- The most prevalent minimum stay requirement in City Of Kalamunda is 1 Night, adopted by 29.3% of listings. This highlights the market's preference for shorter, flexible bookings.
- A significant segment (27.6%) caters to monthly stays (30+ nights) in City Of Kalamunda, pointing to opportunities in the extended-stay market.
Recommendations
- Align with the market by considering a 1 Night minimum stay, as 29.3% of City Of Kalamunda hosts use this setting.
- If feasible, allowing 1-night stays, especially midweek or during low season, could capture last-minute bookings, as only 29.3% currently do.
- Explore offering discounts for stays of 30+ nights to attract the 27.6% of the market seeking extended stays.
- Adjust minimum nights based on seasonality – potentially shorter during low season and longer during peak demand periods in City Of Kalamunda.
City Of Kalamunda Airbnb Cancellation Policy Trends Analysis (2025)
Flexible
15 listings
25% of total
Moderate
18 listings
30% of total
Firm
8 listings
13.3% of total
Strict
19 listings
31.7% of total
Cancellation Policy Insights for City Of Kalamunda
- The prevailing Airbnb cancellation policy trend in City Of Kalamunda is Strict, used by 31.7% of listings.
- There's a relatively balanced mix between guest-friendly (55.0%) and stricter (45.0%) policies, offering choices for different guest needs.
Recommendations for Hosts
- Consider adopting a Strict policy to align with the 31.7% market standard in City Of Kalamunda.
- With 31.7% using Strict terms, this is a viable option in City Of Kalamunda, particularly for high-value properties or during peak demand periods.
- Regularly review your cancellation policy against competitors and market demand shifts in City Of Kalamunda.
City Of Kalamunda STR Booking Lead Time Analysis (2025)
Average Booking Lead Time by Month
Booking Lead Time Insights for City Of Kalamunda
- The overall average booking lead time for vacation rentals in City Of Kalamunda is 55 days.
- Guests book furthest in advance for stays during October (average 70 days), likely coinciding with peak travel demand or local events.
- The shortest booking windows occur for stays in August (average 48 days), indicating more last-minute travel plans during this time.
- Seasonally, Spring (68 days avg.) sees the longest lead times, while Summer (57 days avg.) has the shortest, reflecting typical travel planning cycles.
Recommendations for Hosts
- Use the overall average lead time (55 days) as a baseline for your pricing and availability strategy in City Of Kalamunda.
- For October stays, consider implementing length-of-stay discounts or slightly higher rates for bookings made less than 70 days out to capitalize on advance planning.
- Target marketing efforts for the Spring season well in advance (at least 68 days) to capture early planners.
- Monitor your own booking lead times against these City Of Kalamunda averages to identify opportunities for dynamic pricing adjustments.
Popular & Essential Airbnb Amenities in City Of Kalamunda (2025)
Amenity Prevalence
Amenity Insights for City Of Kalamunda
- Essential amenities in City Of Kalamunda that guests expect include: Air conditioning, Smoke alarm, Hangers, Heating. Lacking these (any) could significantly impact bookings.
- Popular amenities like TV, Wifi, Essentials are common but not universal. Offering these can provide a competitive edge.
- Warning: Wifi is not universally provided but is considered essential globally. Ensure reliable Wifi is offered.
Recommendations for Hosts
- Ensure your listing includes all essential amenities for City Of Kalamunda: Air conditioning, Smoke alarm, Hangers, Heating.
- Prioritize adding missing essentials: Hangers, Heating.
- Consider adding popular differentiators like TV or Wifi to increase appeal.
- Highlight unique or less common amenities you offer (e.g., hot tub, dedicated workspace, EV charger) in your listing description and photos.
- Regularly check competitor amenities in City Of Kalamunda to stay competitive.
City Of Kalamunda Airbnb Guest Demographics & Profile Analysis (2025)
Guest Profile Summary for City Of Kalamunda
- The typical guest profile for Airbnb in City Of Kalamunda consists of primarily domestic travelers (75%), often arriving from nearby Perth, typically belonging to the Post-2000s (Gen Z/Alpha) group (50%), primarily speaking English or Chinese.
- Domestic travelers account for 74.6% of guests.
- Key international markets include Australia (74.6%) and Singapore (7%).
- Top languages spoken are English (65.5%) followed by Chinese (7.8%).
- A significant demographic segment is the Post-2000s (Gen Z/Alpha) group, representing 50% of guests.
Recommendations for Hosts
- Target domestic marketing efforts towards travelers from Perth and Western Australia.
- Tailor amenities and listing descriptions to appeal to the dominant Post-2000s (Gen Z/Alpha) demographic (e.g., highlight fast WiFi, smart home features, local guides).
- Highlight unique local experiences or amenities relevant to the primary guest profile.
- Consider seasonal promotions aligned with peak travel times for key origin markets.
Nearby Short-Term Rental Market Comparison
How does the City Of Kalamunda Airbnb market stack up against its neighbors? Compare key performance metrics like average monthly revenue, ADR, and occupancy rates in surrounding areas to understand the broader regional STR landscape.
| Market | Active Properties | Monthly Revenue | Daily Rate | Avg. Occupancy |
|---|---|---|---|---|
| Cottesloe | 138 | $4,018 | $230.16 | 66% |
| Swanbourne | 10 | $3,608 | $326.94 | 49% |
| City of Mandurah | 29 | $2,989 | $218.84 | 46% |
| Shire Of Murray | 56 | $2,975 | $222.09 | 47% |
| Mosman Park | 49 | $2,967 | $195.80 | 64% |
| Mandurah | 387 | $2,963 | $241.70 | 48% |
| Dwellingup | 18 | $2,954 | $149.11 | 64% |
| South Fremantle | 74 | $2,896 | $177.02 | 61% |
| Shire Of Toodyay | 17 | $2,868 | $231.11 | 44% |
| North Fremantle | 29 | $2,821 | $189.18 | 62% |