City of Canning Airbnb Market Analysis 2025: Short Term Rental Data & Vacation Rental Statistics in Western Australia, Australia
Is Airbnb profitable in City of Canning in 2025? Explore comprehensive Airbnb analytics for City of Canning, Western Australia, Australia to uncover income potential. This 2025 STR market report for City of Canning, based on AirROI data from April 2024 to March 2025, reveals key trends in the niche market of 170 active listings.
Whether you're considering an Airbnb investment in City of Canning, optimizing your existing vacation rental, or exploring rental arbitrage opportunities, understanding the City of Canning Airbnb data is crucial. Navigating the high regulation landscape is key to maximizing your short term rental income potential. Let's dive into the specifics.
Key City of Canning Airbnb Performance Metrics Overview
Monthly Airbnb Revenue Variations & Income Potential in City of Canning (2025)
Understanding the monthly revenue variations for Airbnb listings in City of Canning is key to maximizing your short term rental income potential. Seasonality significantly impacts earnings. Our analysis, based on data from the past 12 months, shows that the peak revenue month for STRs in City of Canning is typically December, while March often presents the lowest earnings, highlighting opportunities for strategic pricing adjustments during shoulder and low seasons. Explore the typical Airbnb income in City of Canning across different performance tiers:
- Best-in-class properties (Top 10%) achieve $4,385+ monthly, often utilizing dynamic pricing and superior guest experiences.
- Strong performing properties (Top 25%) earn $2,899 or more, indicating effective management and desirable locations/amenities.
- Typical properties (Median) generate around $1,450 per month, representing the average market performance.
- Entry-level properties (Bottom 25%) see earnings around $862, often with potential for optimization.
Average Monthly Airbnb Earnings Trend in City of Canning
City of Canning Airbnb Occupancy Rate Trends (2025)
Maximize your bookings by understanding the City of Canning STR occupancy trends. Seasonal demand shifts significantly influence how often properties are booked. Typically, Novembersees the highest demand (peak season occupancy), while May experiences the lowest (low season). Effective strategies, like adjusting minimum stays or offering promotions, can boost occupancy during slower periods. Here's how different property tiers perform in City of Canning:
- Best-in-class properties (Top 10%) achieve 92%+ occupancy, indicating high desirability and potentially optimized availability.
- Strong performing properties (Top 25%) maintain 85% or higher occupancy, suggesting good market fit and guest satisfaction.
- Typical properties (Median) have an occupancy rate around 69%.
- Entry-level properties (Bottom 25%) average 44% occupancy, potentially facing higher vacancy.
Average Monthly Occupancy Rate Trend in City of Canning
Average Daily Rate (ADR) Airbnb Trends in City of Canning (2025)
Effective short term rental pricing strategy in City of Canning involves understanding monthly ADR fluctuations. The Average Daily Rate (ADR) for Airbnb in City of Canning typically peaks in December and dips lowest during May. Leveraging Airbnb dynamic pricing tools or strategies based on this seasonality can significantly boost revenue. Here's a look at the typical nightly rates achieved:
- Best-in-class properties (Top 10%) command rates of $180+ per night, often due to premium features or locations.
- Strong performing properties (Top 25%) achieve nightly rates of $129 or more.
- Typical properties (Median) charge around $61 per night.
- Entry-level properties (Bottom 25%) earn around $40 per night.
Average Daily Rate (ADR) Trend by Month in City of Canning
Get Live City of Canning Market Intelligence 👇

Explore Real-time Analytics
Airbnb Seasonality Analysis & Trends in City of Canning (2025)
Peak Season (December, January, November)
- Revenue averages $2,349 per month
- Occupancy rates average 68.1%
- Daily rates average $97
Shoulder Season
- Revenue averages $2,101 per month
- Occupancy maintains around 62.5%
- Daily rates hold near $87
Low Season (March, July, August)
- Revenue drops to average $1,865 per month
- Occupancy decreases to average 60.0%
- Daily rates adjust to average $87
Seasonality Insights for City of Canning
- The Airbnb seasonality in City of Canning shows moderate seasonality with distinct peak and low periods. While the sections above show seasonal averages, it's also insightful to look at the extremes:
- During the high season, the absolute peak month showcases City of Canning's highest earning potential, with monthly revenues capable of climbing to $2,521, occupancy reaching a high of 70.8%, and ADRs peaking at $100.
- Conversely, the slowest single month of the year, typically falling within the low season, marks the market's lowest point. In this month, revenue might dip to $1,743, occupancy could drop to 54.6%, and ADRs may adjust down to $85.
- Understanding both the seasonal averages and these monthly peaks and troughs in revenue, occupancy, and ADR is crucial for maximizing your Airbnb profit potential in City of Canning.
Seasonal Strategies for Maximizing Profit
- Peak Season: Maximize revenue through premium pricing and potentially longer minimum stays. Ensure high availability.
- Low Season: Offer competitive pricing, special promotions (e.g., extended stay discounts), and flexible cancellation policies. Target off-season travelers like remote workers or budget-conscious guests.
- Shoulder Seasons: Implement dynamic pricing that balances peak and low rates. Target weekend travelers or specific events. Offer slightly more flexible terms than peak season.
- Regularly analyze your own performance against these City of Canning seasonality benchmarks and adjust your pricing and availability strategy accordingly.
Best Areas for Airbnb Investment in City of Canning (2025)
Exploring the top neighborhoods for short-term rentals in City of Canning? This section highlights key areas, outlining why they are attractive for hosts and guests, along with notable local attractions. Consider these locations based on your target guest profile and investment strategy.
| Neighborhood / Area | Why Host Here? (Target Guests & Appeal) | Key Attractions & Landmarks |
|---|---|---|
| Canning Vale | A growing suburb known for its family-friendly atmosphere and close proximity to amenities. Ideal for families and long-term stays. | Canning Vale Shopping Centre, Parkland, Thornlie Golf Course, Canning River, Local parks |
| Willetton | A popular suburb with excellent schools and recreational facilities, making it attractive for families and business travelers. | Willetton Shopping Centre, Southlands Boulevarde, Local parks, Rec Centre, Lake Gwelup |
| Como | Located near the Swan River and a short drive from Perth, Como is ideal for tourists looking for a peaceful retreat with easy city access. | Swan River, Como Beach, Local cafes, Canning Bridge, Perth Zoo |
| East Cannington | An emerging suburb that is becoming increasingly popular due to affordable housing and public transport links to Perth city. | Westfield Carousel, Cannington Leisureplex, Local parks, Cannington train station, Burswood Park |
| Leeming | A quiet residential area known for its parks and community feel, perfect for guests seeking tranquility close to the city. | Parks and reserves, Leeming senior high school, Local shops, Murdoch University, Adventure World |
| Bentley | Home to a diverse population and close to the Curtin University, attractive for students and young professionals. | Curtin University, Westfield Carousel, Local dining options, Bentley Park, Public transport access |
| Jandakot | Located near the airport with a mix of residential and commercial properties, appealing to business travelers. | Jandakot Airport, Local cafes, Parks, Quick access to the city, Corporate offices |
| Riverton | Known for its parks and the Canning River, offering a mix of suburban charm and outdoor activities. | Riverside parks, Local shopping areas, Canning River Regional Park, Riverton Bridge, Community events |
Understanding Airbnb License Requirements & STR Laws in City of Canning (2025)
Yes, City of Canning, Western Australia, Australia enforces high STR regulations. Obtaining a license and ensuring compliance is almost certainly required according to current 2025 STR laws. Always verify the latest short term rental regulations and Airbnb license requirements directly with local government authorities for City of Canning to ensure full compliance before hosting.
(Source: AirROI data, 2025, based on 66% licensed listings)
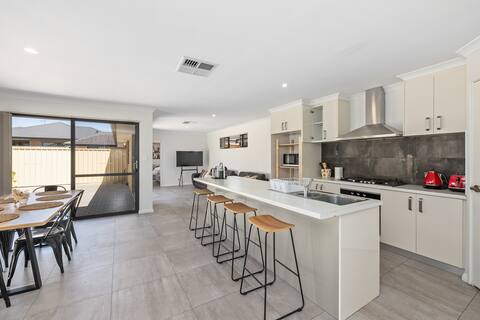
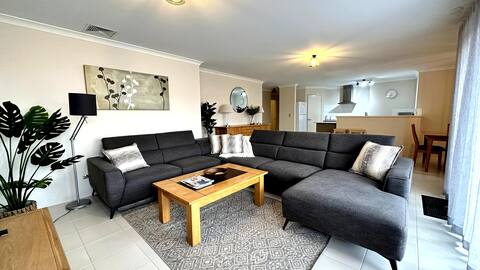
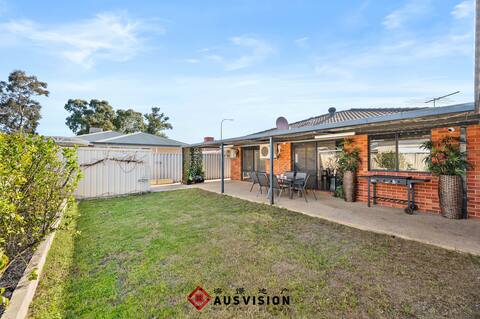
Top Performing Airbnb Properties in City of Canning (2025)
Benchmark your potential! Explore examples of top-performing Airbnb properties in City of Canningbased on Trailing Twelve Month (TTM) revenue. Analyze their characteristics, revenue, occupancy rate, and ADR to understand what drives success in this market.
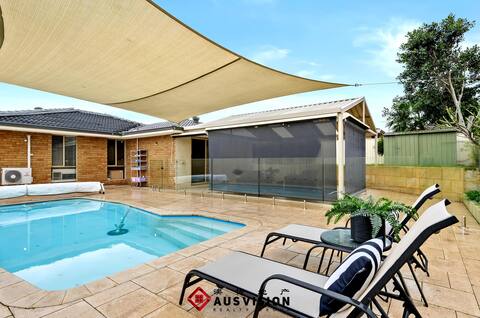
All-Season Entertainer-Swimming Pool-Curtin uni
Entire Place • 6 bedrooms
Spacious 6Br with Dual bathrooms close to airport
Entire Place • 6 bedrooms

Modern Villa Near Curtin University
Entire Place • 4 bedrooms

Modern Minimalistic Home
Entire Place • 4 bedrooms
Beauty in Bentley~Central family home
Entire Place • 4 bedrooms
Spacious Holiday Oasis Westfield Mall @Station St
Entire Place • 3 bedrooms
Note: Performance varies based on location, size, amenities, seasonality, and management quality. Data reflects the past 12 months.
Top Performing Airbnb Hosts in City of Canning (2025)
Learn from the best! This table showcases top-performing Airbnb hosts in City of Canning based on the number of properties managed and estimated total revenue over the past year. Analyze their scale and performance metrics.
| Host Name | Properties | Grossing Revenue | Stay Reviews | Avg Rating |
|---|---|---|---|---|
| Chenfei | 10 | $356,480 | 1066 | 4.84/5.0 |
| Lucy | 4 | $299,485 | 115 | 4.76/5.0 |
| Mia | 11 | $241,894 | 186 | 4.45/5.0 |
| Daniel | 4 | $156,435 | 564 | 4.73/5.0 |
| Manaa Living | 2 | $137,691 | 55 | 4.84/5.0 |
| Justine & Lan | 2 | $131,388 | 28 | 4.97/5.0 |
| Jonathan | 2 | $113,053 | 103 | 4.91/5.0 |
| Phoebe | 3 | $112,274 | 105 | 4.67/5.0 |
| John & Jenny | 2 | $76,702 | 546 | 4.89/5.0 |
| Vincent | 7 | $53,904 | 118 | 4.06/5.0 |
Analyzing the strategies of top hosts, such as their property selection, pricing, and guest communication, can offer valuable lessons for optimizing your own Airbnb operations in City of Canning.
Dive Deeper: Advanced City of Canning STR Market Data (2025)
Ready to unlock more insights? AirROI provides access to advanced metrics and comprehensive Airbnb data for City of Canning. Explore detailed analytics beyond this report to refine your investment strategy, optimize pricing, and maximize your vacation rental profits.
Explore Advanced MetricsCity of Canning Short-Term Rental Market Composition (2025): Property & Room Types
Room Type Distribution
Property Type Distribution
Market Composition Insights for City of Canning
- The City of Canning Airbnb market composition is heavily skewed towards Private Room listings, which make up 53.5% of the 170 active rentals. This indicates strong guest preference for privacy and space.
- Looking at the property type distribution in City of Canning, House properties are the most common (81.8%), reflecting the local real estate landscape.
- Houses represent a significant 81.8% portion, catering likely to families or larger groups.
- Smaller segments like others, hotel/boutique, outdoor/unique (combined 7.0%) offer potential for unique stay experiences.
City of Canning Airbnb Room Capacity Analysis (2025): Bedroom Distribution
Distribution of Listings by Number of Bedrooms
Room Capacity Insights for City of Canning
- The dominant room capacity in City of Canning is 1 bedroom listings, making up 22.4% of the market. This suggests a strong demand for properties suitable for couples or solo travelers.
- Together, 1 bedroom and 3 bedrooms properties represent 36.5% of the active Airbnb listings in City of Canning, indicating a high concentration in these sizes.
- A significant 27.1% of listings offer 3+ bedrooms, catering to larger groups and families seeking more space in City of Canning.
City of Canning Vacation Rental Guest Capacity Trends (2025)
Distribution of Listings by Guest Capacity
Guest Capacity Insights for City of Canning
- The most common guest capacity trend in City of Canning vacation rentals is listings accommodating 8+ guests (14.1%). This suggests the primary traveler segment is likely larger groups.
- Properties designed for 8+ guests and 2 guests dominate the City of Canning STR market, accounting for 25.3% of listings.
- 22.9% of properties accommodate 6+ guests, serving the market segment for larger families or group travel in City of Canning.
- On average, properties in City of Canning are equipped to host 2.7 guests.
City of Canning Airbnb Booking Patterns (2025): Available vs. Booked Days
Available Days Distribution
Booked Days Distribution
Booking Pattern Insights for City of Canning
- The most common availability pattern in City of Canning falls within the 91-180 days range, representing 35.3% of listings. This suggests many properties have significant open periods on their calendars.
- Approximately 36.4% of listings show high availability (181+ days open annually), indicating potential for increased bookings or specific owner usage patterns.
- For booked days, the 181-270 days range is most frequent in City of Canning (33.5%), reflecting common guest stay durations or potential owner blocking patterns.
- A notable 63.5% of properties secure long booking periods (181+ days booked per year), highlighting successful long-term rental strategies or significant owner usage.
City of Canning Airbnb Minimum Stay Requirements Analysis
Distribution of Listings by Minimum Night Requirement
1 Night
21 listings
13.6% of total
2 Nights
28 listings
18.2% of total
3 Nights
15 listings
9.7% of total
4-6 Nights
21 listings
13.6% of total
7-29 Nights
12 listings
7.8% of total
30+ Nights
57 listings
37% of total
Key Insights
- The most prevalent minimum stay requirement in City of Canning is 30+ Nights, adopted by 37% of listings. This highlights the market's preference for longer commitments.
- A significant segment (37%) caters to monthly stays (30+ nights) in City of Canning, pointing to opportunities in the extended-stay market.
Recommendations
- Align with the market by considering a 30+ Nights minimum stay, as 37% of City of Canning hosts use this setting.
- If feasible, allowing 1-night stays, especially midweek or during low season, could capture last-minute bookings, as only 13.6% currently do.
- Explore offering discounts for stays of 30+ nights to attract the 37% of the market seeking extended stays.
- Adjust minimum nights based on seasonality – potentially shorter during low season and longer during peak demand periods in City of Canning.
City of Canning Airbnb Cancellation Policy Trends Analysis (2025)
Flexible
17 listings
11.5% of total
Moderate
44 listings
29.7% of total
Firm
39 listings
26.4% of total
Strict
48 listings
32.4% of total
Cancellation Policy Insights for City of Canning
- The prevailing Airbnb cancellation policy trend in City of Canning is Strict, used by 32.4% of listings.
- A majority (58.8%) of hosts in City of Canning utilize Firm or Strict policies, indicating a market where hosts prioritize booking security.
Recommendations for Hosts
- Consider adopting a Strict policy to align with the 32.4% market standard in City of Canning.
- With 32.4% using Strict terms, this is a viable option in City of Canning, particularly for high-value properties or during peak demand periods.
- Regularly review your cancellation policy against competitors and market demand shifts in City of Canning.
City of Canning STR Booking Lead Time Analysis (2025)
Average Booking Lead Time by Month
Booking Lead Time Insights for City of Canning
- The overall average booking lead time for vacation rentals in City of Canning is 39 days.
- Guests book furthest in advance for stays during October (average 57 days), likely coinciding with peak travel demand or local events.
- The shortest booking windows occur for stays in August (average 29 days), indicating more last-minute travel plans during this time.
- Seasonally, Fall (48 days avg.) sees the longest lead times, while Summer (40 days avg.) has the shortest, reflecting typical travel planning cycles.
Recommendations for Hosts
- Use the overall average lead time (39 days) as a baseline for your pricing and availability strategy in City of Canning.
- For October stays, consider implementing length-of-stay discounts or slightly higher rates for bookings made less than 57 days out to capitalize on advance planning.
- Target marketing efforts for the Fall season well in advance (at least 48 days) to capture early planners.
- Monitor your own booking lead times against these City of Canning averages to identify opportunities for dynamic pricing adjustments.
Popular & Essential Airbnb Amenities in City of Canning (2025)
Amenity Prevalence
Amenity Insights for City of Canning
- Essential amenities in City of Canning that guests expect include: Wifi. Lacking these (this) could significantly impact bookings.
- Popular amenities like Kitchen, Washer, Smoke alarm are common but not universal. Offering these can provide a competitive edge.
Recommendations for Hosts
- Ensure your listing includes all essential amenities for City of Canning: Wifi.
- Prioritize adding missing essentials: Wifi.
- Consider adding popular differentiators like Kitchen or Washer to increase appeal.
- Highlight unique or less common amenities you offer (e.g., hot tub, dedicated workspace, EV charger) in your listing description and photos.
- Regularly check competitor amenities in City of Canning to stay competitive.
City of Canning Airbnb Guest Demographics & Profile Analysis (2025)
Guest Profile Summary for City of Canning
- The typical guest profile for Airbnb in City of Canning consists of a mix of domestic (55%) and international guests, often arriving from nearby Perth, typically belonging to the Post-2000s (Gen Z/Alpha) group (50%), primarily speaking English or Chinese.
- Domestic travelers account for 54.6% of guests.
- Key international markets include Australia (54.6%) and Singapore (15.1%).
- Top languages spoken are English (56.3%) followed by Chinese (10.7%).
- A significant demographic segment is the Post-2000s (Gen Z/Alpha) group, representing 50% of guests.
Recommendations for Hosts
- Balance marketing efforts between domestic and international channels based on the guest mix.
- Tailor amenities and listing descriptions to appeal to the dominant Post-2000s (Gen Z/Alpha) demographic (e.g., highlight fast WiFi, smart home features, local guides).
- Highlight unique local experiences or amenities relevant to the primary guest profile.
- Consider seasonal promotions aligned with peak travel times for key origin markets.
Nearby Short-Term Rental Market Comparison
How does the City of Canning Airbnb market stack up against its neighbors? Compare key performance metrics like average monthly revenue, ADR, and occupancy rates in surrounding areas to understand the broader regional STR landscape.
| Market | Active Properties | Monthly Revenue | Daily Rate | Avg. Occupancy |
|---|---|---|---|---|
| Gracetown | 34 | $4,562 | $358.38 | 47% |
| Cottesloe | 138 | $4,018 | $230.16 | 66% |
| Margaret River | 410 | $3,882 | $218.78 | 61% |
| Gnarabup | 88 | $3,791 | $265.86 | 52% |
| Prevelly | 41 | $3,790 | $238.98 | 57% |
| Dunsborough | 446 | $3,762 | $289.15 | 48% |
| Yallingup | 238 | $3,754 | $334.67 | 46% |
| Peppermint Grove Beach | 35 | $3,750 | $326.50 | 39% |
| City Of Busselton | 535 | $3,637 | $301.10 | 44% |
| Swanbourne | 10 | $3,608 | $326.94 | 49% |