City Of Armadale Airbnb Market Analysis 2025: Short Term Rental Data & Vacation Rental Statistics in Western Australia, Australia
Is Airbnb profitable in City Of Armadale in 2025? Explore comprehensive Airbnb analytics for City Of Armadale, Western Australia, Australia to uncover income potential. This 2025 STR market report for City Of Armadale, based on AirROI data from April 2024 to March 2025, reveals key trends in the niche market of 32 active listings.
Whether you're considering an Airbnb investment in City Of Armadale, optimizing your existing vacation rental, or exploring rental arbitrage opportunities, understanding the City Of Armadale Airbnb data is crucial. Navigating the high regulation landscape is key to maximizing your short term rental income potential. Let's dive into the specifics.
Key City Of Armadale Airbnb Performance Metrics Overview
Monthly Airbnb Revenue Variations & Income Potential in City Of Armadale (2025)
Understanding the monthly revenue variations for Airbnb listings in City Of Armadale is key to maximizing your short term rental income potential. Seasonality significantly impacts earnings. Our analysis, based on data from the past 12 months, shows that the peak revenue month for STRs in City Of Armadale is typically December, while July often presents the lowest earnings, highlighting opportunities for strategic pricing adjustments during shoulder and low seasons. Explore the typical Airbnb income in City Of Armadale across different performance tiers:
- Best-in-class properties (Top 10%) achieve $5,621+ monthly, often utilizing dynamic pricing and superior guest experiences.
- Strong performing properties (Top 25%) earn $3,991 or more, indicating effective management and desirable locations/amenities.
- Typical properties (Median) generate around $2,405 per month, representing the average market performance.
- Entry-level properties (Bottom 25%) see earnings around $1,133, often with potential for optimization.
Average Monthly Airbnb Earnings Trend in City Of Armadale
City Of Armadale Airbnb Occupancy Rate Trends (2025)
Maximize your bookings by understanding the City Of Armadale STR occupancy trends. Seasonal demand shifts significantly influence how often properties are booked. Typically, Novembersees the highest demand (peak season occupancy), while June experiences the lowest (low season). Effective strategies, like adjusting minimum stays or offering promotions, can boost occupancy during slower periods. Here's how different property tiers perform in City Of Armadale:
- Best-in-class properties (Top 10%) achieve 90%+ occupancy, indicating high desirability and potentially optimized availability.
- Strong performing properties (Top 25%) maintain 84% or higher occupancy, suggesting good market fit and guest satisfaction.
- Typical properties (Median) have an occupancy rate around 66%.
- Entry-level properties (Bottom 25%) average 40% occupancy, potentially facing higher vacancy.
Average Monthly Occupancy Rate Trend in City Of Armadale
Average Daily Rate (ADR) Airbnb Trends in City Of Armadale (2025)
Effective short term rental pricing strategy in City Of Armadale involves understanding monthly ADR fluctuations. The Average Daily Rate (ADR) for Airbnb in City Of Armadale typically peaks in December and dips lowest during August. Leveraging Airbnb dynamic pricing tools or strategies based on this seasonality can significantly boost revenue. Here's a look at the typical nightly rates achieved:
- Best-in-class properties (Top 10%) command rates of $230+ per night, often due to premium features or locations.
- Strong performing properties (Top 25%) achieve nightly rates of $149 or more.
- Typical properties (Median) charge around $97 per night.
- Entry-level properties (Bottom 25%) earn around $53 per night.
Average Daily Rate (ADR) Trend by Month in City Of Armadale
Get Live City Of Armadale Market Intelligence 👇

Explore Real-time Analytics
Airbnb Seasonality Analysis & Trends in City Of Armadale (2025)
Peak Season (December, January, November)
- Revenue averages $3,515 per month
- Occupancy rates average 69.9%
- Daily rates average $137
Shoulder Season
- Revenue averages $2,694 per month
- Occupancy maintains around 59.1%
- Daily rates hold near $119
Low Season (April, June, July)
- Revenue drops to average $2,459 per month
- Occupancy decreases to average 54.5%
- Daily rates adjust to average $115
Seasonality Insights for City Of Armadale
- The Airbnb seasonality in City Of Armadale shows moderate seasonality with distinct peak and low periods. While the sections above show seasonal averages, it's also insightful to look at the extremes:
- During the high season, the absolute peak month showcases City Of Armadale's highest earning potential, with monthly revenues capable of climbing to $3,685, occupancy reaching a high of 73.9%, and ADRs peaking at $142.
- Conversely, the slowest single month of the year, typically falling within the low season, marks the market's lowest point. In this month, revenue might dip to $2,395, occupancy could drop to 49.8%, and ADRs may adjust down to $112.
- Understanding both the seasonal averages and these monthly peaks and troughs in revenue, occupancy, and ADR is crucial for maximizing your Airbnb profit potential in City Of Armadale.
Seasonal Strategies for Maximizing Profit
- Peak Season: Maximize revenue through premium pricing and potentially longer minimum stays. Ensure high availability.
- Low Season: Offer competitive pricing, special promotions (e.g., extended stay discounts), and flexible cancellation policies. Target off-season travelers like remote workers or budget-conscious guests.
- Shoulder Seasons: Implement dynamic pricing that balances peak and low rates. Target weekend travelers or specific events. Offer slightly more flexible terms than peak season.
- Regularly analyze your own performance against these City Of Armadale seasonality benchmarks and adjust your pricing and availability strategy accordingly.
Best Areas for Airbnb Investment in City Of Armadale (2025)
Exploring the top neighborhoods for short-term rentals in City Of Armadale? This section highlights key areas, outlining why they are attractive for hosts and guests, along with notable local attractions. Consider these locations based on your target guest profile and investment strategy.
| Neighborhood / Area | Why Host Here? (Target Guests & Appeal) | Key Attractions & Landmarks |
|---|---|---|
| Jullamar | A serene and spacious neighborhood ideal for families and nature lovers, providing a peaceful environment with easy access to parks and recreational spaces. | Armadale Aquatic Centre, Armadale Park, Nearby nature reserves, Walking and bike trails |
| Armadaile Town Centre | The bustling heart of Armadale with shopping, dining, and entertainment options. Excellent for attracting tourists looking for convenience and accessibility. | Armadale Shopping City, Local restaurants and cafes, Armadale history museum |
| Champion Lakes | Known for its picturesque lakes and recreational activities, appealing to outdoor enthusiasts and those seeking a tranquil retreat close to nature. | Champion Lakes Regatta Centre, Kayaking and paddleboarding, Picnic areas, Nature trails |
| Seville Grove | A growing suburb with a vibrant community, ideal for those looking for affordable accommodation in a suburban setting. | Local parks, Community events, Shopping facilities |
| Mount Richon | An elevated area offering stunning views and a quieter lifestyle, appealing to those looking for a peaceful getaway close to nature. | Mount Richon lookout, Walking trails, Nature landscapes |
| Kelmscott | A neighboring suburb with rich history and affordability, making it attractive for families and budget-conscious travelers. | Historical sites, Local parks, Shopping amenities |
| Forrestdale | Known for its family-friendly atmosphere and proximity to schools and amenities, great for families and long-term stays. | Local schools, Parks, Community facilities |
| Piara Waters | A rapidly developing suburb with modern amenities and parks, appealing to those seeking a new community vibe. | New residential developments, Parks and recreational areas, Shopping facilities |
Understanding Airbnb License Requirements & STR Laws in City Of Armadale (2025)
Yes, City Of Armadale, Western Australia, Australia enforces high STR regulations. Obtaining a license and ensuring compliance is almost certainly required according to current 2025 STR laws. Always verify the latest short term rental regulations and Airbnb license requirements directly with local government authorities for City Of Armadale to ensure full compliance before hosting.
(Source: AirROI data, 2025, based on 56% licensed listings)
Top Performing Airbnb Properties in City Of Armadale (2025)
Benchmark your potential! Explore examples of top-performing Airbnb properties in City Of Armadalebased on Trailing Twelve Month (TTM) revenue. Analyze their characteristics, revenue, occupancy rate, and ADR to understand what drives success in this market.
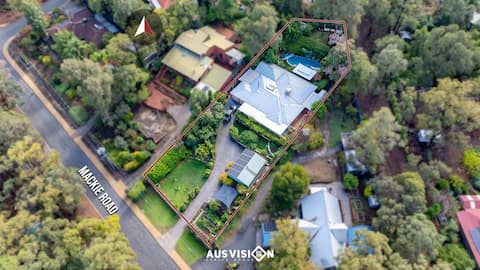
Perth Hill Poolside Paradise BBQ,Mini golf,Airport
Entire Place • 4 bedrooms
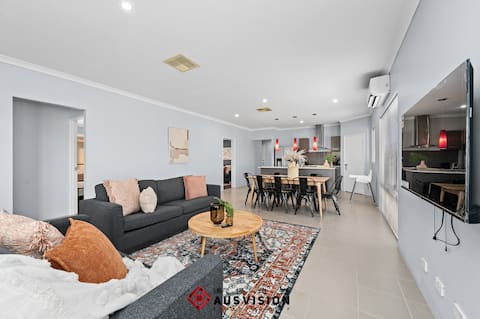
Bella Vista Bliss 5BRx2BA-Perth Quality Stay
Entire Place • 5 bedrooms
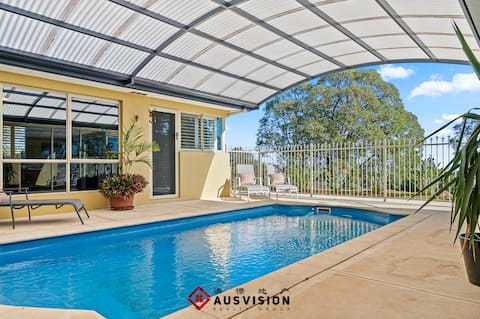
Perth Nr Airport Botanic Retreat-Pool &BBQ-18 Pax
Entire Place • 6 bedrooms
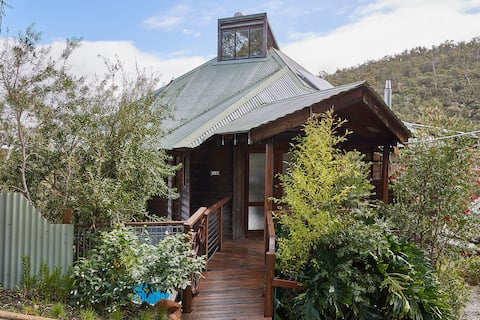
Treehouse with a View
Entire Place • 3 bedrooms
The Little Home on Honey
Entire Place • 2 bedrooms
Perth Hill-Country Style Getaway
Entire Place • 5 bedrooms
Note: Performance varies based on location, size, amenities, seasonality, and management quality. Data reflects the past 12 months.
Top Performing Airbnb Hosts in City Of Armadale (2025)
Learn from the best! This table showcases top-performing Airbnb hosts in City Of Armadale based on the number of properties managed and estimated total revenue over the past year. Analyze their scale and performance metrics.
| Host Name | Properties | Grossing Revenue | Stay Reviews | Avg Rating |
|---|---|---|---|---|
| Lucy | 3 | $214,674 | 68 | 4.92/5.0 |
| Sally | 1 | $50,160 | 82 | 4.94/5.0 |
| Eliska | 1 | $48,048 | 91 | 4.96/5.0 |
| Zhiqiang | 1 | $47,324 | 13 | 4.69/5.0 |
| Executive Escapes | 1 | $46,594 | 14 | 4.50/5.0 |
| Albert | 1 | $45,392 | 15 | 5.00/5.0 |
| Emilio | 1 | $44,189 | 38 | 4.82/5.0 |
| Dani | 1 | $37,641 | 75 | 4.93/5.0 |
| The | 1 | $37,554 | 92 | 4.70/5.0 |
| Isa | 1 | $31,633 | 48 | 4.92/5.0 |
Analyzing the strategies of top hosts, such as their property selection, pricing, and guest communication, can offer valuable lessons for optimizing your own Airbnb operations in City Of Armadale.
Dive Deeper: Advanced City Of Armadale STR Market Data (2025)
Ready to unlock more insights? AirROI provides access to advanced metrics and comprehensive Airbnb data for City Of Armadale. Explore detailed analytics beyond this report to refine your investment strategy, optimize pricing, and maximize your vacation rental profits.
Explore Advanced MetricsCity Of Armadale Short-Term Rental Market Composition (2025): Property & Room Types
Room Type Distribution
Property Type Distribution
Market Composition Insights for City Of Armadale
- The City Of Armadale Airbnb market composition is heavily skewed towards Entire Home/Apt listings, which make up 59.4% of the 32 active rentals. This indicates strong guest preference for privacy and space.
- However, a notable 40.6% share for Private Rooms suggests opportunities for budget-conscious travelers or hosts renting out spare rooms.
- Looking at the property type distribution in City Of Armadale, House properties are the most common (78.1%), reflecting the local real estate landscape.
- Houses represent a significant 78.1% portion, catering likely to families or larger groups.
- The presence of 18.8% Hotel/Boutique listings indicates integration with traditional hospitality.
- Smaller segments like others (combined 3.1%) offer potential for unique stay experiences.
City Of Armadale Airbnb Room Capacity Analysis (2025): Bedroom Distribution
Distribution of Listings by Number of Bedrooms
Room Capacity Insights for City Of Armadale
- The dominant room capacity in City Of Armadale is 1 bedroom listings, making up 25% of the market. This suggests a strong demand for properties suitable for couples or solo travelers.
- Together, 1 bedroom and 3 bedrooms properties represent 40.6% of the active Airbnb listings in City Of Armadale, indicating a high concentration in these sizes.
- A significant 37.5% of listings offer 3+ bedrooms, catering to larger groups and families seeking more space in City Of Armadale.
City Of Armadale Vacation Rental Guest Capacity Trends (2025)
Distribution of Listings by Guest Capacity
Guest Capacity Insights for City Of Armadale
- The most common guest capacity trend in City Of Armadale vacation rentals is listings accommodating 8+ guests (18.8%). This suggests the primary traveler segment is likely larger groups.
- Properties designed for 8+ guests and 2 guests dominate the City Of Armadale STR market, accounting for 34.4% of listings.
- 37.5% of properties accommodate 6+ guests, serving the market segment for larger families or group travel in City Of Armadale.
- On average, properties in City Of Armadale are equipped to host 3.8 guests.
City Of Armadale Airbnb Booking Patterns (2025): Available vs. Booked Days
Available Days Distribution
Booked Days Distribution
Booking Pattern Insights for City Of Armadale
- The most common availability pattern in City Of Armadale falls within the 181-270 days range, representing 31.3% of listings. This suggests many properties have significant open periods on their calendars.
- Approximately 53.2% of listings show high availability (181+ days open annually), indicating potential for increased bookings or specific owner usage patterns.
- For booked days, the 271-366 days range is most frequent in City Of Armadale (28.1%), reflecting common guest stay durations or potential owner blocking patterns.
- A notable 50.0% of properties secure long booking periods (181+ days booked per year), highlighting successful long-term rental strategies or significant owner usage.
City Of Armadale Airbnb Minimum Stay Requirements Analysis
Distribution of Listings by Minimum Night Requirement
1 Night
6 listings
24% of total
2 Nights
5 listings
20% of total
3 Nights
2 listings
8% of total
4-6 Nights
4 listings
16% of total
7-29 Nights
1 listings
4% of total
30+ Nights
7 listings
28% of total
Key Insights
- The most prevalent minimum stay requirement in City Of Armadale is 30+ Nights, adopted by 28% of listings. This highlights the market's preference for longer commitments.
- A significant segment (28%) caters to monthly stays (30+ nights) in City Of Armadale, pointing to opportunities in the extended-stay market.
Recommendations
- Align with the market by considering a 30+ Nights minimum stay, as 28% of City Of Armadale hosts use this setting.
- If feasible, allowing 1-night stays, especially midweek or during low season, could capture last-minute bookings, as only 24% currently do.
- Explore offering discounts for stays of 30+ nights to attract the 28% of the market seeking extended stays.
- Adjust minimum nights based on seasonality – potentially shorter during low season and longer during peak demand periods in City Of Armadale.
City Of Armadale Airbnb Cancellation Policy Trends Analysis (2025)
Super Strict 30 Days
1 listings
3.7% of total
Flexible
5 listings
18.5% of total
Moderate
6 listings
22.2% of total
Firm
9 listings
33.3% of total
Strict
6 listings
22.2% of total
Cancellation Policy Insights for City Of Armadale
- The prevailing Airbnb cancellation policy trend in City Of Armadale is Firm, used by 33.3% of listings.
- A majority (55.5%) of hosts in City Of Armadale utilize Firm or Strict policies, indicating a market where hosts prioritize booking security.
Recommendations for Hosts
- Consider adopting a Firm policy to align with the 33.3% market standard in City Of Armadale.
- Regularly review your cancellation policy against competitors and market demand shifts in City Of Armadale.
City Of Armadale STR Booking Lead Time Analysis (2025)
Average Booking Lead Time by Month
Booking Lead Time Insights for City Of Armadale
- The overall average booking lead time for vacation rentals in City Of Armadale is 46 days.
- Guests book furthest in advance for stays during May (average 82 days), likely coinciding with peak travel demand or local events.
- The shortest booking windows occur for stays in November (average 32 days), indicating more last-minute travel plans during this time.
- Seasonally, Spring (68 days avg.) sees the longest lead times, while Fall (40 days avg.) has the shortest, reflecting typical travel planning cycles.
Recommendations for Hosts
- Use the overall average lead time (46 days) as a baseline for your pricing and availability strategy in City Of Armadale.
- For May stays, consider implementing length-of-stay discounts or slightly higher rates for bookings made less than 82 days out to capitalize on advance planning.
- Target marketing efforts for the Spring season well in advance (at least 68 days) to capture early planners.
- Monitor your own booking lead times against these City Of Armadale averages to identify opportunities for dynamic pricing adjustments.
Popular & Essential Airbnb Amenities in City Of Armadale (2025)
Amenity Prevalence
Amenity Insights for City Of Armadale
- Essential amenities in City Of Armadale that guests expect include: Heating, Air conditioning. Lacking these (any) could significantly impact bookings.
- Popular amenities like Hot water, Kitchen, Wifi are common but not universal. Offering these can provide a competitive edge.
- Warning: Wifi is not universally provided but is considered essential globally. Ensure reliable Wifi is offered.
Recommendations for Hosts
- Ensure your listing includes all essential amenities for City Of Armadale: Heating, Air conditioning.
- Prioritize adding missing essentials: Heating, Air conditioning.
- Consider adding popular differentiators like Hot water or Kitchen to increase appeal.
- Highlight unique or less common amenities you offer (e.g., hot tub, dedicated workspace, EV charger) in your listing description and photos.
- Regularly check competitor amenities in City Of Armadale to stay competitive.
City Of Armadale Airbnb Guest Demographics & Profile Analysis (2025)
Guest Profile Summary for City Of Armadale
- The typical guest profile for Airbnb in City Of Armadale consists of primarily domestic travelers (72%), often arriving from nearby Perth, typically belonging to the Post-2000s (Gen Z/Alpha) group (50%), primarily speaking English or Chinese.
- Domestic travelers account for 71.8% of guests.
- Key international markets include Australia (71.8%) and Singapore (8.1%).
- Top languages spoken are English (61.3%) followed by Chinese (4.5%).
- A significant demographic segment is the Post-2000s (Gen Z/Alpha) group, representing 50% of guests.
Recommendations for Hosts
- Target domestic marketing efforts towards travelers from Perth and Western Australia.
- Tailor amenities and listing descriptions to appeal to the dominant Post-2000s (Gen Z/Alpha) demographic (e.g., highlight fast WiFi, smart home features, local guides).
- Highlight unique local experiences or amenities relevant to the primary guest profile.
- Consider seasonal promotions aligned with peak travel times for key origin markets.
Nearby Short-Term Rental Market Comparison
How does the City Of Armadale Airbnb market stack up against its neighbors? Compare key performance metrics like average monthly revenue, ADR, and occupancy rates in surrounding areas to understand the broader regional STR landscape.
| Market | Active Properties | Monthly Revenue | Daily Rate | Avg. Occupancy |
|---|---|---|---|---|
| Gracetown | 34 | $4,562 | $358.38 | 47% |
| Cottesloe | 138 | $4,018 | $230.16 | 66% |
| Margaret River | 410 | $3,882 | $218.78 | 61% |
| Gnarabup | 88 | $3,791 | $265.86 | 52% |
| Prevelly | 41 | $3,790 | $238.98 | 57% |
| Dunsborough | 446 | $3,762 | $289.15 | 48% |
| Yallingup | 238 | $3,754 | $334.67 | 46% |
| Peppermint Grove Beach | 35 | $3,750 | $326.50 | 39% |
| City Of Busselton | 535 | $3,637 | $301.10 | 44% |
| Swanbourne | 10 | $3,608 | $326.94 | 49% |