Busselton Airbnb Market Analysis 2025: Short Term Rental Data & Vacation Rental Statistics in Western Australia, Australia
Is Airbnb profitable in Busselton in 2025? Explore comprehensive Airbnb analytics for Busselton, Western Australia, Australia to uncover income potential. This 2025 STR market report for Busselton, based on AirROI data from April 2024 to March 2025, reveals key trends in the market of 212 active listings.
Whether you're considering an Airbnb investment in Busselton, optimizing your existing vacation rental, or exploring rental arbitrage opportunities, understanding the Busselton Airbnb data is crucial. Navigating the high regulation landscape is key to maximizing your short term rental income potential. Let's dive into the specifics.
Key Busselton Airbnb Performance Metrics Overview
Monthly Airbnb Revenue Variations & Income Potential in Busselton (2025)
Understanding the monthly revenue variations for Airbnb listings in Busselton is key to maximizing your short term rental income potential. Seasonality significantly impacts earnings. Our analysis, based on data from the past 12 months, shows that the peak revenue month for STRs in Busselton is typically January, while August often presents the lowest earnings, highlighting opportunities for strategic pricing adjustments during shoulder and low seasons. Explore the typical Airbnb income in Busselton across different performance tiers:
- Best-in-class properties (Top 10%) achieve $7,042+ monthly, often utilizing dynamic pricing and superior guest experiences.
- Strong performing properties (Top 25%) earn $4,933 or more, indicating effective management and desirable locations/amenities.
- Typical properties (Median) generate around $3,299 per month, representing the average market performance.
- Entry-level properties (Bottom 25%) see earnings around $2,027, often with potential for optimization.
Average Monthly Airbnb Earnings Trend in Busselton
Busselton Airbnb Occupancy Rate Trends (2025)
Maximize your bookings by understanding the Busselton STR occupancy trends. Seasonal demand shifts significantly influence how often properties are booked. Typically, Januarysees the highest demand (peak season occupancy), while June experiences the lowest (low season). Effective strategies, like adjusting minimum stays or offering promotions, can boost occupancy during slower periods. Here's how different property tiers perform in Busselton:
- Best-in-class properties (Top 10%) achieve 84%+ occupancy, indicating high desirability and potentially optimized availability.
- Strong performing properties (Top 25%) maintain 72% or higher occupancy, suggesting good market fit and guest satisfaction.
- Typical properties (Median) have an occupancy rate around 53%.
- Entry-level properties (Bottom 25%) average 35% occupancy, potentially facing higher vacancy.
Average Monthly Occupancy Rate Trend in Busselton
Average Daily Rate (ADR) Airbnb Trends in Busselton (2025)
Effective short term rental pricing strategy in Busselton involves understanding monthly ADR fluctuations. The Average Daily Rate (ADR) for Airbnb in Busselton typically peaks in January and dips lowest during August. Leveraging Airbnb dynamic pricing tools or strategies based on this seasonality can significantly boost revenue. Here's a look at the typical nightly rates achieved:
- Best-in-class properties (Top 10%) command rates of $343+ per night, often due to premium features or locations.
- Strong performing properties (Top 25%) achieve nightly rates of $262 or more.
- Typical properties (Median) charge around $192 per night.
- Entry-level properties (Bottom 25%) earn around $145 per night.
Average Daily Rate (ADR) Trend by Month in Busselton
Get Live Busselton Market Intelligence 👇

Explore Real-time Analytics
Airbnb Seasonality Analysis & Trends in Busselton (2025)
Peak Season (January, December, November)
- Revenue averages $5,394 per month
- Occupancy rates average 66.9%
- Daily rates average $260
Shoulder Season
- Revenue averages $3,394 per month
- Occupancy maintains around 48.3%
- Daily rates hold near $204
Low Season (March, July, August)
- Revenue drops to average $2,764 per month
- Occupancy decreases to average 45.0%
- Daily rates adjust to average $201
Seasonality Insights for Busselton
- The Airbnb seasonality in Busselton shows highly seasonal trends requiring careful strategy. While the sections above show seasonal averages, it's also insightful to look at the extremes:
- During the high season, the absolute peak month showcases Busselton's highest earning potential, with monthly revenues capable of climbing to $6,296, occupancy reaching a high of 70.8%, and ADRs peaking at $285.
- Conversely, the slowest single month of the year, typically falling within the low season, marks the market's lowest point. In this month, revenue might dip to $2,355, occupancy could drop to 38.1%, and ADRs may adjust down to $187.
- Understanding both the seasonal averages and these monthly peaks and troughs in revenue, occupancy, and ADR is crucial for maximizing your Airbnb profit potential in Busselton.
Seasonal Strategies for Maximizing Profit
- Peak Season: Maximize revenue through premium pricing and potentially longer minimum stays. Ensure high availability.
- Low Season: Offer competitive pricing, special promotions (e.g., extended stay discounts), and flexible cancellation policies. Target off-season travelers like remote workers or budget-conscious guests.
- Shoulder Seasons: Implement dynamic pricing that balances peak and low rates. Target weekend travelers or specific events. Offer slightly more flexible terms than peak season.
- Regularly analyze your own performance against these Busselton seasonality benchmarks and adjust your pricing and availability strategy accordingly.
Best Areas for Airbnb Investment in Busselton (2025)
Exploring the top neighborhoods for short-term rentals in Busselton? This section highlights key areas, outlining why they are attractive for hosts and guests, along with notable local attractions. Consider these locations based on your target guest profile and investment strategy.
| Neighborhood / Area | Why Host Here? (Target Guests & Appeal) | Key Attractions & Landmarks |
|---|---|---|
| Geographe Bay | A stunning waterfront location known for its beautiful beaches and calm waters, attracting families and tourists looking for a relaxing seaside getaway. | Busselton Jetty, Meelup Beach, Geographe Bay Regional Park, Dunsborough, Ngilgi Cave |
| Busselton Foreshore | The bustling foreshore area is popular for its walkways, parks, and proximity to the Busselton Jetty, making it ideal for short-term stays. | Busselton Jetty, Busselton Foreshore Park, Interpretive Centre, Whale Park, Busselton Market |
| Margaret River Region | Famous for its wineries, stunning scenery, and gourmet food, this region attracts tourists throughout the year seeking a countryside retreat. | Margaret River Wine Region, Surfing Beaches, Caves Road, Margaret River Chocolate Company, Vasse Felix |
| West Busselton | A quieter suburban area close to the beach and shopping centers, appealing to families and those looking for a peaceful stay. | Busselton Beach, Broadwater Par 3 Golf Course, Geographe Leisure Centre, Busselton Shopping Centre |
| Dunsborough | A popular holiday destination located a short drive from Busselton, known for its picturesque beaches and relaxed atmosphere. | Bunker Bay, Meelup Beach, Dunsborough Beach, Cape Naturaliste, Dunsborough Town Centre |
| Vasse | A growing area known for its proximity to vineyards and lakes, appealing to those looking for a mix of rural and coastal experience. | Vasse River, Margaret River Chocolate Company, Local Wineries, Geographe Bay |
| Cowaramup | A charming small town just north of Margaret River, known for its scenic landscapes and pet-friendly attractions, it is perfect for a rural retreat. | Cowaramup Bay, Cowaramup Brewing Company, Brewery Tours, Chocolate Factory |
| Yallingup | Known for stunning beaches and surf spots, it’s ideal for those looking for adventure and natural beauty near Busselton. | Yallingup Beach, Injidup Naturaliste Cape, Ngilgi Cave, Yallingup Galleries |
Understanding Airbnb License Requirements & STR Laws in Busselton (2025)
Yes, Busselton, Western Australia, Australia enforces high STR regulations. Obtaining a license and ensuring compliance is almost certainly required according to current 2025 STR laws. Always verify the latest short term rental regulations and Airbnb license requirements directly with local government authorities for Busselton to ensure full compliance before hosting.
(Source: AirROI data, 2025, based on 78% licensed listings)
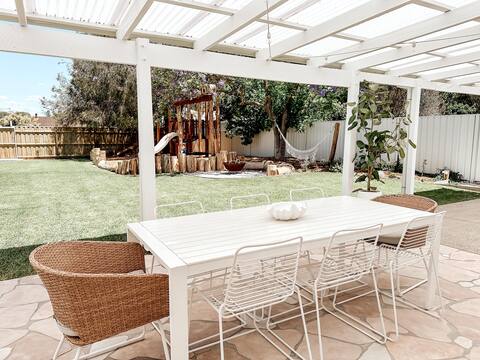
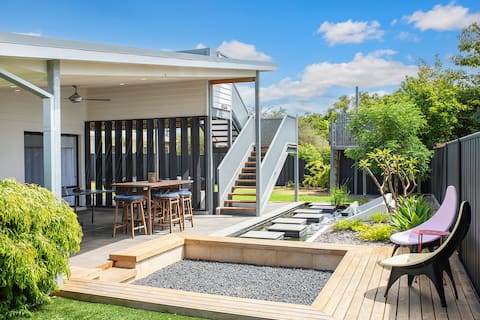
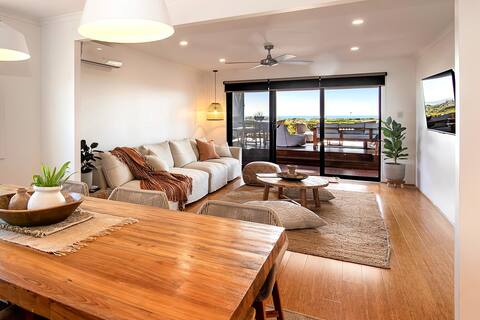
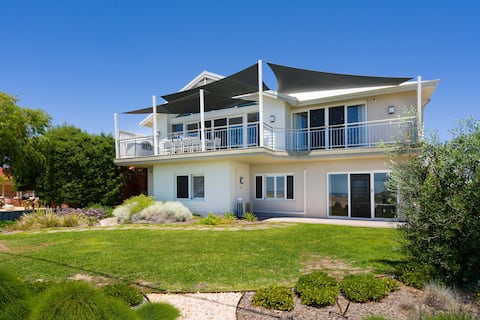
Top Performing Airbnb Properties in Busselton (2025)
Benchmark your potential! Explore examples of top-performing Airbnb properties in Busseltonbased on Trailing Twelve Month (TTM) revenue. Analyze their characteristics, revenue, occupancy rate, and ADR to understand what drives success in this market.
Flo, a seaside Scandi-coastal haven near the jetty
Entire Place • 3 bedrooms
Saltwater-200m beach
Entire Place • 4 bedrooms
"Ayatana" By The Bay Busselton
Entire Place • 4 bedrooms
Geographe Sails - Beachfront
Entire Place • 4 bedrooms
Ashdene Busselton
Entire Place • 4 bedrooms
The Pearl- 5 bedroom 5 Bathroom
Entire Place • 5 bedrooms
Note: Performance varies based on location, size, amenities, seasonality, and management quality. Data reflects the past 12 months.
Top Performing Airbnb Hosts in Busselton (2025)
Learn from the best! This table showcases top-performing Airbnb hosts in Busselton based on the number of properties managed and estimated total revenue over the past year. Analyze their scale and performance metrics.
| Host Name | Properties | Grossing Revenue | Stay Reviews | Avg Rating |
|---|---|---|---|---|
| Geographe Holiday Homes | 31 | $1,724,360 | 511 | 4.66/5.0 |
| Davinia | 31 | $1,684,455 | 3520 | 4.84/5.0 |
| Bree | 9 | $425,829 | 592 | 4.86/5.0 |
| DownSouth | 11 | $316,981 | 319 | 3.67/5.0 |
| Leanne | 4 | $173,071 | 367 | 4.89/5.0 |
| Baudins | 6 | $162,358 | 127 | 4.62/5.0 |
| Alexander | 4 | $125,131 | 48 | 4.98/5.0 |
| Claire | 1 | $114,469 | 58 | 4.98/5.0 |
| Linette | 1 | $108,755 | 36 | 5.00/5.0 |
| Exclusive Escapes | 3 | $106,850 | 50 | 4.78/5.0 |
Analyzing the strategies of top hosts, such as their property selection, pricing, and guest communication, can offer valuable lessons for optimizing your own Airbnb operations in Busselton.
Dive Deeper: Advanced Busselton STR Market Data (2025)
Ready to unlock more insights? AirROI provides access to advanced metrics and comprehensive Airbnb data for Busselton. Explore detailed analytics beyond this report to refine your investment strategy, optimize pricing, and maximize your vacation rental profits.
Explore Advanced MetricsBusselton Short-Term Rental Market Composition (2025): Property & Room Types
Room Type Distribution
Property Type Distribution
Market Composition Insights for Busselton
- The Busselton Airbnb market composition is heavily skewed towards Entire Home/Apt listings, which make up 86.8% of the 212 active rentals. This indicates strong guest preference for privacy and space.
- Looking at the property type distribution in Busselton, House properties are the most common (83.5%), reflecting the local real estate landscape.
- Houses represent a significant 83.5% portion, catering likely to families or larger groups.
- The presence of 9% Hotel/Boutique listings indicates integration with traditional hospitality.
- Smaller segments like apartment/condo, others, outdoor/unique (combined 7.5%) offer potential for unique stay experiences.
Busselton Airbnb Room Capacity Analysis (2025): Bedroom Distribution
Distribution of Listings by Number of Bedrooms
Room Capacity Insights for Busselton
- The dominant room capacity in Busselton is 3 bedrooms listings, making up 37.7% of the market. This suggests a strong demand for properties suitable for families or small groups.
- Together, 3 bedrooms and 4 bedrooms properties represent 62.2% of the active Airbnb listings in Busselton, indicating a high concentration in these sizes.
- A significant 66.9% of listings offer 3+ bedrooms, catering to larger groups and families seeking more space in Busselton.
Busselton Vacation Rental Guest Capacity Trends (2025)
Distribution of Listings by Guest Capacity
Guest Capacity Insights for Busselton
- The most common guest capacity trend in Busselton vacation rentals is listings accommodating 6 guests (33%). This suggests the primary traveler segment is likely larger groups.
- Properties designed for 6 guests and 8+ guests dominate the Busselton STR market, accounting for 60.4% of listings.
- 64.2% of properties accommodate 6+ guests, serving the market segment for larger families or group travel in Busselton.
- On average, properties in Busselton are equipped to host 5.5 guests.
Busselton Airbnb Booking Patterns (2025): Available vs. Booked Days
Available Days Distribution
Booked Days Distribution
Booking Pattern Insights for Busselton
- The most common availability pattern in Busselton falls within the 91-180 days range, representing 38.7% of listings. This suggests many properties have significant open periods on their calendars.
- Approximately 46.3% of listings show high availability (181+ days open annually), indicating potential for increased bookings or specific owner usage patterns.
- For booked days, the 181-270 days range is most frequent in Busselton (37.7%), reflecting common guest stay durations or potential owner blocking patterns.
- A notable 55.2% of properties secure long booking periods (181+ days booked per year), highlighting successful long-term rental strategies or significant owner usage.
Busselton Airbnb Minimum Stay Requirements Analysis
Distribution of Listings by Minimum Night Requirement
1 Night
23 listings
11.4% of total
2 Nights
53 listings
26.2% of total
3 Nights
18 listings
8.9% of total
4-6 Nights
9 listings
4.5% of total
7-29 Nights
5 listings
2.5% of total
30+ Nights
94 listings
46.5% of total
Key Insights
- The most prevalent minimum stay requirement in Busselton is 30+ Nights, adopted by 46.5% of listings. This highlights the market's preference for longer commitments.
- A significant segment (46.5%) caters to monthly stays (30+ nights) in Busselton, pointing to opportunities in the extended-stay market.
Recommendations
- Align with the market by considering a 30+ Nights minimum stay, as 46.5% of Busselton hosts use this setting.
- If feasible, allowing 1-night stays, especially midweek or during low season, could capture last-minute bookings, as only 11.4% currently do.
- Explore offering discounts for stays of 30+ nights to attract the 46.5% of the market seeking extended stays.
- Adjust minimum nights based on seasonality – potentially shorter during low season and longer during peak demand periods in Busselton.
Busselton Airbnb Cancellation Policy Trends Analysis (2025)
Super Strict 60 Days
19 listings
9.4% of total
Super Strict 30 Days
27 listings
13.3% of total
Flexible
20 listings
9.9% of total
Moderate
30 listings
14.8% of total
Firm
49 listings
24.1% of total
Strict
58 listings
28.6% of total
Cancellation Policy Insights for Busselton
- The prevailing Airbnb cancellation policy trend in Busselton is Strict, used by 28.6% of listings.
- A majority (52.7%) of hosts in Busselton utilize Firm or Strict policies, indicating a market where hosts prioritize booking security.
Recommendations for Hosts
- Consider adopting a Strict policy to align with the 28.6% market standard in Busselton.
- Regularly review your cancellation policy against competitors and market demand shifts in Busselton.
Busselton STR Booking Lead Time Analysis (2025)
Average Booking Lead Time by Month
Booking Lead Time Insights for Busselton
- The overall average booking lead time for vacation rentals in Busselton is 72 days.
- Guests book furthest in advance for stays during November (average 118 days), likely coinciding with peak travel demand or local events.
- The shortest booking windows occur for stays in August (average 40 days), indicating more last-minute travel plans during this time.
- Seasonally, Winter (96 days avg.) sees the longest lead times, while Summer (46 days avg.) has the shortest, reflecting typical travel planning cycles.
Recommendations for Hosts
- Use the overall average lead time (72 days) as a baseline for your pricing and availability strategy in Busselton.
- For November stays, consider implementing length-of-stay discounts or slightly higher rates for bookings made less than 118 days out to capitalize on advance planning.
- Target marketing efforts for the Winter season well in advance (at least 96 days) to capture early planners.
- Monitor your own booking lead times against these Busselton averages to identify opportunities for dynamic pricing adjustments.
Popular & Essential Airbnb Amenities in Busselton (2025)
Amenity Prevalence
Amenity Insights for Busselton
- Essential amenities in Busselton that guests expect include: TV, Free parking on premises, Heating, Air conditioning. Lacking these (any) could significantly impact bookings.
- Popular amenities like Kitchen, Smoke alarm, Microwave are common but not universal. Offering these can provide a competitive edge.
Recommendations for Hosts
- Ensure your listing includes all essential amenities for Busselton: TV, Free parking on premises, Heating, Air conditioning.
- Prioritize adding missing essentials: TV, Free parking on premises, Heating, Air conditioning.
- Consider adding popular differentiators like Kitchen or Smoke alarm to increase appeal.
- Highlight unique or less common amenities you offer (e.g., hot tub, dedicated workspace, EV charger) in your listing description and photos.
- Regularly check competitor amenities in Busselton to stay competitive.
Busselton Airbnb Guest Demographics & Profile Analysis (2025)
Guest Profile Summary for Busselton
- The typical guest profile for Airbnb in Busselton consists of primarily domestic travelers (79%), often arriving from nearby Perth, typically belonging to the Post-2000s (Gen Z/Alpha) group (50%), primarily speaking English or Chinese.
- Domestic travelers account for 78.8% of guests.
- Key international markets include Australia (78.8%) and Singapore (9.7%).
- Top languages spoken are English (66.3%) followed by Chinese (10.1%).
- A significant demographic segment is the Post-2000s (Gen Z/Alpha) group, representing 50% of guests.
Recommendations for Hosts
- Target domestic marketing efforts towards travelers from Perth and Western Australia.
- Tailor amenities and listing descriptions to appeal to the dominant Post-2000s (Gen Z/Alpha) demographic (e.g., highlight fast WiFi, smart home features, local guides).
- Highlight unique local experiences or amenities relevant to the primary guest profile.
- Consider seasonal promotions aligned with peak travel times for key origin markets.
Nearby Short-Term Rental Market Comparison
How does the Busselton Airbnb market stack up against its neighbors? Compare key performance metrics like average monthly revenue, ADR, and occupancy rates in surrounding areas to understand the broader regional STR landscape.
| Market | Active Properties | Monthly Revenue | Daily Rate | Avg. Occupancy |
|---|---|---|---|---|
| Gracetown | 34 | $4,562 | $358.38 | 47% |
| Margaret River | 410 | $3,882 | $218.78 | 61% |
| Shire Of Augusta Margaret River | 96 | $3,824 | $252.66 | 56% |
| Gnarabup | 88 | $3,791 | $265.86 | 52% |
| Prevelly | 41 | $3,790 | $238.98 | 57% |
| Dunsborough | 446 | $3,762 | $289.15 | 48% |
| Yallingup | 238 | $3,754 | $334.67 | 46% |
| Witchcliffe | 20 | $3,753 | $304.52 | 56% |
| Peppermint Grove Beach | 35 | $3,750 | $326.50 | 39% |
| City Of Busselton | 535 | $3,637 | $301.10 | 44% |