Boulder Airbnb Market Analysis 2025: Short Term Rental Data & Vacation Rental Statistics in Western Australia, Australia
Is Airbnb profitable in Boulder in 2025? Explore comprehensive Airbnb analytics for Boulder, Western Australia, Australia to uncover income potential. This 2025 STR market report for Boulder, based on AirROI data from April 2024 to March 2025, reveals key trends in the niche market of 19 active listings.
Whether you're considering an Airbnb investment in Boulder, optimizing your existing vacation rental, or exploring rental arbitrage opportunities, understanding the Boulder Airbnb data is crucial. Navigating the high regulation landscape is key to maximizing your short term rental income potential. Let's dive into the specifics.
Key Boulder Airbnb Performance Metrics Overview
Monthly Airbnb Revenue Variations & Income Potential in Boulder (2025)
Understanding the monthly revenue variations for Airbnb listings in Boulder is key to maximizing your short term rental income potential. Seasonality significantly impacts earnings. Our analysis, based on data from the past 12 months, shows that the peak revenue month for STRs in Boulder is typically June, while March often presents the lowest earnings, highlighting opportunities for strategic pricing adjustments during shoulder and low seasons. Explore the typical Airbnb income in Boulder across different performance tiers:
- Best-in-class properties (Top 10%) achieve $4,420+ monthly, often utilizing dynamic pricing and superior guest experiences.
- Strong performing properties (Top 25%) earn $2,982 or more, indicating effective management and desirable locations/amenities.
- Typical properties (Median) generate around $1,663 per month, representing the average market performance.
- Entry-level properties (Bottom 25%) see earnings around $596, often with potential for optimization.
Average Monthly Airbnb Earnings Trend in Boulder
Boulder Airbnb Occupancy Rate Trends (2025)
Maximize your bookings by understanding the Boulder STR occupancy trends. Seasonal demand shifts significantly influence how often properties are booked. Typically, Aprilsees the highest demand (peak season occupancy), while February experiences the lowest (low season). Effective strategies, like adjusting minimum stays or offering promotions, can boost occupancy during slower periods. Here's how different property tiers perform in Boulder:
- Best-in-class properties (Top 10%) achieve 68%+ occupancy, indicating high desirability and potentially optimized availability.
- Strong performing properties (Top 25%) maintain 56% or higher occupancy, suggesting good market fit and guest satisfaction.
- Typical properties (Median) have an occupancy rate around 35%.
- Entry-level properties (Bottom 25%) average 14% occupancy, potentially facing higher vacancy.
Average Monthly Occupancy Rate Trend in Boulder
Average Daily Rate (ADR) Airbnb Trends in Boulder (2025)
Effective short term rental pricing strategy in Boulder involves understanding monthly ADR fluctuations. The Average Daily Rate (ADR) for Airbnb in Boulder typically peaks in July and dips lowest during November. Leveraging Airbnb dynamic pricing tools or strategies based on this seasonality can significantly boost revenue. Here's a look at the typical nightly rates achieved:
- Best-in-class properties (Top 10%) command rates of $498+ per night, often due to premium features or locations.
- Strong performing properties (Top 25%) achieve nightly rates of $208 or more.
- Typical properties (Median) charge around $152 per night.
- Entry-level properties (Bottom 25%) earn around $129 per night.
Average Daily Rate (ADR) Trend by Month in Boulder
Get Live Boulder Market Intelligence 👇

Explore Real-time Analytics
Airbnb Seasonality Analysis & Trends in Boulder (2025)
Peak Season (June, April, May)
- Revenue averages $2,645 per month
- Occupancy rates average 42.1%
- Daily rates average $227
Shoulder Season
- Revenue averages $2,088 per month
- Occupancy maintains around 37.7%
- Daily rates hold near $208
Low Season (January, February, March)
- Revenue drops to average $1,385 per month
- Occupancy decreases to average 27.1%
- Daily rates adjust to average $192
Seasonality Insights for Boulder
- The Airbnb seasonality in Boulder shows highly seasonal trends requiring careful strategy. While the sections above show seasonal averages, it's also insightful to look at the extremes:
- During the high season, the absolute peak month showcases Boulder's highest earning potential, with monthly revenues capable of climbing to $2,985, occupancy reaching a high of 48.2%, and ADRs peaking at $229.
- Conversely, the slowest single month of the year, typically falling within the low season, marks the market's lowest point. In this month, revenue might dip to $1,051, occupancy could drop to 18.6%, and ADRs may adjust down to $188.
- Understanding both the seasonal averages and these monthly peaks and troughs in revenue, occupancy, and ADR is crucial for maximizing your Airbnb profit potential in Boulder.
Seasonal Strategies for Maximizing Profit
- Peak Season: Maximize revenue through premium pricing and potentially longer minimum stays. Ensure high availability.
- Low Season: Offer competitive pricing, special promotions (e.g., extended stay discounts), and flexible cancellation policies. Target off-season travelers like remote workers or budget-conscious guests.
- Shoulder Seasons: Implement dynamic pricing that balances peak and low rates. Target weekend travelers or specific events. Offer slightly more flexible terms than peak season.
- Regularly analyze your own performance against these Boulder seasonality benchmarks and adjust your pricing and availability strategy accordingly.
Best Areas for Airbnb Investment in Boulder (2025)
Exploring the top neighborhoods for short-term rentals in Boulder? This section highlights key areas, outlining why they are attractive for hosts and guests, along with notable local attractions. Consider these locations based on your target guest profile and investment strategy.
| Neighborhood / Area | Why Host Here? (Target Guests & Appeal) | Key Attractions & Landmarks |
|---|---|---|
| Boulder Beach | Stunning beach location offering pristine waters and natural beauty, perfect for water lovers and beachgoers. Its accessibility and picturesque scenery make it an attractive spot for tourists. | Boulder Beach, Cottesloe Beach, Rottnest Island Ferry, Coogee Beach, Hillarys Boat Harbour |
| Fremantle | Historical maritime city with vibrant culture and heritage, drawing visitors for its markets, festivals, and lively arts scene. Great for those looking to experience local history and diverse cuisine. | Fremantle Markets, Fremantle Prison, Fremantle Fishing Boat Harbour, Little Creatures Brewery, Fremantle Art Centre |
| Perth CBD | The central business district of Perth, bustling with shopping, dining, and cultural activities. An ideal area for business travelers and tourists looking to explore the city. | Art Gallery of Western Australia, Perth Cultural Centre, Elizabeth Quay, Perth Mint, Hay Street Mall |
| Swan Valley | Renowned wine region famous for its wineries, breweries, and gourmet food. A hotspot for foodies and wine enthusiasts seeking unique local experiences. | Swan Valley Wineries, Caversham Wildlife Park, Swan Valley Cuddly Animal Farm, Chocolate Company, Swan River |
| Scarborough | Popular beach destination known for its vibrant beachfront, surf culture, and nightlife. An attractive place for young travelers and families looking for seaside fun. | Scarborough Beach, Scarborough Amphitheatre, Kiteboarding at Scarborough, The Sunset Markets, Restaurants and Bars along the coast |
| Cottesloe | Iconic beach suburb famous for its beautiful sunsets, relaxed atmosphere, and the historic Cottesloe Hotel. A top choice for tourists wanting to unwind by the ocean. | Cottesloe Beach, Indo-Pacific Marine, Cottesloe Sculpture by the Sea, Cottesloe Hotel, Beachfront Restaurants |
| Rottnest Island | A pristine island paradise with incredible beaches, wildlife, and historical sites. Perfect for day-trippers and travelers looking for adventure. | The Quokkas, Karma Rottnest, Rottnest Island Authority Visitor Centre, Thompson Bay, The Basin |
| Araluen Botanic Park | Stunning gardens set in the picturesque hills of the Perth Hills, a perfect location for nature lovers and those seeking a tranquil escape. | Araluen Botanic Park, Perth Hills Wine Region, Walking Trails, Wildflower Displays, Picnic Areas |
Understanding Airbnb License Requirements & STR Laws in Boulder (2025)
Yes, Boulder, Western Australia, Australia enforces high STR regulations. Obtaining a license and ensuring compliance is almost certainly required according to current 2025 STR laws. Always verify the latest short term rental regulations and Airbnb license requirements directly with local government authorities for Boulder to ensure full compliance before hosting.
(Source: AirROI data, 2025, based on 47% licensed listings)
Top Performing Airbnb Properties in Boulder (2025)
Benchmark your potential! Explore examples of top-performing Airbnb properties in Boulderbased on Trailing Twelve Month (TTM) revenue. Analyze their characteristics, revenue, occupancy rate, and ADR to understand what drives success in this market.
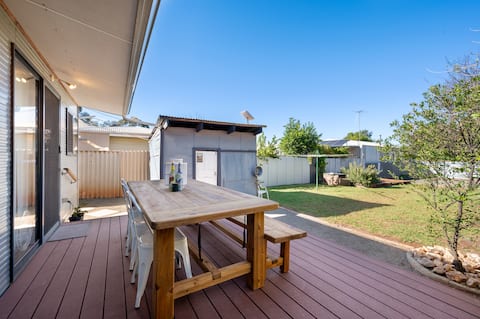
Pet Friendly ~Netflix ~10min Airport ~ BBQ+Dining
Entire Place • 2 bedrooms
Santika Place
Entire Place • 4 bedrooms
3A Home & Away 2x2 - Unit 3A
Entire Place • 2 bedrooms

Santika Cottage
Entire Place • 3 bedrooms
Home Away - 4 x 2 Main House
Entire Place • 4 bedrooms
3B Home & Away 2x2 - Unit 3B
Entire Place • 2 bedrooms
Note: Performance varies based on location, size, amenities, seasonality, and management quality. Data reflects the past 12 months.
Top Performing Airbnb Hosts in Boulder (2025)
Learn from the best! This table showcases top-performing Airbnb hosts in Boulder based on the number of properties managed and estimated total revenue over the past year. Analyze their scale and performance metrics.
| Host Name | Properties | Grossing Revenue | Stay Reviews | Avg Rating |
|---|---|---|---|---|
| Michelle | 6 | $95,364 | 35 | 3.33/5.0 |
| Ken | 2 | $68,690 | 61 | 4.97/5.0 |
| Airbnb Management Kalgoorlie | 2 | $47,654 | 23 | 4.83/5.0 |
| Roger | 4 | $39,426 | 261 | 4.41/5.0 |
| Sean | 1 | $9,734 | 5 | 4.60/5.0 |
| Le | 1 | $9,006 | 248 | 4.42/5.0 |
| Host #331577390 | 1 | $4,130 | 0 | 0.00/5.0 |
| Host #45646992 | 1 | $2,708 | 66 | 4.92/5.0 |
| Host #366012651 | 1 | $2,642 | 1 | 0.00/5.0 |
Analyzing the strategies of top hosts, such as their property selection, pricing, and guest communication, can offer valuable lessons for optimizing your own Airbnb operations in Boulder.
Dive Deeper: Advanced Boulder STR Market Data (2025)
Ready to unlock more insights? AirROI provides access to advanced metrics and comprehensive Airbnb data for Boulder. Explore detailed analytics beyond this report to refine your investment strategy, optimize pricing, and maximize your vacation rental profits.
Explore Advanced MetricsBoulder Short-Term Rental Market Composition (2025): Property & Room Types
Room Type Distribution
Property Type Distribution
Market Composition Insights for Boulder
- The Boulder Airbnb market composition is heavily skewed towards Entire Home/Apt listings, which make up 94.7% of the 19 active rentals. This indicates strong guest preference for privacy and space.
- Looking at the property type distribution in Boulder, House properties are the most common (52.6%), reflecting the local real estate landscape.
- Houses represent a significant 52.6% portion, catering likely to families or larger groups.
- The presence of 5.3% Hotel/Boutique listings indicates integration with traditional hospitality.
Boulder Airbnb Room Capacity Analysis (2025): Bedroom Distribution
Distribution of Listings by Number of Bedrooms
Room Capacity Insights for Boulder
- The dominant room capacity in Boulder is 2 bedrooms listings, making up 47.4% of the market. This suggests a strong demand for properties suitable for couples or solo travelers.
- Together, 2 bedrooms and 3 bedrooms properties represent 68.5% of the active Airbnb listings in Boulder, indicating a high concentration in these sizes.
- A significant 36.9% of listings offer 3+ bedrooms, catering to larger groups and families seeking more space in Boulder.
Boulder Vacation Rental Guest Capacity Trends (2025)
Distribution of Listings by Guest Capacity
Guest Capacity Insights for Boulder
- The most common guest capacity trend in Boulder vacation rentals is listings accommodating 4 guests (42.1%). This suggests the primary traveler segment is likely small families or groups.
- Properties designed for 4 guests and 6 guests dominate the Boulder STR market, accounting for 57.9% of listings.
- 31.6% of properties accommodate 6+ guests, serving the market segment for larger families or group travel in Boulder.
- On average, properties in Boulder are equipped to host 4.7 guests.
Boulder Airbnb Booking Patterns (2025): Available vs. Booked Days
Available Days Distribution
Booked Days Distribution
Booking Pattern Insights for Boulder
- The most common availability pattern in Boulder falls within the 271-366 days range, representing 68.4% of listings. This suggests many properties have significant open periods on their calendars.
- Approximately 89.5% of listings show high availability (181+ days open annually), indicating potential for increased bookings or specific owner usage patterns.
- For booked days, the 31-90 days range is most frequent in Boulder (42.1%), reflecting common guest stay durations or potential owner blocking patterns.
- A notable 10.6% of properties secure long booking periods (181+ days booked per year), highlighting successful long-term rental strategies or significant owner usage.
Boulder Airbnb Minimum Stay Requirements Analysis
Distribution of Listings by Minimum Night Requirement
1 Night
5 listings
31.3% of total
2 Nights
5 listings
31.3% of total
3 Nights
1 listings
6.3% of total
4-6 Nights
3 listings
18.8% of total
30+ Nights
2 listings
12.5% of total
Key Insights
- The most prevalent minimum stay requirement in Boulder is 1 Night, adopted by 31.3% of listings. This highlights the market's preference for shorter, flexible bookings.
- A strong majority (62.6%) of the Boulder Airbnb data shows acceptance of very short stays (1-2 nights), indicating a dynamic, high-turnover market.
- A significant segment (12.5%) caters to monthly stays (30+ nights) in Boulder, pointing to opportunities in the extended-stay market.
Recommendations
- Align with the market by considering a 1 Night minimum stay, as 31.3% of Boulder hosts use this setting.
- Explore offering discounts for stays of 30+ nights to attract the 12.5% of the market seeking extended stays.
- Adjust minimum nights based on seasonality – potentially shorter during low season and longer during peak demand periods in Boulder.
Boulder Airbnb Cancellation Policy Trends Analysis (2025)
Flexible
1 listings
7.1% of total
Moderate
5 listings
35.7% of total
Firm
3 listings
21.4% of total
Strict
5 listings
35.7% of total
Cancellation Policy Insights for Boulder
- The prevailing Airbnb cancellation policy trend in Boulder is Moderate, used by 35.7% of listings.
- A majority (57.1%) of hosts in Boulder utilize Firm or Strict policies, indicating a market where hosts prioritize booking security.
Recommendations for Hosts
- Consider adopting a Moderate policy to align with the 35.7% market standard in Boulder.
- With 35.7% using Strict terms, this is a viable option in Boulder, particularly for high-value properties or during peak demand periods.
- Regularly review your cancellation policy against competitors and market demand shifts in Boulder.
Boulder STR Booking Lead Time Analysis (2025)
Average Booking Lead Time by Month
Booking Lead Time Insights for Boulder
- The overall average booking lead time for vacation rentals in Boulder is 27 days.
- Guests book furthest in advance for stays during August (average 63 days), likely coinciding with peak travel demand or local events.
- The shortest booking windows occur for stays in November (average 5 days), indicating more last-minute travel plans during this time.
- Seasonally, Summer (45 days avg.) sees the longest lead times, while Winter (29 days avg.) has the shortest, reflecting typical travel planning cycles.
Recommendations for Hosts
- Use the overall average lead time (27 days) as a baseline for your pricing and availability strategy in Boulder.
- For August stays, consider implementing length-of-stay discounts or slightly higher rates for bookings made less than 63 days out to capitalize on advance planning.
- During November, focus on last-minute booking availability and promotions, as guests book with very short notice (5 days avg.).
- Target marketing efforts for the Summer season well in advance (at least 45 days) to capture early planners.
- Monitor your own booking lead times against these Boulder averages to identify opportunities for dynamic pricing adjustments.
Popular & Essential Airbnb Amenities in Boulder (2025)
Amenity Prevalence
Amenity Insights for Boulder
- Essential amenities in Boulder that guests expect include: Refrigerator, Free parking on premises, Wifi, Washer, Kitchen, TV, Smoke alarm. Lacking these (any) could significantly impact bookings.
- Popular amenities like Bed linens, Cooking basics, Air conditioning are common but not universal. Offering these can provide a competitive edge.
Recommendations for Hosts
- Ensure your listing includes all essential amenities for Boulder: Refrigerator, Free parking on premises, Wifi, Washer, Kitchen, TV, Smoke alarm.
- Consider adding popular differentiators like Bed linens or Cooking basics to increase appeal.
- Highlight unique or less common amenities you offer (e.g., hot tub, dedicated workspace, EV charger) in your listing description and photos.
- Regularly check competitor amenities in Boulder to stay competitive.
Boulder Airbnb Guest Demographics & Profile Analysis (2025)
Guest Profile Summary for Boulder
- The typical guest profile for Airbnb in Boulder consists of primarily domestic travelers (95%), often arriving from nearby Perth, typically belonging to the Post-2000s (Gen Z/Alpha) group (50%), primarily speaking English or Chinese.
- Domestic travelers account for 94.8% of guests.
- Key international markets include Australia (94.8%) and Austria (1.7%).
- Top languages spoken are English (77.8%) followed by Chinese (3.7%).
- A significant demographic segment is the Post-2000s (Gen Z/Alpha) group, representing 50% of guests.
Recommendations for Hosts
- Target domestic marketing efforts towards travelers from Perth and Western Australia.
- Tailor amenities and listing descriptions to appeal to the dominant Post-2000s (Gen Z/Alpha) demographic (e.g., highlight fast WiFi, smart home features, local guides).
- Highlight unique local experiences or amenities relevant to the primary guest profile.
- Consider seasonal promotions aligned with peak travel times for key origin markets.
Nearby Short-Term Rental Market Comparison
How does the Boulder Airbnb market stack up against its neighbors? Compare key performance metrics like average monthly revenue, ADR, and occupancy rates in surrounding areas to understand the broader regional STR landscape.
| Market | Active Properties | Monthly Revenue | Daily Rate | Avg. Occupancy |
|---|---|---|---|---|
| Kalgoorlie | 90 | $2,167 | $292.64 | 40% |