Belmont Airbnb Market Analysis 2025: Short Term Rental Data & Vacation Rental Statistics in Western Australia, Australia
Is Airbnb profitable in Belmont in 2025? Explore comprehensive Airbnb analytics for Belmont, Western Australia, Australia to uncover income potential. This 2025 STR market report for Belmont, based on AirROI data from April 2024 to March 2025, reveals key trends in the niche market of 40 active listings.
Whether you're considering an Airbnb investment in Belmont, optimizing your existing vacation rental, or exploring rental arbitrage opportunities, understanding the Belmont Airbnb data is crucial. Navigating the high regulation landscape is key to maximizing your short term rental income potential. Let's dive into the specifics.
Key Belmont Airbnb Performance Metrics Overview
Monthly Airbnb Revenue Variations & Income Potential in Belmont (2025)
Understanding the monthly revenue variations for Airbnb listings in Belmont is key to maximizing your short term rental income potential. Seasonality significantly impacts earnings. Our analysis, based on data from the past 12 months, shows that the peak revenue month for STRs in Belmont is typically September, while March often presents the lowest earnings, highlighting opportunities for strategic pricing adjustments during shoulder and low seasons. Explore the typical Airbnb income in Belmont across different performance tiers:
- Best-in-class properties (Top 10%) achieve $5,416+ monthly, often utilizing dynamic pricing and superior guest experiences.
- Strong performing properties (Top 25%) earn $3,657 or more, indicating effective management and desirable locations/amenities.
- Typical properties (Median) generate around $1,746 per month, representing the average market performance.
- Entry-level properties (Bottom 25%) see earnings around $1,044, often with potential for optimization.
Average Monthly Airbnb Earnings Trend in Belmont
Belmont Airbnb Occupancy Rate Trends (2025)
Maximize your bookings by understanding the Belmont STR occupancy trends. Seasonal demand shifts significantly influence how often properties are booked. Typically, Septembersees the highest demand (peak season occupancy), while May experiences the lowest (low season). Effective strategies, like adjusting minimum stays or offering promotions, can boost occupancy during slower periods. Here's how different property tiers perform in Belmont:
- Best-in-class properties (Top 10%) achieve 90%+ occupancy, indicating high desirability and potentially optimized availability.
- Strong performing properties (Top 25%) maintain 79% or higher occupancy, suggesting good market fit and guest satisfaction.
- Typical properties (Median) have an occupancy rate around 64%.
- Entry-level properties (Bottom 25%) average 41% occupancy, potentially facing higher vacancy.
Average Monthly Occupancy Rate Trend in Belmont
Average Daily Rate (ADR) Airbnb Trends in Belmont (2025)
Effective short term rental pricing strategy in Belmont involves understanding monthly ADR fluctuations. The Average Daily Rate (ADR) for Airbnb in Belmont typically peaks in December and dips lowest during April. Leveraging Airbnb dynamic pricing tools or strategies based on this seasonality can significantly boost revenue. Here's a look at the typical nightly rates achieved:
- Best-in-class properties (Top 10%) command rates of $249+ per night, often due to premium features or locations.
- Strong performing properties (Top 25%) achieve nightly rates of $172 or more.
- Typical properties (Median) charge around $101 per night.
- Entry-level properties (Bottom 25%) earn around $63 per night.
Average Daily Rate (ADR) Trend by Month in Belmont
Get Live Belmont Market Intelligence 👇

Explore Real-time Analytics
Airbnb Seasonality Analysis & Trends in Belmont (2025)
Peak Season (September, January, June)
- Revenue averages $2,831 per month
- Occupancy rates average 63.1%
- Daily rates average $136
Shoulder Season
- Revenue averages $2,595 per month
- Occupancy maintains around 58.7%
- Daily rates hold near $137
Low Season (February, March, August)
- Revenue drops to average $2,029 per month
- Occupancy decreases to average 57.2%
- Daily rates adjust to average $134
Seasonality Insights for Belmont
- The Airbnb seasonality in Belmont shows moderate seasonality with distinct peak and low periods. While the sections above show seasonal averages, it's also insightful to look at the extremes:
- During the high season, the absolute peak month showcases Belmont's highest earning potential, with monthly revenues capable of climbing to $2,867, occupancy reaching a high of 71.7%, and ADRs peaking at $146.
- Conversely, the slowest single month of the year, typically falling within the low season, marks the market's lowest point. In this month, revenue might dip to $1,651, occupancy could drop to 48.1%, and ADRs may adjust down to $132.
- Understanding both the seasonal averages and these monthly peaks and troughs in revenue, occupancy, and ADR is crucial for maximizing your Airbnb profit potential in Belmont.
Seasonal Strategies for Maximizing Profit
- Peak Season: Maximize revenue through premium pricing and potentially longer minimum stays. Ensure high availability.
- Low Season: Offer competitive pricing, special promotions (e.g., extended stay discounts), and flexible cancellation policies. Target off-season travelers like remote workers or budget-conscious guests.
- Shoulder Seasons: Implement dynamic pricing that balances peak and low rates. Target weekend travelers or specific events. Offer slightly more flexible terms than peak season.
- Regularly analyze your own performance against these Belmont seasonality benchmarks and adjust your pricing and availability strategy accordingly.
Best Areas for Airbnb Investment in Belmont (2025)
Exploring the top neighborhoods for short-term rentals in Belmont? This section highlights key areas, outlining why they are attractive for hosts and guests, along with notable local attractions. Consider these locations based on your target guest profile and investment strategy.
| Neighborhood / Area | Why Host Here? (Target Guests & Appeal) | Key Attractions & Landmarks |
|---|---|---|
| Cottesloe Beach | Known for its stunning beaches and vibrant atmosphere, Cottesloe is a popular destination for both locals and tourists, making it ideal for Airbnb hosting. | Cottesloe Beach, Cottesloe Hotel, Indiana Tea House, Marine Parade, sculpture by the sea |
| Fremantle | A historic, vibrant port city with a rich maritime history, art scene, and lively eateries, attracting many visitors throughout the year. | Fremantle Markets, Fremantle Prison, Cappuccino Strip, Rottnest Island Ferry, Little Creatures Brewery |
| Scarborough | Famous for its beautiful beaches and surf culture, Scarborough draws beachgoers and families looking for a summer getaway. | Scarborough Beach, Scarborough Surf Life Saving Club, Esplanade Park, Kite Surfing, Sunset Events |
| Mandurah | A growing tourist destination renowned for its waterways, dolphin watching, and relaxed coastal lifestyle, appealing to visitors of all ages. | Mandurah Dolphin Cruises, The Estuary, Mandurah Foreshore, Eating establishments, Arts and crafts galleries |
| Perth CBD | The hub of business and entertainment in Western Australia, perfect for business travelers and urban explorers excited to enjoy the city's nightlife and attractions. | Kings Park, Elizabeth Quay, Perth Cultural Centre, Perth Zoo, Hay Street Mall |
| Sorrento | A picturesque beachside suburb known for its stunning coastline and family-friendly activities, making it a hit with both locals and tourists. | Sorrento Beach, Hillarys Boat Harbour, AQWA – The Aquarium of Western Australia, Sorrento Quay Boardwalk, Fishing and diving activities |
| Nedlands | A charming suburb close to the Swan River and Kings Park, appealing to those who want a quieter stay while still being near the city. | Kings Park and Botanic Garden, Swan River, University of Western Australia, Nedlands Foreshore, Local cafes and eateries |
| South Perth | Offers stunning views of the Perth skyline across the river, and is a popular area for visitors wanting a picturesque setting close to the city. | South Perth Foreshore, Perth Zoo, Mends Street Jetty, Windsor Park, Historical sites |
Understanding Airbnb License Requirements & STR Laws in Belmont (2025)
Yes, Belmont, Western Australia, Australia enforces high STR regulations. Obtaining a license and ensuring compliance is almost certainly required according to current 2025 STR laws. Always verify the latest short term rental regulations and Airbnb license requirements directly with local government authorities for Belmont to ensure full compliance before hosting.
(Source: AirROI data, 2025, based on 53% licensed listings)
Top Performing Airbnb Properties in Belmont (2025)
Benchmark your potential! Explore examples of top-performing Airbnb properties in Belmontbased on Trailing Twelve Month (TTM) revenue. Analyze their characteristics, revenue, occupancy rate, and ADR to understand what drives success in this market.
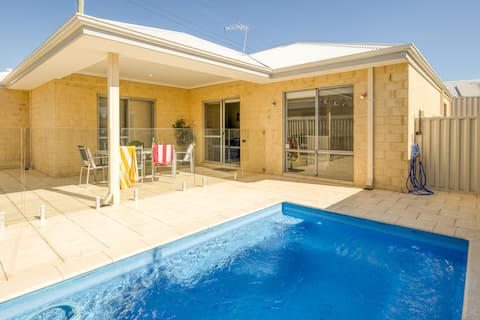
Belmont Beauty—Relaxing Poolside Stay for Families
Entire Place • 3 bedrooms

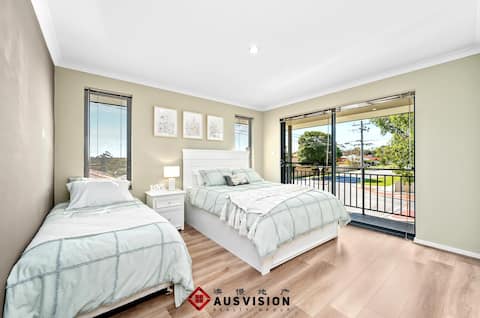
Remarkably Spacious & Well-equipped
Entire Place • 4 bedrooms
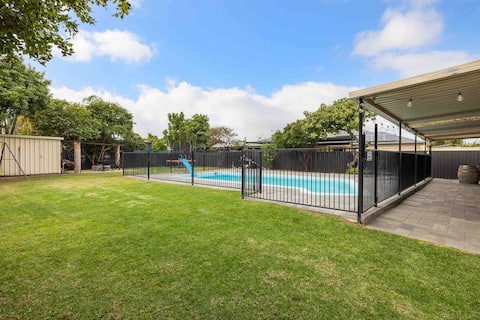
Family Oasis Retreat with pool
Entire Place • 4 bedrooms
Belmont Retreat-prime location near CBD & Airport
Entire Place • 3 bedrooms

Belmont Comfort: Central & Light-filled Stay
Entire Place • 3 bedrooms

Fun-Filled 3-BR Home Closed to Shops,Airport &City
Entire Place • 3 bedrooms
Note: Performance varies based on location, size, amenities, seasonality, and management quality. Data reflects the past 12 months.
Top Performing Airbnb Hosts in Belmont (2025)
Learn from the best! This table showcases top-performing Airbnb hosts in Belmont based on the number of properties managed and estimated total revenue over the past year. Analyze their scale and performance metrics.
| Host Name | Properties | Grossing Revenue | Stay Reviews | Avg Rating |
|---|---|---|---|---|
| Aoife | 2 | $143,089 | 148 | 4.79/5.0 |
| Anna | 2 | $139,705 | 73 | 4.92/5.0 |
| Lin | 8 | $86,851 | 539 | 4.78/5.0 |
| Holly | 1 | $67,296 | 44 | 4.57/5.0 |
| Jonathan | 1 | $57,662 | 43 | 4.70/5.0 |
| Wipul | 1 | $48,759 | 105 | 4.81/5.0 |
| Let Go | 1 | $41,692 | 45 | 4.36/5.0 |
| Lynda | 2 | $41,203 | 67 | 4.62/5.0 |
| Host #327192828 | 2 | $40,878 | 61 | 2.41/5.0 |
| Host #130089108 | 1 | $40,246 | 36 | 4.69/5.0 |
Analyzing the strategies of top hosts, such as their property selection, pricing, and guest communication, can offer valuable lessons for optimizing your own Airbnb operations in Belmont.
Dive Deeper: Advanced Belmont STR Market Data (2025)
Ready to unlock more insights? AirROI provides access to advanced metrics and comprehensive Airbnb data for Belmont. Explore detailed analytics beyond this report to refine your investment strategy, optimize pricing, and maximize your vacation rental profits.
Explore Advanced MetricsBelmont Short-Term Rental Market Composition (2025): Property & Room Types
Room Type Distribution
Property Type Distribution
Market Composition Insights for Belmont
- The Belmont Airbnb market composition is heavily skewed towards Entire Home/Apt listings, which make up 65% of the 40 active rentals. This indicates strong guest preference for privacy and space.
- However, a notable 35% share for Private Rooms suggests opportunities for budget-conscious travelers or hosts renting out spare rooms.
- Looking at the property type distribution in Belmont, House properties are the most common (77.5%), reflecting the local real estate landscape.
- Houses represent a significant 77.5% portion, catering likely to families or larger groups.
- Smaller segments like others (combined 2.5%) offer potential for unique stay experiences.
Belmont Airbnb Room Capacity Analysis (2025): Bedroom Distribution
Distribution of Listings by Number of Bedrooms
Room Capacity Insights for Belmont
- The dominant room capacity in Belmont is 3 bedrooms listings, making up 32.5% of the market. This suggests a strong demand for properties suitable for families or small groups.
- Together, 3 bedrooms and 1 bedroom properties represent 45.0% of the active Airbnb listings in Belmont, indicating a high concentration in these sizes.
- A significant 40.0% of listings offer 3+ bedrooms, catering to larger groups and families seeking more space in Belmont.
Belmont Vacation Rental Guest Capacity Trends (2025)
Distribution of Listings by Guest Capacity
Guest Capacity Insights for Belmont
- The most common guest capacity trend in Belmont vacation rentals is listings accommodating 6 guests (20%). This suggests the primary traveler segment is likely larger groups.
- Properties designed for 6 guests and 8+ guests dominate the Belmont STR market, accounting for 32.5% of listings.
- 37.5% of properties accommodate 6+ guests, serving the market segment for larger families or group travel in Belmont.
- On average, properties in Belmont are equipped to host 3.6 guests.
Belmont Airbnb Booking Patterns (2025): Available vs. Booked Days
Available Days Distribution
Booked Days Distribution
Booking Pattern Insights for Belmont
- The most common availability pattern in Belmont falls within the 91-180 days range, representing 37.5% of listings. This suggests many properties have significant open periods on their calendars.
- Approximately 42.5% of listings show high availability (181+ days open annually), indicating potential for increased bookings or specific owner usage patterns.
- For booked days, the 181-270 days range is most frequent in Belmont (37.5%), reflecting common guest stay durations or potential owner blocking patterns.
- A notable 60.0% of properties secure long booking periods (181+ days booked per year), highlighting successful long-term rental strategies or significant owner usage.
Belmont Airbnb Minimum Stay Requirements Analysis
Distribution of Listings by Minimum Night Requirement
1 Night
10 listings
31.3% of total
2 Nights
7 listings
21.9% of total
3 Nights
4 listings
12.5% of total
4-6 Nights
2 listings
6.3% of total
7-29 Nights
1 listings
3.1% of total
30+ Nights
8 listings
25% of total
Key Insights
- The most prevalent minimum stay requirement in Belmont is 1 Night, adopted by 31.3% of listings. This highlights the market's preference for shorter, flexible bookings.
- A significant segment (25%) caters to monthly stays (30+ nights) in Belmont, pointing to opportunities in the extended-stay market.
Recommendations
- Align with the market by considering a 1 Night minimum stay, as 31.3% of Belmont hosts use this setting.
- Explore offering discounts for stays of 30+ nights to attract the 25% of the market seeking extended stays.
- Adjust minimum nights based on seasonality – potentially shorter during low season and longer during peak demand periods in Belmont.
Belmont Airbnb Cancellation Policy Trends Analysis (2025)
Flexible
5 listings
15.2% of total
Moderate
6 listings
18.2% of total
Firm
5 listings
15.2% of total
Strict
17 listings
51.5% of total
Cancellation Policy Insights for Belmont
- The prevailing Airbnb cancellation policy trend in Belmont is Strict, used by 51.5% of listings.
- A majority (66.7%) of hosts in Belmont utilize Firm or Strict policies, indicating a market where hosts prioritize booking security.
Recommendations for Hosts
- Consider adopting a Strict policy to align with the 51.5% market standard in Belmont.
- With 51.5% using Strict terms, this is a viable option in Belmont, particularly for high-value properties or during peak demand periods.
- Regularly review your cancellation policy against competitors and market demand shifts in Belmont.
Belmont STR Booking Lead Time Analysis (2025)
Average Booking Lead Time by Month
Booking Lead Time Insights for Belmont
- The overall average booking lead time for vacation rentals in Belmont is 30 days.
- Guests book furthest in advance for stays during January (average 46 days), likely coinciding with peak travel demand or local events.
- The shortest booking windows occur for stays in August (average 23 days), indicating more last-minute travel plans during this time.
- Seasonally, Winter (39 days avg.) sees the longest lead times, while Summer (29 days avg.) has the shortest, reflecting typical travel planning cycles.
Recommendations for Hosts
- Use the overall average lead time (30 days) as a baseline for your pricing and availability strategy in Belmont.
- For January stays, consider implementing length-of-stay discounts or slightly higher rates for bookings made less than 46 days out to capitalize on advance planning.
- Target marketing efforts for the Winter season well in advance (at least 39 days) to capture early planners.
- Monitor your own booking lead times against these Belmont averages to identify opportunities for dynamic pricing adjustments.
Popular & Essential Airbnb Amenities in Belmont (2025)
Amenity Prevalence
Amenity Insights for Belmont
- Essential amenities in Belmont that guests expect include: Wifi, Hot water, Air conditioning, Washer, Kitchen, TV, Smoke alarm, Free parking on premises. Lacking these (any) could significantly impact bookings.
- Popular amenities like Heating, Shampoo are common but not universal. Offering these can provide a competitive edge.
Recommendations for Hosts
- Ensure your listing includes all essential amenities for Belmont: Wifi, Hot water, Air conditioning, Washer, Kitchen, TV, Smoke alarm, Free parking on premises.
- Prioritize adding missing essentials: Air conditioning, Washer, Kitchen, TV, Smoke alarm, Free parking on premises.
- Consider adding popular differentiators like Heating or Shampoo to increase appeal.
- Highlight unique or less common amenities you offer (e.g., hot tub, dedicated workspace, EV charger) in your listing description and photos.
- Regularly check competitor amenities in Belmont to stay competitive.
Belmont Airbnb Guest Demographics & Profile Analysis (2025)
Guest Profile Summary for Belmont
- The typical guest profile for Airbnb in Belmont consists of a mix of domestic (65%) and international guests, often arriving from nearby Perth, typically belonging to the Post-2000s (Gen Z/Alpha) group (50%), primarily speaking English or Chinese.
- Domestic travelers account for 64.7% of guests.
- Key international markets include Australia (64.7%) and Singapore (8.9%).
- Top languages spoken are English (63.2%) followed by Chinese (7.3%).
- A significant demographic segment is the Post-2000s (Gen Z/Alpha) group, representing 50% of guests.
Recommendations for Hosts
- Target domestic marketing efforts towards travelers from Perth and Melbourne.
- Tailor amenities and listing descriptions to appeal to the dominant Post-2000s (Gen Z/Alpha) demographic (e.g., highlight fast WiFi, smart home features, local guides).
- Highlight unique local experiences or amenities relevant to the primary guest profile.
- Consider seasonal promotions aligned with peak travel times for key origin markets.
Nearby Short-Term Rental Market Comparison
How does the Belmont Airbnb market stack up against its neighbors? Compare key performance metrics like average monthly revenue, ADR, and occupancy rates in surrounding areas to understand the broader regional STR landscape.
| Market | Active Properties | Monthly Revenue | Daily Rate | Avg. Occupancy |
|---|---|---|---|---|
| Cottesloe | 138 | $4,018 | $230.16 | 66% |
| Swanbourne | 10 | $3,608 | $326.94 | 49% |
| City of Mandurah | 29 | $2,989 | $218.84 | 46% |
| Shire Of Murray | 56 | $2,975 | $222.09 | 47% |
| Mosman Park | 49 | $2,967 | $195.80 | 64% |
| Mandurah | 387 | $2,963 | $241.70 | 48% |
| Dwellingup | 18 | $2,954 | $149.11 | 64% |
| South Fremantle | 74 | $2,896 | $177.02 | 61% |
| Shire Of Toodyay | 17 | $2,868 | $231.11 | 44% |
| North Fremantle | 29 | $2,821 | $189.18 | 62% |