Augusta Airbnb Market Analysis 2025: Short Term Rental Data & Vacation Rental Statistics in Western Australia, Australia
Is Airbnb profitable in Augusta in 2025? Explore comprehensive Airbnb analytics for Augusta, Western Australia, Australia to uncover income potential. This 2025 STR market report for Augusta, based on AirROI data from April 2024 to March 2025, reveals key trends in the niche market of 81 active listings.
Whether you're considering an Airbnb investment in Augusta, optimizing your existing vacation rental, or exploring rental arbitrage opportunities, understanding the Augusta Airbnb data is crucial. Navigating the high regulation landscape is key to maximizing your short term rental income potential. Let's dive into the specifics.
Key Augusta Airbnb Performance Metrics Overview
Monthly Airbnb Revenue Variations & Income Potential in Augusta (2025)
Understanding the monthly revenue variations for Airbnb listings in Augusta is key to maximizing your short term rental income potential. Seasonality significantly impacts earnings. Our analysis, based on data from the past 12 months, shows that the peak revenue month for STRs in Augusta is typically January, while August often presents the lowest earnings, highlighting opportunities for strategic pricing adjustments during shoulder and low seasons. Explore the typical Airbnb income in Augusta across different performance tiers:
- Best-in-class properties (Top 10%) achieve $5,153+ monthly, often utilizing dynamic pricing and superior guest experiences.
- Strong performing properties (Top 25%) earn $3,733 or more, indicating effective management and desirable locations/amenities.
- Typical properties (Median) generate around $2,314 per month, representing the average market performance.
- Entry-level properties (Bottom 25%) see earnings around $972, often with potential for optimization.
Average Monthly Airbnb Earnings Trend in Augusta
Augusta Airbnb Occupancy Rate Trends (2025)
Maximize your bookings by understanding the Augusta STR occupancy trends. Seasonal demand shifts significantly influence how often properties are booked. Typically, Januarysees the highest demand (peak season occupancy), while May experiences the lowest (low season). Effective strategies, like adjusting minimum stays or offering promotions, can boost occupancy during slower periods. Here's how different property tiers perform in Augusta:
- Best-in-class properties (Top 10%) achieve 74%+ occupancy, indicating high desirability and potentially optimized availability.
- Strong performing properties (Top 25%) maintain 55% or higher occupancy, suggesting good market fit and guest satisfaction.
- Typical properties (Median) have an occupancy rate around 34%.
- Entry-level properties (Bottom 25%) average 17% occupancy, potentially facing higher vacancy.
Average Monthly Occupancy Rate Trend in Augusta
Average Daily Rate (ADR) Airbnb Trends in Augusta (2025)
Effective short term rental pricing strategy in Augusta involves understanding monthly ADR fluctuations. The Average Daily Rate (ADR) for Airbnb in Augusta typically peaks in January and dips lowest during May. Leveraging Airbnb dynamic pricing tools or strategies based on this seasonality can significantly boost revenue. Here's a look at the typical nightly rates achieved:
- Best-in-class properties (Top 10%) command rates of $320+ per night, often due to premium features or locations.
- Strong performing properties (Top 25%) achieve nightly rates of $256 or more.
- Typical properties (Median) charge around $200 per night.
- Entry-level properties (Bottom 25%) earn around $140 per night.
Average Daily Rate (ADR) Trend by Month in Augusta
Get Live Augusta Market Intelligence 👇

Explore Real-time Analytics
Airbnb Seasonality Analysis & Trends in Augusta (2025)
Peak Season (January, December, April)
- Revenue averages $3,547 per month
- Occupancy rates average 48.6%
- Daily rates average $216
Shoulder Season
- Revenue averages $2,368 per month
- Occupancy maintains around 35.4%
- Daily rates hold near $200
Low Season (March, July, August)
- Revenue drops to average $1,951 per month
- Occupancy decreases to average 32.3%
- Daily rates adjust to average $203
Seasonality Insights for Augusta
- The Airbnb seasonality in Augusta shows highly seasonal trends requiring careful strategy. While the sections above show seasonal averages, it's also insightful to look at the extremes:
- During the high season, the absolute peak month showcases Augusta's highest earning potential, with monthly revenues capable of climbing to $4,204, occupancy reaching a high of 58.4%, and ADRs peaking at $227.
- Conversely, the slowest single month of the year, typically falling within the low season, marks the market's lowest point. In this month, revenue might dip to $1,904, occupancy could drop to 31.3%, and ADRs may adjust down to $193.
- Understanding both the seasonal averages and these monthly peaks and troughs in revenue, occupancy, and ADR is crucial for maximizing your Airbnb profit potential in Augusta.
Seasonal Strategies for Maximizing Profit
- Peak Season: Maximize revenue through premium pricing and potentially longer minimum stays. Ensure high availability.
- Low Season: Offer competitive pricing, special promotions (e.g., extended stay discounts), and flexible cancellation policies. Target off-season travelers like remote workers or budget-conscious guests.
- Shoulder Seasons: Implement dynamic pricing that balances peak and low rates. Target weekend travelers or specific events. Offer slightly more flexible terms than peak season.
- Regularly analyze your own performance against these Augusta seasonality benchmarks and adjust your pricing and availability strategy accordingly.
Best Areas for Airbnb Investment in Augusta (2025)
Exploring the top neighborhoods for short-term rentals in Augusta? This section highlights key areas, outlining why they are attractive for hosts and guests, along with notable local attractions. Consider these locations based on your target guest profile and investment strategy.
| Neighborhood / Area | Why Host Here? (Target Guests & Appeal) | Key Attractions & Landmarks |
|---|---|---|
| Little Grove | A picturesque area on the shores of Princess Royal Harbour, known for its calm beaches and proximity to Albany, making it a great spot for families and those seeking a quiet retreat. | Little Grove Beach, Albany Entertainment Centre, Albany Heritage Park, Whaleworld, Princess Royal Fortress |
| Mount Barker | Located inland, this area is known for its beautiful countryside and wineries, attracting visitors interested in outdoor activities and wine tourism. | St Werburghs Vineyard, Porongurup National Park, Mount Barker Summit, Local wineries, Barker Brook |
| Emu Point | A popular beachside destination ideal for water sports, fishing, and relaxing. The area is family-friendly and offers stunning coastal views. | Emu Point Beach, Whale Watching, Albany Marina, Local cafes and restaurants, Fishing spots |
| Denmark | A charming village known for its stunning natural scenery, forest walks and local agriculture. It's popular with eco-tourists and those seeking a peaceful getaway. | Greens Pool, Denmark Animal Farm, Wilson Inlet, Local wineries, Scandosia Cafe |
| Torbay | A serene coastal area with beautiful beaches and nearby national parks, appealing to nature lovers and those looking to unwind by the ocean. | Torbay Inlet, Little Beach, Nearby national parks, Snorkeling sites, Fishing spots |
| Albany | The historic town center features rich heritage, stunning coastal views, and proximity to national parks and historical sites, appealing to history buffs and outdoor enthusiasts alike. | Albany Historic Whaling Station, Desert Mounted Corps Memorial, National Anzac Centre, Mount Clarence Lookout, Albany Whale Tours |
| Frenchman Bay | Known for its stunning ocean views and easy access to beaches, this area attracts those looking for a relaxed coastal experience as well as outdoor activities. | Frenchman Bay Beach, The Gap and Natural Bridge, Fisheries Beach, Nearby hiking trails, Wildlife spotting |
| Nornalup | A peaceful coastal town nestled by the national park, ideal for those wanting to explore the natural beauty of the Walpole region and its famous tree canopy walk. | Nornalup Inlet, Walpole-Nornalup National Park, Gondwana Link, Tree Top Walk, Local artisan markets |
Understanding Airbnb License Requirements & STR Laws in Augusta (2025)
Yes, Augusta, Western Australia, Australia enforces high STR regulations. Obtaining a license and ensuring compliance is almost certainly required according to current 2025 STR laws. Always verify the latest short term rental regulations and Airbnb license requirements directly with local government authorities for Augusta to ensure full compliance before hosting.
(Source: AirROI data, 2025, based on 79% licensed listings)
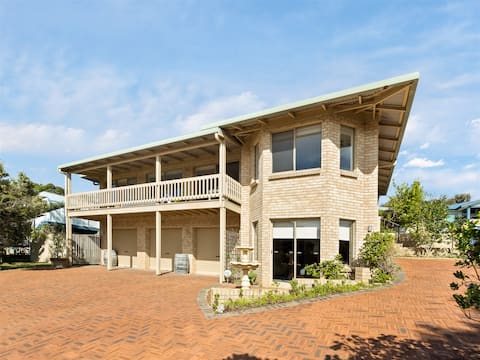
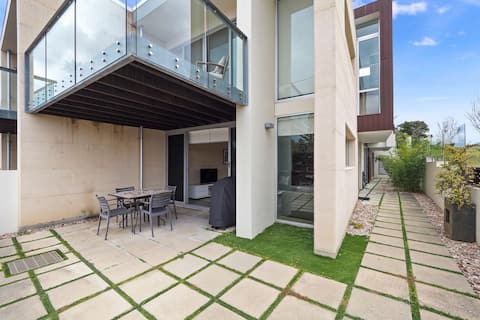
Top Performing Airbnb Properties in Augusta (2025)
Benchmark your potential! Explore examples of top-performing Airbnb properties in Augustabased on Trailing Twelve Month (TTM) revenue. Analyze their characteristics, revenue, occupancy rate, and ADR to understand what drives success in this market.

Moondyne Estate Pet Friendly Hilltop Retreat
Entire Place • 5 bedrooms
Whale Watch Family & Pet Friendly Augusta Retreat
Entire Place • 4 bedrooms
Augusta River View House- Bilya Mia
Entire Place • 2 bedrooms

The Shipwrights Mistress, Augusta
Entire Place • 2 bedrooms
Alouarn Apartment 2 - 2 bedroom
Entire Place • 4 bedrooms

Cosy beachside Shack
Entire Place • 3 bedrooms
Note: Performance varies based on location, size, amenities, seasonality, and management quality. Data reflects the past 12 months.
Top Performing Airbnb Hosts in Augusta (2025)
Learn from the best! This table showcases top-performing Airbnb hosts in Augusta based on the number of properties managed and estimated total revenue over the past year. Analyze their scale and performance metrics.
| Host Name | Properties | Grossing Revenue | Stay Reviews | Avg Rating |
|---|---|---|---|---|
| Maxine | 33 | $771,355 | 248 | 4.41/5.0 |
| Jana | 2 | $136,815 | 22 | 4.95/5.0 |
| Andrea | 3 | $89,823 | 16 | 5.00/5.0 |
| Kyra | 5 | $88,425 | 252 | 4.81/5.0 |
| Judith | 2 | $87,140 | 80 | 4.96/5.0 |
| Lance | 2 | $79,642 | 159 | 4.94/5.0 |
| Claire | 1 | $59,809 | 20 | 4.90/5.0 |
| Pepper | 1 | $56,337 | 139 | 4.97/5.0 |
| Sally | 2 | $51,369 | 257 | 4.88/5.0 |
| Toni | 1 | $48,295 | 66 | 4.85/5.0 |
Analyzing the strategies of top hosts, such as their property selection, pricing, and guest communication, can offer valuable lessons for optimizing your own Airbnb operations in Augusta.
Dive Deeper: Advanced Augusta STR Market Data (2025)
Ready to unlock more insights? AirROI provides access to advanced metrics and comprehensive Airbnb data for Augusta. Explore detailed analytics beyond this report to refine your investment strategy, optimize pricing, and maximize your vacation rental profits.
Explore Advanced MetricsAugusta Short-Term Rental Market Composition (2025): Property & Room Types
Room Type Distribution
Property Type Distribution
Market Composition Insights for Augusta
- The Augusta Airbnb market composition is heavily skewed towards Entire Home/Apt listings, which make up 90.1% of the 81 active rentals. This indicates strong guest preference for privacy and space.
- Looking at the property type distribution in Augusta, House properties are the most common (56.8%), reflecting the local real estate landscape.
- Houses represent a significant 56.8% portion, catering likely to families or larger groups.
- Smaller segments like others, hotel/boutique (combined 9.8%) offer potential for unique stay experiences.
Augusta Airbnb Room Capacity Analysis (2025): Bedroom Distribution
Distribution of Listings by Number of Bedrooms
Room Capacity Insights for Augusta
- The dominant room capacity in Augusta is 2 bedrooms listings, making up 34.6% of the market. This suggests a strong demand for properties suitable for couples or solo travelers.
- Together, 2 bedrooms and 3 bedrooms properties represent 61.8% of the active Airbnb listings in Augusta, indicating a high concentration in these sizes.
- A significant 43.3% of listings offer 3+ bedrooms, catering to larger groups and families seeking more space in Augusta.
Augusta Vacation Rental Guest Capacity Trends (2025)
Distribution of Listings by Guest Capacity
Guest Capacity Insights for Augusta
- The most common guest capacity trend in Augusta vacation rentals is listings accommodating 4 guests (27.2%). This suggests the primary traveler segment is likely small families or groups.
- Properties designed for 4 guests and 6 guests dominate the Augusta STR market, accounting for 54.4% of listings.
- 39.6% of properties accommodate 6+ guests, serving the market segment for larger families or group travel in Augusta.
- On average, properties in Augusta are equipped to host 4.7 guests.
Augusta Airbnb Booking Patterns (2025): Available vs. Booked Days
Available Days Distribution
Booked Days Distribution
Booking Pattern Insights for Augusta
- The most common availability pattern in Augusta falls within the 271-366 days range, representing 42% of listings. This suggests many properties have significant open periods on their calendars.
- Approximately 75.3% of listings show high availability (181+ days open annually), indicating potential for increased bookings or specific owner usage patterns.
- For booked days, the 31-90 days range is most frequent in Augusta (37%), reflecting common guest stay durations or potential owner blocking patterns.
- A notable 25.9% of properties secure long booking periods (181+ days booked per year), highlighting successful long-term rental strategies or significant owner usage.
Augusta Airbnb Minimum Stay Requirements Analysis
Distribution of Listings by Minimum Night Requirement
1 Night
3 listings
3.8% of total
2 Nights
24 listings
30.4% of total
3 Nights
6 listings
7.6% of total
4-6 Nights
1 listings
1.3% of total
30+ Nights
45 listings
57% of total
Key Insights
- The most prevalent minimum stay requirement in Augusta is 30+ Nights, adopted by 57% of listings. This highlights the market's preference for longer commitments.
- A significant segment (57%) caters to monthly stays (30+ nights) in Augusta, pointing to opportunities in the extended-stay market.
Recommendations
- Align with the market by considering a 30+ Nights minimum stay, as 57% of Augusta hosts use this setting.
- If feasible, allowing 1-night stays, especially midweek or during low season, could capture last-minute bookings, as only 3.8% currently do.
- A 2-night minimum appears standard (30.4%). Consider this for weekends or peak periods.
- Explore offering discounts for stays of 30+ nights to attract the 57% of the market seeking extended stays.
- Adjust minimum nights based on seasonality – potentially shorter during low season and longer during peak demand periods in Augusta.
Augusta Airbnb Cancellation Policy Trends Analysis (2025)
Super Strict 60 Days
2 listings
2.6% of total
Super Strict 30 Days
33 listings
42.3% of total
Flexible
7 listings
9% of total
Moderate
7 listings
9% of total
Firm
20 listings
25.6% of total
Strict
9 listings
11.5% of total
Cancellation Policy Insights for Augusta
- The prevailing Airbnb cancellation policy trend in Augusta is Super Strict 30 Days, used by 42.3% of listings.
- There's a relatively balanced mix between guest-friendly (18.0%) and stricter (37.1%) policies, offering choices for different guest needs.
Recommendations for Hosts
- Consider adopting a Super Strict 30 Days policy to align with the 42.3% market standard in Augusta.
- Using a Strict policy might deter some guests, as only 11.5% of listings use it. Evaluate if potential revenue protection outweighs possible lower booking rates.
- Regularly review your cancellation policy against competitors and market demand shifts in Augusta.
Augusta STR Booking Lead Time Analysis (2025)
Average Booking Lead Time by Month
Booking Lead Time Insights for Augusta
- The overall average booking lead time for vacation rentals in Augusta is 77 days.
- Guests book furthest in advance for stays during December (average 118 days), likely coinciding with peak travel demand or local events.
- The shortest booking windows occur for stays in August (average 50 days), indicating more last-minute travel plans during this time.
- Seasonally, Winter (100 days avg.) sees the longest lead times, while Summer (65 days avg.) has the shortest, reflecting typical travel planning cycles.
Recommendations for Hosts
- Use the overall average lead time (77 days) as a baseline for your pricing and availability strategy in Augusta.
- For December stays, consider implementing length-of-stay discounts or slightly higher rates for bookings made less than 118 days out to capitalize on advance planning.
- Target marketing efforts for the Winter season well in advance (at least 100 days) to capture early planners.
- Monitor your own booking lead times against these Augusta averages to identify opportunities for dynamic pricing adjustments.
Popular & Essential Airbnb Amenities in Augusta (2025)
Amenity Prevalence
Amenity Insights for Augusta
- Essential amenities in Augusta that guests expect include: Free parking on premises, Kitchen, Refrigerator. Lacking these (any) could significantly impact bookings.
- Popular amenities like Dishes and silverware, Smoke alarm, Hot water are common but not universal. Offering these can provide a competitive edge.
Recommendations for Hosts
- Ensure your listing includes all essential amenities for Augusta: Free parking on premises, Kitchen, Refrigerator.
- Prioritize adding missing essentials: Kitchen, Refrigerator.
- Consider adding popular differentiators like Dishes and silverware or Smoke alarm to increase appeal.
- Highlight unique or less common amenities you offer (e.g., hot tub, dedicated workspace, EV charger) in your listing description and photos.
- Regularly check competitor amenities in Augusta to stay competitive.
Augusta Airbnb Guest Demographics & Profile Analysis (2025)
Guest Profile Summary for Augusta
- The typical guest profile for Airbnb in Augusta consists of primarily domestic travelers (89%), often arriving from nearby Perth, typically belonging to the Post-2000s (Gen Z/Alpha) group (50%), primarily speaking English or French.
- Domestic travelers account for 89.4% of guests.
- Key international markets include Australia (89.4%) and United Kingdom (3.4%).
- Top languages spoken are English (70%) followed by French (9%).
- A significant demographic segment is the Post-2000s (Gen Z/Alpha) group, representing 50% of guests.
Recommendations for Hosts
- Target domestic marketing efforts towards travelers from Perth and Western Australia.
- Tailor amenities and listing descriptions to appeal to the dominant Post-2000s (Gen Z/Alpha) demographic (e.g., highlight fast WiFi, smart home features, local guides).
- Highlight unique local experiences or amenities relevant to the primary guest profile.
- Consider seasonal promotions aligned with peak travel times for key origin markets.
Nearby Short-Term Rental Market Comparison
How does the Augusta Airbnb market stack up against its neighbors? Compare key performance metrics like average monthly revenue, ADR, and occupancy rates in surrounding areas to understand the broader regional STR landscape.
| Market | Active Properties | Monthly Revenue | Daily Rate | Avg. Occupancy |
|---|---|---|---|---|
| Gracetown | 34 | $4,562 | $358.38 | 47% |
| Margaret River | 410 | $3,882 | $218.78 | 61% |
| Shire Of Augusta Margaret River | 96 | $3,824 | $252.66 | 56% |
| Gnarabup | 88 | $3,791 | $265.86 | 52% |
| Prevelly | 41 | $3,790 | $238.98 | 57% |
| Dunsborough | 446 | $3,762 | $289.15 | 48% |
| Yallingup | 238 | $3,754 | $334.67 | 46% |
| Witchcliffe | 20 | $3,753 | $304.52 | 56% |
| Peppermint Grove Beach | 35 | $3,750 | $326.50 | 39% |
| City Of Busselton | 535 | $3,637 | $301.10 | 44% |