Wodonga Airbnb Market Analysis 2025: Short Term Rental Data & Vacation Rental Statistics in Victoria, Australia
Is Airbnb profitable in Wodonga in 2025? Explore comprehensive Airbnb analytics for Wodonga, Victoria, Australia to uncover income potential. This 2025 STR market report for Wodonga, based on AirROI data from April 2024 to March 2025, reveals key trends in the niche market of 37 active listings.
Whether you're considering an Airbnb investment in Wodonga, optimizing your existing vacation rental, or exploring rental arbitrage opportunities, understanding the Wodonga Airbnb data is crucial. Leveraging the low regulation environment is key to maximizing your short term rental income potential. Let's dive into the specifics.
Key Wodonga Airbnb Performance Metrics Overview
Monthly Airbnb Revenue Variations & Income Potential in Wodonga (2025)
Understanding the monthly revenue variations for Airbnb listings in Wodonga is key to maximizing your short term rental income potential. Seasonality significantly impacts earnings. Our analysis, based on data from the past 12 months, shows that the peak revenue month for STRs in Wodonga is typically December, while August often presents the lowest earnings, highlighting opportunities for strategic pricing adjustments during shoulder and low seasons. Explore the typical Airbnb income in Wodonga across different performance tiers:
- Best-in-class properties (Top 10%) achieve $5,223+ monthly, often utilizing dynamic pricing and superior guest experiences.
- Strong performing properties (Top 25%) earn $3,994 or more, indicating effective management and desirable locations/amenities.
- Typical properties (Median) generate around $2,406 per month, representing the average market performance.
- Entry-level properties (Bottom 25%) see earnings around $1,481, often with potential for optimization.
Average Monthly Airbnb Earnings Trend in Wodonga
Wodonga Airbnb Occupancy Rate Trends (2025)
Maximize your bookings by understanding the Wodonga STR occupancy trends. Seasonal demand shifts significantly influence how often properties are booked. Typically, Decembersees the highest demand (peak season occupancy), while May experiences the lowest (low season). Effective strategies, like adjusting minimum stays or offering promotions, can boost occupancy during slower periods. Here's how different property tiers perform in Wodonga:
- Best-in-class properties (Top 10%) achieve 88%+ occupancy, indicating high desirability and potentially optimized availability.
- Strong performing properties (Top 25%) maintain 79% or higher occupancy, suggesting good market fit and guest satisfaction.
- Typical properties (Median) have an occupancy rate around 65%.
- Entry-level properties (Bottom 25%) average 44% occupancy, potentially facing higher vacancy.
Average Monthly Occupancy Rate Trend in Wodonga
Average Daily Rate (ADR) Airbnb Trends in Wodonga (2025)
Effective short term rental pricing strategy in Wodonga involves understanding monthly ADR fluctuations. The Average Daily Rate (ADR) for Airbnb in Wodonga typically peaks in December and dips lowest during August. Leveraging Airbnb dynamic pricing tools or strategies based on this seasonality can significantly boost revenue. Here's a look at the typical nightly rates achieved:
- Best-in-class properties (Top 10%) command rates of $213+ per night, often due to premium features or locations.
- Strong performing properties (Top 25%) achieve nightly rates of $176 or more.
- Typical properties (Median) charge around $137 per night.
- Entry-level properties (Bottom 25%) earn around $87 per night.
Average Daily Rate (ADR) Trend by Month in Wodonga
Get Live Wodonga Market Intelligence 👇

Explore Real-time Analytics
Airbnb Seasonality Analysis & Trends in Wodonga (2025)
Peak Season (December, June, April)
- Revenue averages $3,170 per month
- Occupancy rates average 61.3%
- Daily rates average $138
Shoulder Season
- Revenue averages $2,810 per month
- Occupancy maintains around 60.6%
- Daily rates hold near $136
Low Season (February, March, August)
- Revenue drops to average $2,375 per month
- Occupancy decreases to average 57.7%
- Daily rates adjust to average $135
Seasonality Insights for Wodonga
- The Airbnb seasonality in Wodonga shows moderate seasonality with distinct peak and low periods. While the sections above show seasonal averages, it's also insightful to look at the extremes:
- During the high season, the absolute peak month showcases Wodonga's highest earning potential, with monthly revenues capable of climbing to $3,277, occupancy reaching a high of 65.9%, and ADRs peaking at $153.
- Conversely, the slowest single month of the year, typically falling within the low season, marks the market's lowest point. In this month, revenue might dip to $2,359, occupancy could drop to 51.6%, and ADRs may adjust down to $129.
- Understanding both the seasonal averages and these monthly peaks and troughs in revenue, occupancy, and ADR is crucial for maximizing your Airbnb profit potential in Wodonga.
Seasonal Strategies for Maximizing Profit
- Peak Season: Maximize revenue through premium pricing and potentially longer minimum stays. Ensure high availability.
- Low Season: Offer competitive pricing, special promotions (e.g., extended stay discounts), and flexible cancellation policies. Target off-season travelers like remote workers or budget-conscious guests.
- Shoulder Seasons: Implement dynamic pricing that balances peak and low rates. Target weekend travelers or specific events. Offer slightly more flexible terms than peak season.
- Regularly analyze your own performance against these Wodonga seasonality benchmarks and adjust your pricing and availability strategy accordingly.
Best Areas for Airbnb Investment in Wodonga (2025)
Exploring the top neighborhoods for short-term rentals in Wodonga? This section highlights key areas, outlining why they are attractive for hosts and guests, along with notable local attractions. Consider these locations based on your target guest profile and investment strategy.
| Neighborhood / Area | Why Host Here? (Target Guests & Appeal) | Key Attractions & Landmarks |
|---|---|---|
| Central Wodonga | Heart of Wodonga with easy access to dining, shopping, and local attractions. Ideal location for tourists and business travelers alike. | Wodonga Botanic Gardens, Wodonga Plaza, La Trobe University, Hume Wodonga Health, local markets |
| Albury/Wodonga Border | This area attracts visitors looking to explore both cities, offering convenient access to both Albury and Wodonga's amenities. | Noreuil Park, Murray River, Albury Botanic Gardens, Albury's shopping precinct, Civic Place |
| Kiewa Valley | Natural surroundings make this area appealing for outdoor enthusiasts and those seeking a peaceful retreat away from urban life. | Kiewa Valley Park, Mount Beauty, Kiewa River, skiing in winter, hiking trails |
| Wodonga Racecourse | A popular location for events and racing, attracting visitors for major events and weekends. | Wodonga Racecourse, local fairs, community events, food festivals, scenic drives |
| Surf Beach | A leisure area with local beaches offering various recreational activities, great for families and beachgoers. | beach activities, picnic spots, local cafes, swimming, walking trails |
| Bonegilla | A historical site attracting those interested in heritage and history, including those interested in the area's migration history. | Bonegilla Migrant Experience, historical buildings, guided tours, local storytelling, community events |
| Lavington | Lavington is a growing suburb with various shopping and dining options, making it attractive to both short-term and long-term visitors. | Lavington Square, local restaurants, family parks, bargain shopping, community events |
| Beagle Bay | Great for nature lovers, this serene area offers beautiful landscapes and opportunities for outdoor activities. | nature walks, wildlife viewing, camping sites, picnic areas, scenic viewpoints |
Understanding Airbnb License Requirements & STR Laws in Wodonga (2025)
While Wodonga, Victoria, Australia currently shows low STR regulations, specific Airbnb license requirements might still exist or change. Always verify the latest short term rental regulations and Airbnb license requirements directly with local government authorities for Wodonga to ensure full compliance before hosting.
(Source: AirROI data, 2025, finding no licensed listings among those analyzed)
Top Performing Airbnb Properties in Wodonga (2025)
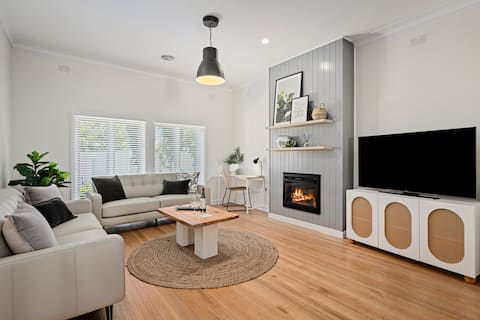
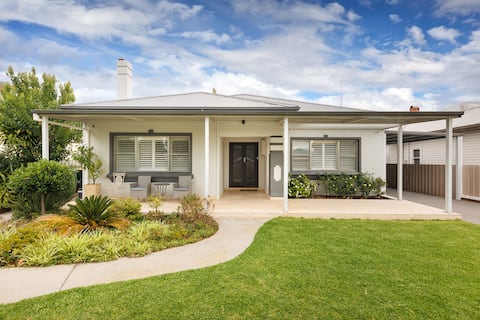
Benchmark your potential! Explore examples of top-performing Airbnb properties in Wodongabased on Trailing Twelve Month (TTM) revenue. Analyze their characteristics, revenue, occupancy rate, and ADR to understand what drives success in this market.

Haldon House- spacious & comfy
Entire Place • 4 bedrooms
Frankie's Place- lux & stylish
Entire Place • 3 bedrooms
Central Entertainer's Paradise
Entire Place • 3 bedrooms

The Vines
Entire Place • 4 bedrooms

"Huonview" House on the Hill.
Entire Place • 4 bedrooms

Grand retreat in peaceful street
Entire Place • 3 bedrooms
Note: Performance varies based on location, size, amenities, seasonality, and management quality. Data reflects the past 12 months.
Top Performing Airbnb Hosts in Wodonga (2025)
Learn from the best! This table showcases top-performing Airbnb hosts in Wodonga based on the number of properties managed and estimated total revenue over the past year. Analyze their scale and performance metrics.
| Host Name | Properties | Grossing Revenue | Stay Reviews | Avg Rating |
|---|---|---|---|---|
| Jane | 6 | $269,539 | 314 | 4.96/5.0 |
| Jack | 3 | $131,577 | 191 | 4.89/5.0 |
| Abhi | 2 | $69,811 | 136 | 4.93/5.0 |
| Rozz | 1 | $55,960 | 9 | 5.00/5.0 |
| Danny And Kerri-Ann | 1 | $52,307 | 15 | 5.00/5.0 |
| Pauline | 1 | $41,338 | 53 | 4.98/5.0 |
| Dianne | 1 | $40,219 | 131 | 5.00/5.0 |
| Judy | 1 | $39,710 | 182 | 4.96/5.0 |
| Colleen | 1 | $36,544 | 26 | 5.00/5.0 |
| Robyn | 2 | $32,784 | 291 | 4.89/5.0 |
Analyzing the strategies of top hosts, such as their property selection, pricing, and guest communication, can offer valuable lessons for optimizing your own Airbnb operations in Wodonga.
Dive Deeper: Advanced Wodonga STR Market Data (2025)
Ready to unlock more insights? AirROI provides access to advanced metrics and comprehensive Airbnb data for Wodonga. Explore detailed analytics beyond this report to refine your investment strategy, optimize pricing, and maximize your vacation rental profits.
Explore Advanced MetricsWodonga Short-Term Rental Market Composition (2025): Property & Room Types
Room Type Distribution
Property Type Distribution
Market Composition Insights for Wodonga
- The Wodonga Airbnb market composition is heavily skewed towards Entire Home/Apt listings, which make up 91.9% of the 37 active rentals. This indicates strong guest preference for privacy and space.
- Looking at the property type distribution in Wodonga, House properties are the most common (78.4%), reflecting the local real estate landscape.
- Houses represent a significant 78.4% portion, catering likely to families or larger groups.
- The presence of 8.1% Hotel/Boutique listings indicates integration with traditional hospitality.
- Smaller segments like apartment/condo (combined 2.7%) offer potential for unique stay experiences.
Wodonga Airbnb Room Capacity Analysis (2025): Bedroom Distribution
Distribution of Listings by Number of Bedrooms
Room Capacity Insights for Wodonga
- The dominant room capacity in Wodonga is 3 bedrooms listings, making up 29.7% of the market. This suggests a strong demand for properties suitable for families or small groups.
- Together, 3 bedrooms and 2 bedrooms properties represent 54.0% of the active Airbnb listings in Wodonga, indicating a high concentration in these sizes.
- A significant 48.6% of listings offer 3+ bedrooms, catering to larger groups and families seeking more space in Wodonga.
Wodonga Vacation Rental Guest Capacity Trends (2025)
Distribution of Listings by Guest Capacity
Guest Capacity Insights for Wodonga
- The most common guest capacity trend in Wodonga vacation rentals is listings accommodating 6 guests (27%). This suggests the primary traveler segment is likely larger groups.
- Properties designed for 6 guests and 2 guests dominate the Wodonga STR market, accounting for 45.9% of listings.
- 45.9% of properties accommodate 6+ guests, serving the market segment for larger families or group travel in Wodonga.
- On average, properties in Wodonga are equipped to host 4.6 guests.
Wodonga Airbnb Booking Patterns (2025): Available vs. Booked Days
Available Days Distribution
Booked Days Distribution
Booking Pattern Insights for Wodonga
- The most common availability pattern in Wodonga falls within the 91-180 days range, representing 51.4% of listings. This suggests many properties have significant open periods on their calendars.
- Approximately 27.0% of listings show high availability (181+ days open annually), indicating potential for increased bookings or specific owner usage patterns.
- For booked days, the 181-270 days range is most frequent in Wodonga (51.4%), reflecting common guest stay durations or potential owner blocking patterns.
- A notable 73.0% of properties secure long booking periods (181+ days booked per year), highlighting successful long-term rental strategies or significant owner usage.
Wodonga Airbnb Minimum Stay Requirements Analysis
Distribution of Listings by Minimum Night Requirement
1 Night
11 listings
29.7% of total
2 Nights
10 listings
27% of total
3 Nights
1 listings
2.7% of total
30+ Nights
15 listings
40.5% of total
Key Insights
- The most prevalent minimum stay requirement in Wodonga is 30+ Nights, adopted by 40.5% of listings. This highlights the market's preference for longer commitments.
- A significant segment (40.5%) caters to monthly stays (30+ nights) in Wodonga, pointing to opportunities in the extended-stay market.
Recommendations
- Align with the market by considering a 30+ Nights minimum stay, as 40.5% of Wodonga hosts use this setting.
- If feasible, allowing 1-night stays, especially midweek or during low season, could capture last-minute bookings, as only 29.7% currently do.
- Explore offering discounts for stays of 30+ nights to attract the 40.5% of the market seeking extended stays.
- Adjust minimum nights based on seasonality – potentially shorter during low season and longer during peak demand periods in Wodonga.
Wodonga Airbnb Cancellation Policy Trends Analysis (2025)
Flexible
12 listings
33.3% of total
Moderate
20 listings
55.6% of total
Firm
4 listings
11.1% of total
Cancellation Policy Insights for Wodonga
- The prevailing Airbnb cancellation policy trend in Wodonga is Moderate, used by 55.6% of listings.
- The market strongly favors guest-friendly terms, with 88.9% of listings offering Flexible or Moderate policies. This suggests guests in Wodonga may expect booking flexibility.
Recommendations for Hosts
- Consider adopting a Moderate policy to align with the 55.6% market standard in Wodonga.
- Regularly review your cancellation policy against competitors and market demand shifts in Wodonga.
Wodonga STR Booking Lead Time Analysis (2025)
Average Booking Lead Time by Month
Booking Lead Time Insights for Wodonga
- The overall average booking lead time for vacation rentals in Wodonga is 39 days.
- Guests book furthest in advance for stays during December (average 61 days), likely coinciding with peak travel demand or local events.
- The shortest booking windows occur for stays in September (average 28 days), indicating more last-minute travel plans during this time.
- Seasonally, Winter (50 days avg.) sees the longest lead times, while Fall (36 days avg.) has the shortest, reflecting typical travel planning cycles.
Recommendations for Hosts
- Use the overall average lead time (39 days) as a baseline for your pricing and availability strategy in Wodonga.
- For December stays, consider implementing length-of-stay discounts or slightly higher rates for bookings made less than 61 days out to capitalize on advance planning.
- Target marketing efforts for the Winter season well in advance (at least 50 days) to capture early planners.
- Monitor your own booking lead times against these Wodonga averages to identify opportunities for dynamic pricing adjustments.
Popular & Essential Airbnb Amenities in Wodonga (2025)
Amenity Prevalence
Amenity Insights for Wodonga
- Essential amenities in Wodonga that guests expect include: TV, Air conditioning, Heating, Bed linens. Lacking these (any) could significantly impact bookings.
- Popular amenities like Hot water, Smoke alarm, Wifi are common but not universal. Offering these can provide a competitive edge.
- Warning: Wifi is not universally provided but is considered essential globally. Ensure reliable Wifi is offered.
Recommendations for Hosts
- Ensure your listing includes all essential amenities for Wodonga: TV, Air conditioning, Heating, Bed linens.
- Prioritize adding missing essentials: Bed linens.
- Consider adding popular differentiators like Hot water or Smoke alarm to increase appeal.
- Highlight unique or less common amenities you offer (e.g., hot tub, dedicated workspace, EV charger) in your listing description and photos.
- Regularly check competitor amenities in Wodonga to stay competitive.
Wodonga Airbnb Guest Demographics & Profile Analysis (2025)
Guest Profile Summary for Wodonga
- The typical guest profile for Airbnb in Wodonga consists of primarily domestic travelers (96%), often arriving from nearby Melbourne, typically belonging to the Post-2000s (Gen Z/Alpha) group (50%), primarily speaking English or Chinese.
- Domestic travelers account for 95.8% of guests.
- Key international markets include Australia (95.8%) and United Kingdom (0.7%).
- Top languages spoken are English (72.1%) followed by Chinese (5.9%).
- A significant demographic segment is the Post-2000s (Gen Z/Alpha) group, representing 50% of guests.
Recommendations for Hosts
- Target domestic marketing efforts towards travelers from Melbourne and Sydney.
- Tailor amenities and listing descriptions to appeal to the dominant Post-2000s (Gen Z/Alpha) demographic (e.g., highlight fast WiFi, smart home features, local guides).
- Highlight unique local experiences or amenities relevant to the primary guest profile.
- Consider seasonal promotions aligned with peak travel times for key origin markets.
Nearby Short-Term Rental Market Comparison
How does the Wodonga Airbnb market stack up against its neighbors? Compare key performance metrics like average monthly revenue, ADR, and occupancy rates in surrounding areas to understand the broader regional STR landscape.
| Market | Active Properties | Monthly Revenue | Daily Rate | Avg. Occupancy |
|---|---|---|---|---|
| Howqua Inlet | 13 | $3,634 | $322.01 | 37% |
| Bright | 474 | $3,468 | $294.34 | 42% |
| Porepunkah | 40 | $3,397 | $328.54 | 37% |
| Nagambie | 33 | $3,381 | $300.42 | 40% |
| Shire of Mansfield | 89 | $3,347 | $392.77 | 34% |
| Shire of Strathbogie | 43 | $3,173 | $314.72 | 37% |
| Jamieson | 37 | $3,138 | $283.80 | 33% |
| Wandiligong | 20 | $3,137 | $271.79 | 41% |
| Shire of Murrindindi | 70 | $3,061 | $268.84 | 40% |
| Beechworth | 110 | $3,056 | $251.89 | 41% |